Comparative Study
. 2016 Jul 1;57(9):OCT130-40.
doi: 10.1167/iovs.15-18932.

Imaging Foveal Microvasculature: Optical Coherence Tomography Angiography Versus Adaptive Optics Scanning Light Ophthalmoscope Fluorescein Angiography

Affiliations
Comparative Study

Imaging Foveal Microvasculature: Optical Coherence Tomography Angiography Versus Adaptive Optics Scanning Light Ophthalmoscope Fluorescein Angiography

Shelley Mo et al. Invest Ophthalmol Vis Sci. .

Abstract

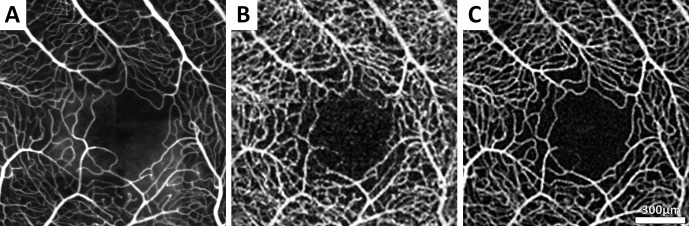
Purpose: To compare the use of optical coherence tomography angiography (OCTA) and adaptive optics scanning light ophthalmoscope fluorescein angiography (AOSLO FA) for characterizing the foveal microvasculature in healthy and vasculopathic eyes.

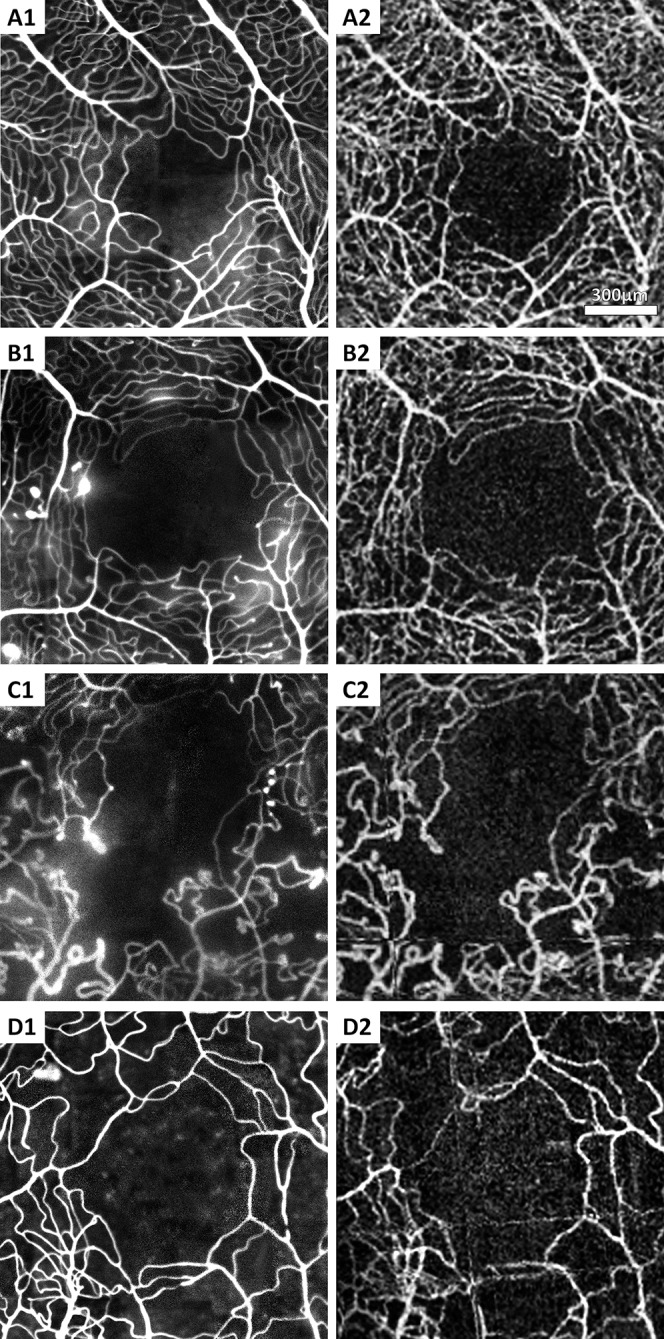
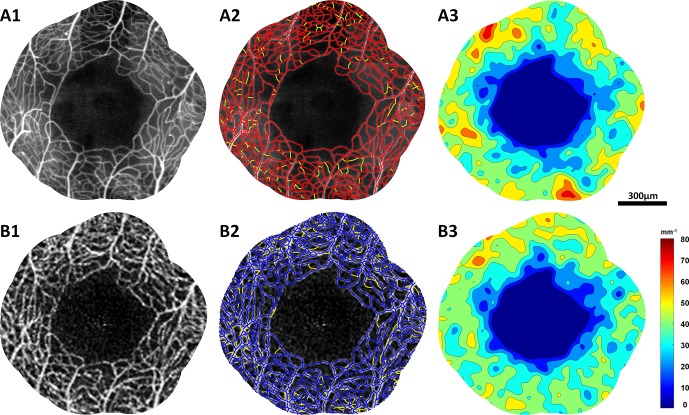
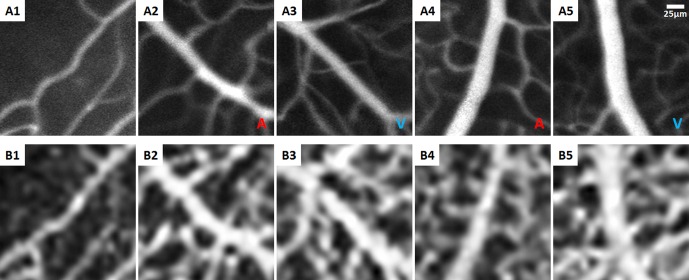
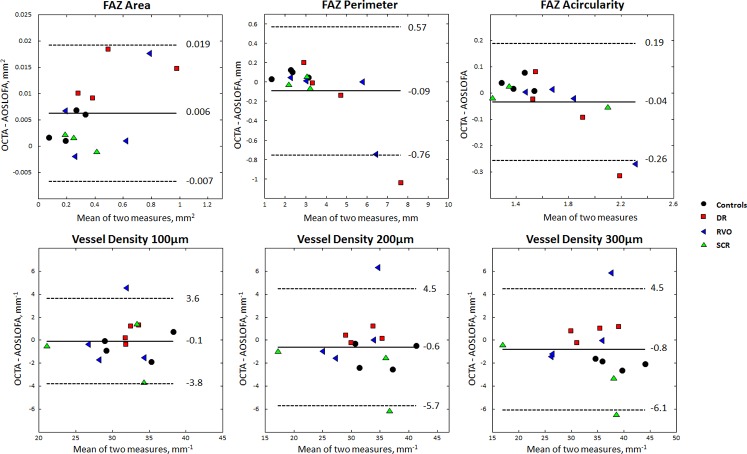
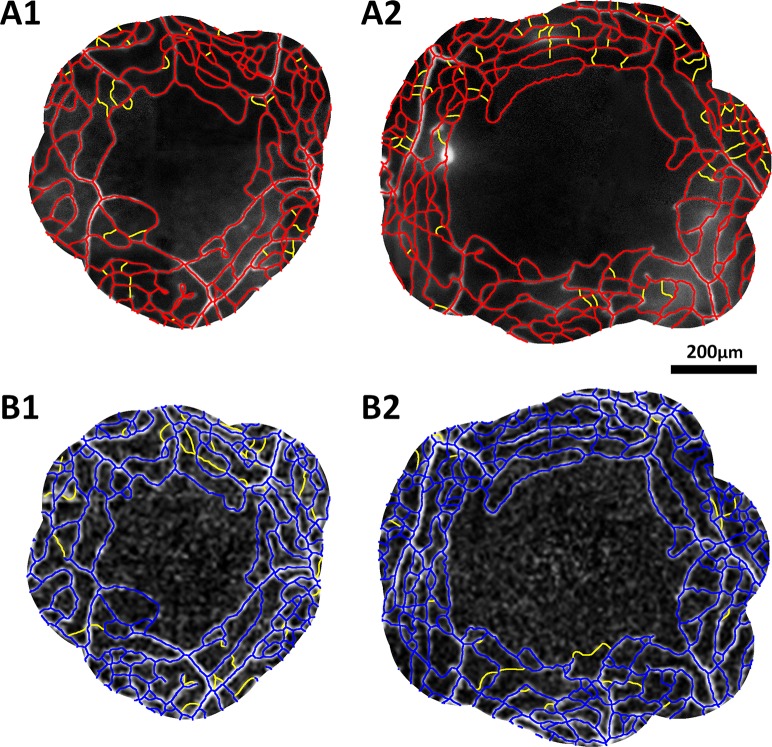
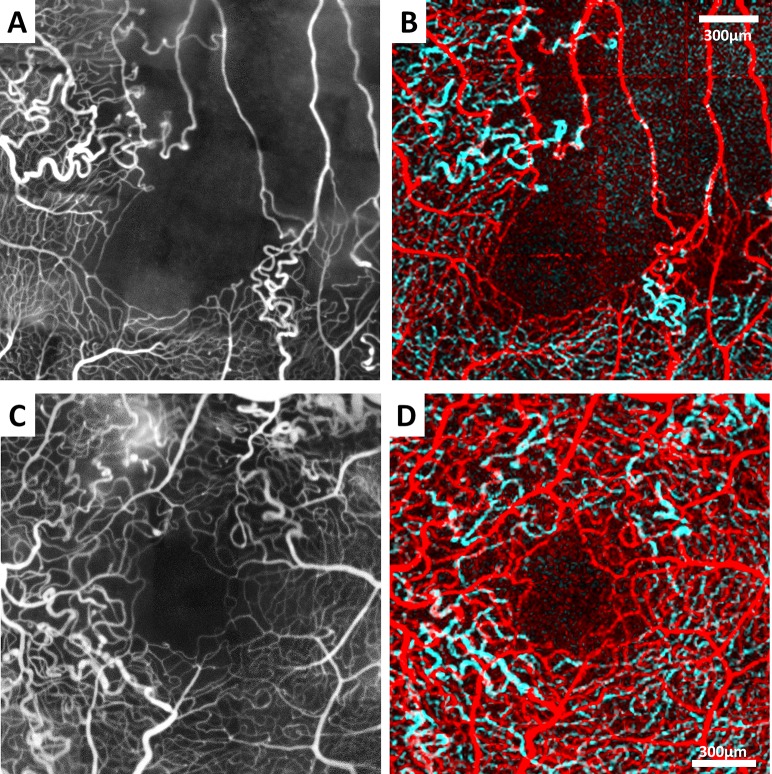
Methods: Four healthy controls and 11 vasculopathic patients (4 diabetic retinopathy, 4 retinal vein occlusion, and 3 sickle cell retinopathy) were imaged with OCTA and AOSLO FA. Foveal perfusion maps were semiautomatically skeletonized for quantitative analysis, which included foveal avascular zone (FAZ) metrics (area, perimeter, acircularity index) and vessel density in three concentric annular regions of interest. On each set of OCTA and AOSLO FA images, matching vessel segments were used for lumen diameter measurement. Qualitative image comparisons were performed by visual identification of microaneurysms, vessel loops, leakage, and vessel segments.

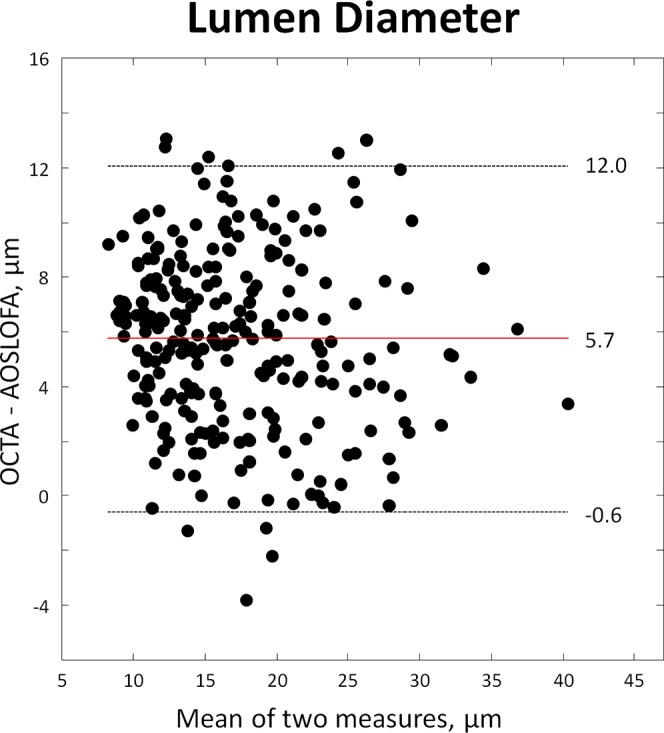
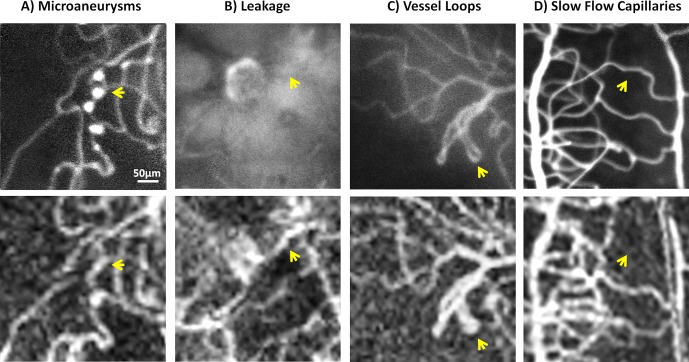
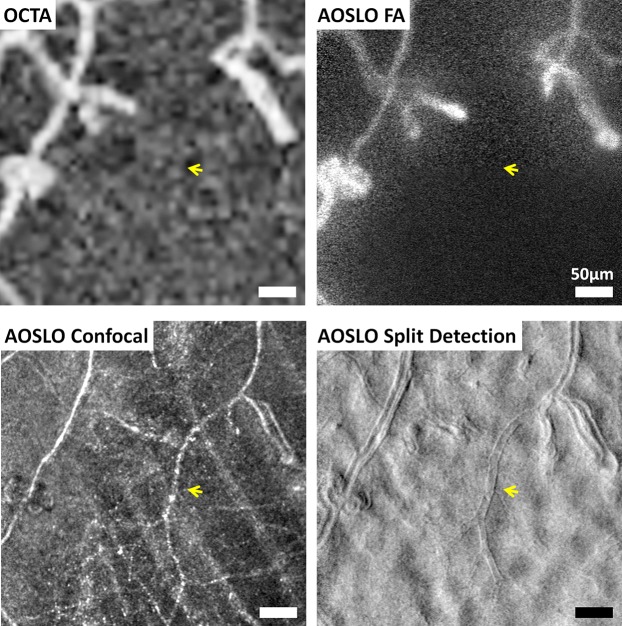
Results: Adaptive optics scanning light ophthalmoscope FA and OCTA showed no statistically significant differences in FAZ perimeter, acircularity index, and vessel densities. Foveal avascular zone area, however, showed a small but statistically significant difference of 1.8% (P = 0.004). Lumen diameter was significantly larger on OCTA (mean difference 5.7 μm, P < 0.001). Microaneurysms, fine structure of vessel loops, leakage, and some vessel segments were visible on AOSLO FA but not OCTA, while blood vessels obscured by leakage were visible only on OCTA.

Conclusions: Optical coherence tomography angiography is comparable to AOSLO FA at imaging the foveal microvasculature except for differences in FAZ area, lumen diameter, and some qualitative features. These results, together with its ease of use, short acquisition time, and avoidance of potentially phototoxic blue light, support OCTA as a tool for monitoring ocular pathology and detecting early disease.


Figures

Figure 1
Figure 1
Adaptive optics scanning light ophthalmoscope FA (left column) and OCTA (right column) perfusion images centered at the fovea of four subjects. (A) Healthy control. (B) Diabetic retinopathy. (C) Retinal vein occlusion. (D) Sickle cell retinopathy.
Figure 2
Figure 2
Adaptive optics scanning light ophthalmoscope FA (top row) and OCTA (bottom row) images of a healthy control subject (RR_0232). (A1, B1) Perfusion maps covering the 300-μm ROI. (A2, B2) Skeletonizations of perfusion maps with AOSLO FA in red, OCTA in blue; missing blood vessel segments seen on the other modality were indicated in yellow. (A3, B3) Density color contour maps produced from the skeletonizations.
Figure 3
Figure 3
A selection of corresponding vessel segments with varying lumen diameters on AOSLO FA (top row) and OCTA (bottom row) images in a healthy control subject (RR_0424). (A1, B1) Capillary segment at the FAZ margin. (A2A5, B2B5) Arteriolar and venular segments located within 3° from the fovea. Arterial and venules are marked in A and V, respectively.
Figure 4
Figure 4
Bland-Altman plots showing differences between AOSLO FA and OCTA in FAZ metrics (top row) and vessel densities at each ROI (bottom row). Mean difference is shown by the bold horizontal line in each plot with 95% confidence interval shown by the dashed horizontal lines. Healthy controls are marked with black circles, diabetic retinopathy (DR) patients are marked with red squares, retinal vein occlusion (RVO) patients are marked with blue triangles, and sickle cell retinopathy (SCR) patients are marked with green triangles.
Figure 5
Figure 5
Bland-Altman plot showing differences between AOSLO FA and OCTA in lumen diameter measurements. Mean difference is shown by the red horizontal line with 95% confidence interval shown by the dashed horizontal lines.
Figure 6
Figure 6
Representative images of pathologic features seen with AOSLO FA (top row) and OCTA (bottom row); yellow arrows highlight differences. (A) Microaneurysms seen on AOSLO FA but not OCTA. (B) Leakage obscuring a vessel on AOSLO FA, but the same vessel is visible on OCTA. (C) Vessel loop fine structure was seen clearly on AOSLO FA but is not as well delineated on OCTA. (D) Capillaries with slow flow seen on AOSLO FA but not on OCTA.
Figure 7
Figure 7
Skeletonizations of AOSLO FA (top row, red) and OCTA (bottom row, blue) images covering the 200-μm ROI in (1) a healthy control subject (RR_0424) and (2) a diabetic retinopathy subject (RR_0217). Missing vessel segments compared to the other modality are highlighted in yellow.
Figure 8
Figure 8
Imaging nonperfused capillaries in a subject with diabetic retinopathy (RR_0449) using AOSLO. Nonperfused capillaries (yellow arrows) are clearly visible on AOSLO confocal reflectance and AOSLO split detection (bottom row) but not on OCTA and AOSLO FA (top row).
Figure 9
Figure 9
Images from a healthy control subject (RR_0424). (A) Adaptive optics scanning light ophthalmoscope FA perfusion map. (B) Optical coherence tomography angiography full vessel layer perfusion map generated from a single scan with AngioVue software. (C) Optical coherence tomography angiography full vessel layer generated from registering and averaging five scans with custom MATLAB software.
Figure 10
Figure 10
Visualization of the superficial and deep capillary plexus. Images from two subjects with retinal vein occlusion (top row: RR_0129; bottom row: RR_0414). (A, C) Adaptive optics scanning light ophthalmoscope FA. (B, D) Optical coherence tomography angiography color overlay with superficial vessels in red and deeper vessels in cyan.

References

    1. Adler FH. Further notes on the metabolism of the retina. Trans Am Ophthalmol Soc. 1931; 29: 233–241. - PMC - PubMed
    1. Snodderly DM,, Weinhaus RS,, Choi JC. Neural-vascular relationships in central retina of macaque monkeys (Macaca fascicularis). J Neurosci. 1992. ; 12: 1169–1193. - PMC - PubMed
    1. Yu PK,, Balaratnasingam C,, Cringle SJ,, McAllister IL,, Provis J,, Yu DY. Microstructure and network organization of the microvasculature in the human macula. Invest Ophthalmol Vis Sci. 2010. ; 51: 6735–6743. - PubMed
    1. Bek T. Regional morphology and pathophysiology of retinal vascular disease. Prog Retin Eye Res. 2013. ; 36: 247–259. - PubMed
    1. Novotny HR,, Alvis DL. A method of photographing fluorescence in circulating blood in the human retina. Circulation. 1961. ; 24: 82–86. - PubMed

Publication types

MeSH terms