Review
. 2016 Jul 1;57(9):OCT14-26.
doi: 10.1167/iovs.16-19969.

Optical Coherence Tomography and the Development of Antiangiogenic Therapies in Neovascular Age-Related Macular Degeneration

Review

Optical Coherence Tomography and the Development of Antiangiogenic Therapies in Neovascular Age-Related Macular Degeneration

Philip J Rosenfeld. Invest Ophthalmol Vis Sci. .

Abstract

Purpose: To explain the pivotal role optical coherence tomography (OCT) imaging had in the development of antiangiogenic therapies for the treatment of neovascular age-related macular degeneration (nvAMD).

Methods: A historical literature review was combined with personal perspectives from the introduction of OCT imaging and the early clinical use of vascular endothelial growth factor (VEGF) inhibitors.

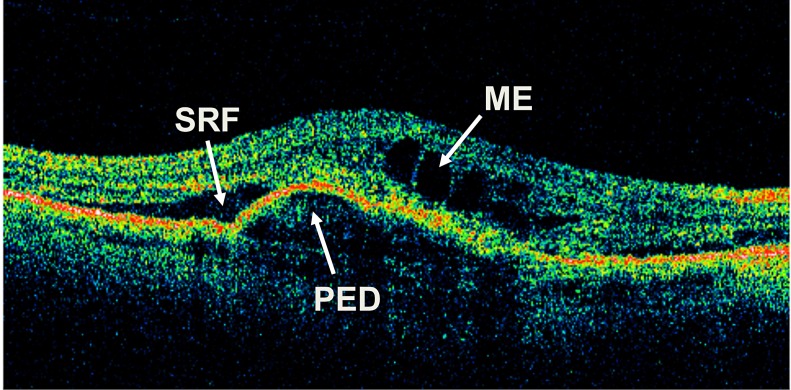
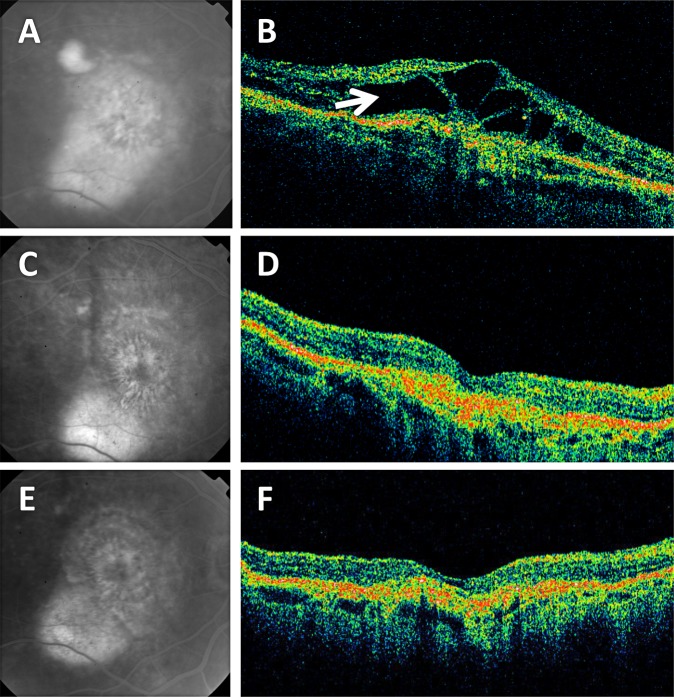
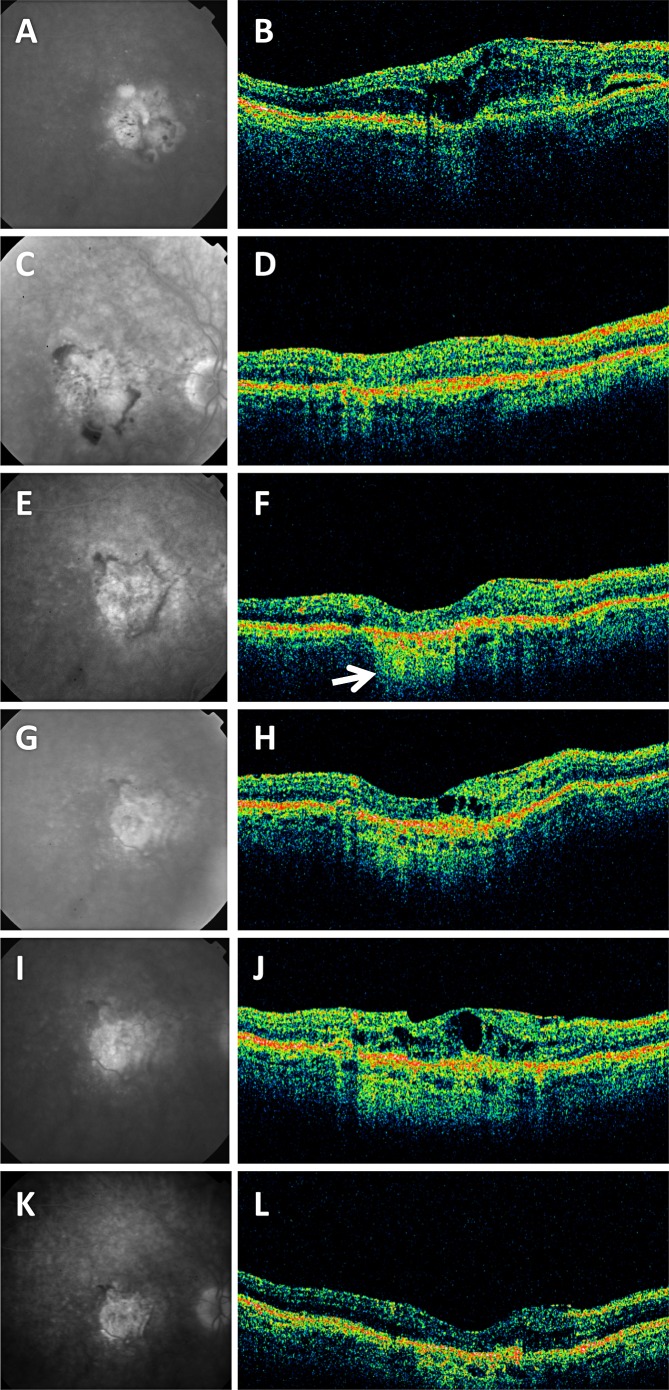
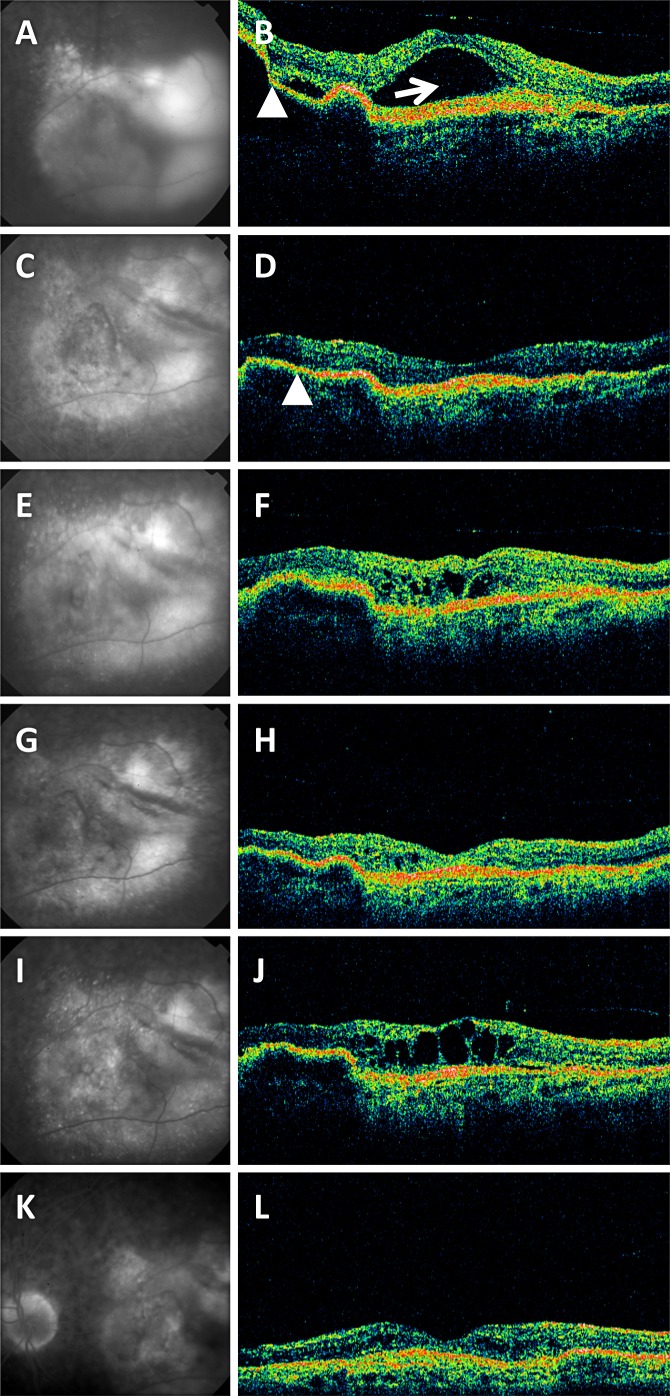
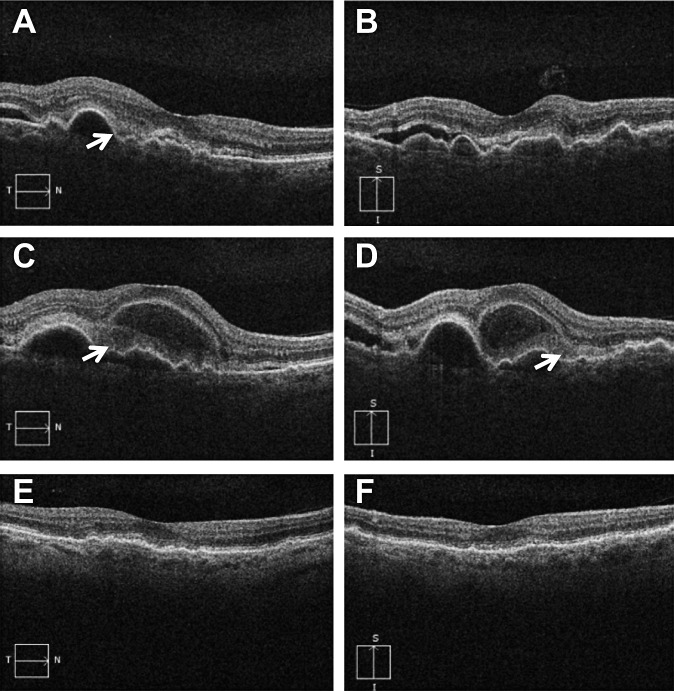
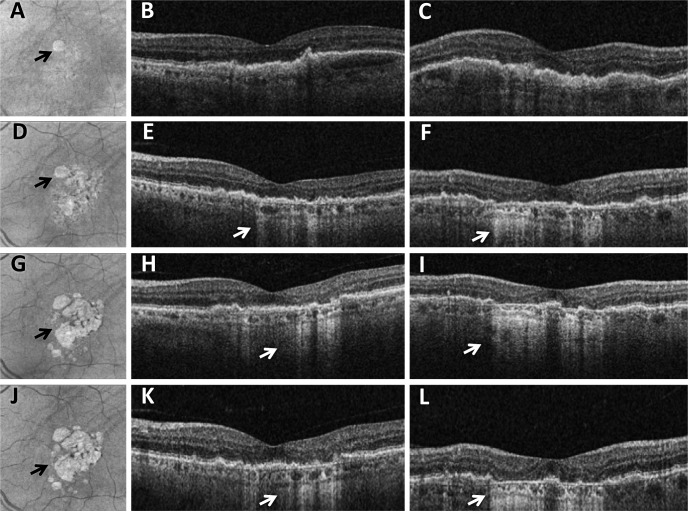
Results: At the time that OCT emerged, the gold standard for imaging of nvAMD was fluorescein angiography (FA), a time-consuming, dye-based, invasive technique that provided en face images of the retina and was used to characterize leakage, perfusion status, and the types of macular neovascularization (MNV). In comparison, OCT imaging was a fast, safe, noninvasive technique that complemented FA imaging by providing cross-sectional images of the macula. OCT was able to visualize and quantify the macular fluid that was associated with the presence of excess VEGF, which was identified by intraretinal fluid, subretinal fluid, and fluid under the retinal pigment epithelium (RPE). Clinicians quickly appreciated the benefits of OCT imaging for following macular fluid after anti-VEGF therapy. By observing the qualitative and quantitative changes in macular fluid depicted by OCT imaging, clinicians were empowered to compare anti-VEGF drugs and move from fixed-dosing regimens to patient-specific dosing strategies requiring fewer injections.

Conclusions: Optical coherence tomography imaging was adopted as a VEGF-meter, a method to detect excess VEGF, and evolved to become the gold standard imaging strategy for diagnosing nvAMD, assessing treatment responses to anti-VEGF drugs, deciding when to re-treat, and evaluating disease progression.


Figures

Figure 1
Figure 1
Time-domain optical coherence tomography B-scan through the central macula of an eye with neovascular age-related macular degeneration showing macular edema (ME), subretinal fluid (SRF), and a retinal pigment epithelial detachment (PED).
Figure 2
Figure 2
Late fluorescein angiographic (FA) images and time-domain optical coherence tomography (OCT) diagonal B-scans from a patient treated with intravitreal ranibizumab in the phase II study, then followed in the extension study with observation and no additional retreatments with ranibizumab. (A, C, E) Late FA images. (B, D, F) Diagonal OCT B-scans. (A) Baseline late FA image showing diffuse leakage. Visual acuity (VA) was 20/125. (B) Corresponding baseline OCT image showed cystic macular edema (arrow). (C) After eight injections over 140 days, the FA leakage had significantly diminished, and VA improved to 20/80. (D) Corresponding OCT B-scan showed resolution of the macular edema. (E) After an additional 22 months without any ranibizumab injections, VA improved to 20/32 and there was no evidence FA leakage. (F) Corresponding OCT B-scan showed a persistently dry macula.
Figure 3
Figure 3
Late fluorescein angiographic (FA) images and time-domain optical coherence tomography (OCT) diagonal B-scans from a patient treated with intravitreal ranibizumab in the phase II study, then followed in the extension study with observation and retreatment with ranibizumab. (A, C, E, G, I, K) Late FA images. (B, D, F, H, J, L) Diagonal OCT B-scans. (A) Baseline late FA image showed diffuse leakage. Visual acuity (VA) was 20/200. (B) Baseline OCT image showed cystic macular edema. (C) Two weeks later, VA improved to 20/160, and the FA image showed significant reduction in leakage with focal areas of blocked fluorescence at the margin of the lesion consistent with hemorrhages. (D) Corresponding OCT B-scan with significant resolution of macular edema 2 weeks after the first injection. (E) After 140 days and 10 injections from baseline, VA improved to 20/100, and late FA image showed no leakage with near-complete resolution of the hemorrhages. (F) Corresponding OCT B-scan showed resolution of the macular edema with evidence of macular atrophy as seen by the hypertransmission of light into the choroid (arrow). No treatment was given. (G) After 10 months without treatment, VA was stable at 20/100, but the late FA image showed minimal leakage. (H) Corresponding OCT B-scan showed the appearance of small intraretinal cysts indicative of recurrent macular fluid. No treatment was given. (I) After 4 months without treatment, VA remained unchanged at 20/100 but the patient was complaining of increasing distortion. The FA image showed increased leakage. (J) Corresponding OCT B-scan showed increased macular edema, and a ranibizumab injection was performed. (K) Five months after retreatment, VA improved to 20/63 and the FA image showed no leakage. (L) Corresponding OCT B-scan showed minimal macular thickening nasal to the fovea. Overall, OCT-guided retreatment improved VA, decreased FA leakage, and decreased the macular fluid.
Figure 4
Figure 4
Late fluorescein angiographic (FA) images and time-domain optical coherence tomography (OCT) diagonal B-scans from a patient treated with intravitreal ranibizumab in the phase II study, followed in the extension study by observation and then retreatment with ranibizumab. (A, C, E, G, I, K) Late fluorescein angiographic images. (B, D, F, H, J, L) Diagonal OCT B-scans. (A) Baseline late FA image showed significant leakage. Visual acuity (VA) was 20/80. (B) Corresponding baseline OCT image showed subretinal fluid (arrow) and a retinal pigment epithelial detachment (PED, arrowhead). (C) After 140 days and six ranibizumab injections, VA improved to 20/50, and the FA image showed a marked reduction in leakage. (D) Corresponding OCT B-scan showed resolution of the subretinal fluid with a residual low-lying PED (arrowhead). (E) After 3 months without an injection, VA decreased to 20/100, and the FA image showed a subtle increase in leakage. (F) Corresponding OCT B-scan showed recurrent cystic macular fluid. Ranibizumab was injected at this visit. (G) Three months after the ranibizumab injection, VA improved to 20/80, and the FA image showed a marked decrease in leakage. (H) Corresponding OCT B-scan showed only small intraretinal cysts, and no injection was given. (I) After 6 months without treatment, VA slowly decreased to 20/100 and the patient then complained of distortion. FA image showed increased leakage. (J) Corresponding B-scan showed increased macular fluid. (K) Over the next 12 months, the patient received two more ranibizumab injections, and the VA improved to 20/50. The FA image showed decreased leakage. (L) Corresponding OCT B-scan showed marked improvement in the macular fluid.
Figure 5
Figure 5
Macular neovascularization (MNV) with subretinal hyperreflective material/exudate (SHRM/SHRE). (A, C, E) Horizontal spectral-domain optical coherence tomography (SD-OCT) B-scans. (B, D, F) Vertical SD-OCT B-scans. (A, B) Patient with MNV secondary to age-related macular degeneration was seen in clinic and found to have macular fluid on SD-OCT imaging. Visual acuity (VA) was 20/30. The patient was asymptomatic. SRHM was evident on the horizontal B-scan (arrow). Patient was told to monitor her vision. (C, D) Two weeks later, the patient returned complaining of decreased vision. VA decreased to 20/50. SD-OCT imaging showed increased macular fluid and increased SHRM/SHRE (arrows). The first injection of a vascular endothelial growth factor (VEGF) inhibitor was given. (E, F) One month after the third of three monthly injections, VA improved to 20/30 with resolution of the macular fluid and SRHM/SHRE. A fourth anti-VEGF injection was given at this visit.
Figure 6
Figure 6
Macular atrophy developing after treatment with an inhibitor of vascular endothelial growth factor (VEGF). (A, D, G, F) Spectral-domain optical coherence tomography (SD-OCT) fundus images at sequential visits. (B, E, H, K) Horizontal SD-OCT B-scans. (C, F, I, L) Vertical SD-OCT B-scans. (A, B, C) One month after an anti-VEGF injection for a hemorrhagic fibrovascular retinal pigment epithelial detachment secondary to age-related macular degeneration. Visual acuity (VA) was 20/30. The OCT fundus image showed a small focus of atrophy as seen in (A) (arrow). The second anti-VEGF injection was given at this visit. (D, E, F) Two months after the second injection, VA was 20/25, but the area of atrophy was enlarging as shown in (D) (arrow) with evidence of hypertransmission shown on the horizontal (E) and vertical (F) B-scans. Disruption of the outer retinal layers can be appreciated in the areas with the hypertransmission defects. Another anti-VEGF injection was given. (G, H, I) A fourth injection was given 2 months after the third injection, and 2 months after the fourth injection, the patient returned with a VA of 20/25, but an even larger area of atrophy could be appreciated as shown in (G) (arrow) with evidence of even more hypertransmission as shown on the horizontal (H) and vertical (I) B-scans. The fifth anti-VEGF injection was given. (J, K, L) Three months after the fifth injection, the area of atrophy was slightly larger (J) (arrow) and prominent hypertransmission defects were appreciated as shown in (K) and (L). Disruption of the normal outer retinal structures was seen in the areas with the hypertransmission defect.

References

    1. Gass JDM. Stereoscopic Atlas of Macular Disease. Diagnosis and Treatment. 4th ed. St. Louis: Mosby-Year Book, Inc.; 1997: 130–147.
    1. Puliafito CA,, Schuman JS,, Hee MR,, Fujimoto JG. Optical Coherence Tomography of Ocular Diseases. 2nd ed. Thorofare, NJ: Slack Inc, 2004.
    1. Gabriele ML,, Wollstein G,, Ishikawa H,, et al. Optical coherence tomography: history, current status, and laboratory work. Invest Ophthalmol Vis Sci. 2011; 52: 2425–2436. - PMC - PubMed
    1. Staurenghi G,, Sadda S,, Chakravarthy U,, Spaide RF;, International Nomenclature for Optical Coherence Tomography Panel. Proposed lexicon for anatomic landmarks in normal posterior segment spectral-domain optical coherence tomography: the IN*OCT consensus. Ophthalmology. 2014; 121: 1572–1578. - PubMed
    1. Ting TD,, Oh M,, Cox TA,, Meyer CH,, Toth CA. Decreased visual acuity associated with cystoid macular edema in neovascular age-related macular degeneration. Arch Ophthalmol. 2002; 120: 731–737. - PubMed

Publication types

MeSH terms

Substances