. 2016 Jul 1;57(9):OCT277-87.
doi: 10.1167/iovs.15-18920.

Retinal Structure and Gene Therapy Outcome in Retinoschisin-Deficient Mice Assessed by Spectral-Domain Optical Coherence Tomography

Affiliations

Retinal Structure and Gene Therapy Outcome in Retinoschisin-Deficient Mice Assessed by Spectral-Domain Optical Coherence Tomography

Yong Zeng et al. Invest Ophthalmol Vis Sci. .

Abstract

Purpose: Spectral-domain optical coherence tomography (SD-OCT) was used to characterize the retinal phenotype, natural history, and treatment responses in a mouse model of X-linked retinoschisis (Rs1-KO) and to identify new structural markers of AAV8-mediated gene therapy outcome.

Methods: Optical coherence tomography scans were performed on wild-type and Rs1-KO mouse retinas between 1 and 12 months of age and on Rs1-KO mice after intravitreal injection of AAV8-scRS/IRBPhRS (AAV8-RS1). Cavities and photoreceptor outer nuclear layer (ONL) thickness were measured, and outer retina reflective band (ORRB) morphology was examined with age and after AAV8-RS1 treatment. Outer retina reflective band morphology was compared to immunohistochemical staining of the outer limiting membrane (OLM) and photoreceptor inner segment (IS) mitochondria and to electron microscopy (EM) images of IS.

Results: Retinal cavity size in Rs1-KO mice increased between 1 and 4 months and decreased thereafter, while ONL thickness declined steadily, comparable to previous histologic studies. Wild-type retina had four ORRBs. In Rs1-KO, ORRB1was fragmented from 1 month, but was normal after 8 months; ORRB2 and ORRB3 were merged at all ages. Outer retina reflective band morphology returned to normal after AAV-RS1 therapy, paralleling the recovery of the OLM and IS mitochondria as indicated by anti-β-catenin and anti-COX4 labeling, respectively, and EM.

Conclusions: Spectral-domain OCT is a sensitive, noninvasive tool to monitor subtle changes in retinal morphology, disease progression, and effects of therapies in mouse models. The ORRBs may be useful to assess the outcome of gene therapy in the treatment of X-linked retinoschisis patients.


Figures

Figure 1
Figure 1
Comparison of retinal structure in OCT images and H&E-stained plastic sections from WT and Rs1-KO mice. (A) The major retinal layers of WT visible by histology (right) are in good alignment with corresponding OCT bands (left). There are four outer retina reflective bands clearly visible in the OCT image of WT retina distal to the ONL, labeled 1, 2, 3, and 4. These bands align with structures in the photoreceptor and RPE layer, not all of which are visible in conventional H&E-stained sections (see text). (B) Optical coherence tomography image and plastic section from an age-matched (4-month-old) Rs1-KO mouse with multiple cavities (yellow circles) spanning the INL and OPL, making the margins between OPL and INL and between OPL and ONL uneven and less clear. The ONL is also decreased in thickness. In addition, the second and third outer retina bands in the OCT images are replaced by a single wider reflective band (red arrowhead; [B, left]). Scale bars: 50 μm.
Figure 2
Figure 2
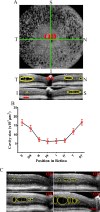
Uneven distribution of cavities and individual variation among Rs1-KO mouse retinas. (A) Representative OCT images from one animal: top image is the transverse view of a rectangular volume scan at the INL level; the dark areas are cavities; bottom images show two cross-sections centered on the optic nerve taken from the same retina with a radial volume scan, one in the temporal/nasal plane, and the other in the superior/inferior plane; these images show that there are larger and more frequent cavities (yellow circle) in the superior and temporal sides than in the inferior and nasal sides. (B) The spatial distribution of cavities in Rs1-KO mice at 4 months of age (±SD, n = 23/position). (C) Optical coherence tomography images from four Rs1-KO mice at the same age, showing wide individual variation in prevalence of cavities (yellow circles). I, inferior; IN, inferior nasal; IT, inferior temporal; N, nasal; OD, right eye; S, superior; SN, superior nasal; ST, superior temporal; T, temporal. Scale bars: 100 μm.
Figure 3
Figure 3
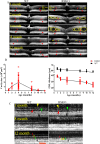
Natural history of retinal changes in the Rs1-KO mouse model. (A) Optical coherence tomography images collected from the WT and Rs1-KO mice at 1, 2, 4, 8, and 12 months of age. In Rs1-KO mice, very small cavities appear at 1 month of age (small circle); cavity formation is severe at 4 months (large circle), but they decrease markedly by 8 months and are almost gone at 12 months of age. Unlike WT, the innermost outer retina reflective band in Rs1-KO is indistinct and fragmented at 1 month of age, but returns to a normal appearance by 8 months (red arrows); the second outer retina reflective band merges with the third band during the entire course of the study (arrowheads). (B) Changes in the cavity size (left) and ONL thickness (right) in Rs1-KO mice. There is a substantial variation between animals at each age. (C) Changes in the OCT outer retina reflective bands over time in Rs1-KO mice compared to WT. Arrowheads point to the outer retina reflective bands numbered from innermost to outermost: yellow (1), red (2), green (3), black (4). The four bands are clearly separated, and the first band is a continuous well-defined line at all ages in WT retinas. In Rs1-KO mice, the first band is fragmented and less distinct than in WT at 1 month, but becomes more distinct and less fragmented by 8 months, and returns back to a well-defined line at 12 months; the second and third outer bands merge together forming a thicker band starting at 1 month, which remains during the entire experimental period (12 months). Scale bars: 100 μm (A); 50 μm (C).
Figure 4
Figure 4
Anatomic correlates of OCT outer retina reflective bands. (A) Optical coherence tomography scan, (B) cryosection with immunolabeling, and (C) plastic section with H&E staining from a WT mouse. Outer retina reflective bands in (A) are numbered as in Figure 3, and the peaks of the intensity plot profile superimposed on the figure created with ImageJ indicate the position of the maximum brightness of each of these four bands. (B) COX4 subunit I labeling, a marker for mitochondria, which accounts for 75% of the volume of the IS ellipsoid, in WT retina. The second outer retina reflective band of the OCT image aligns with the COX4 labeling of the IS mitochondria, indicating that this band corresponds to the ellipsoid portion of the IS. For comparison of the position of COX4 labeling and OCT bands to conventional histology, (C) shows an H&E-stained plastic section. Although some shrinkage occurs during tissue preparation for plastic embedding, the RPE, OS, IS, ONL, and OPL line up relatively well with the OCT image (A) and COX4 subunit I–labeled cryosection (B). (DG) Images of sections immunostained for β-catenin (D, F), or OCT scans (E, G) from WT mice at 1 or 8 months of age. Yellow arrows point to the OLM on both β-catenin–labeled and OCT images. The OLM in WT is a well-defined line at both ages. (HK) Images from Rs1-KO retinas: (H, J) β-catenin–labeled retinas and (I, K) OCT images from 1-month-old and 8-month-old mice. The β-catenin–labeled OLM at 1 month (H), evident in the OCT image as a fragmented first outer retina reflective band (I, yellow arrowheads point to the broken area), is broken up by photoreceptor cells intruding into the space between IS; at 8 months of age the β-catenin–labeled OLM returns back to a well-defined line (J) consistent with the first outer retina reflective band of the OCT image (K). IPL, inner plexiform layer; INL, inner nuclear layer; OPL, outer plexiform layer; ONL, outer nuclear layer; IS, inner segment; OS, outer segment; RPE, retinal pigment epithelium. Scale bar: 50 mm.
Figure 5
Figure 5
Evaluation of the treatment outcomes in Rs1-KO mice following AAV8-mediated RS1 gene transfer. (A) Optical coherence tomography images of Rs1-KO mouse retinas before (left) and after (right) AAV8-mediated gene replacement therapy. Treated retinas show much more organized retinal laminas: the margin of OPL and INL, OPL and ONL became more distinct (yellow circle on left displays untreated margin; yellow rectangular box shows treated margin), OLM becomes a defined line in treated retina (small red arrows); the second outer reflective band is separated from the third outer retina reflective band (red arrowheads). The number and size of cavities decrease, or cavities completely disappear. The OCT images of treated and untreated retinas were analyzed for cavity size (B) and ONL thickness (C). The size of cavities is reduced significantly (P < 0.0001), and the ONL thickness from treated retina is preserved (P < 0.0001) (C). Retinas were analyzed 4 months post unilateral intravitreal injection of AAV8-RS1 at 3 weeks of age. Average ± SEM is plotted. Scale bar: 100 μm.
Figure 6
Figure 6
Improvement in the second outer retina reflective band and change in IS mitochondria distribution following AAV-RS1 treatment. Strong RS expression is evident in both WT (A) and treated Rs1-KO retinas (C), but is absent in untreated Rs1-KO retinas (B). COX4 staining of mitochondria in WT (D) and treated Rs1-KO (F) mice shows that IS ellipsoids are packed tightly in parallel, but become highly disorganized in Rs1-KO mice (E). In OCT images from WT (G), untreated Rs1-KO (H), and treated Rs1-KO mice (I), a white arrowhead points to the second outer retina band, and a red arrowhead points to the third outer retina band. In the WT and treated Rs1-KO retinas, these two bands are distinctly separate (G, I, respectively) but merge together in untreated Rs1-KO retinas (H). In immunoelectron microscope images (JL), WT (J) and treated Rs1-KO mice (L) mitochondria (m) are adjacent to the internal plasma membrane, and absent from the central cytoplasm, but they fill the entire IS in the untreated Rs1-KO retina (K). The red arrows point to the plasma membrane of the IS, which is densely labeled in WT and treated Rs1-KO retinas with RS1 antibody but shows no RS1 labeling in untreated Rs1-KO retinas. Scale bars: 50 μm for the OCT images and light microscope images; 1 μm for EM images.

References

    1. Forsius H,, Vainio-Mattila B,, Eriksson A. X-linked hereditary retinoschisis. Br J Ophthalmol. 1962; 46: 678–681. - PMC - PubMed
    1. George ND,, Yates JR,, Moore AT. X linked retinoschisis. Br J Ophthalmol. 1995. ; 79: 697–702. - PMC - PubMed
    1. Mooy CM,, Van Den Born LI,, Baarsma S,, et al. Hereditary X-linked juvenile retinoschisis: a review of the role of Müller cells. Arch Ophthalmol. 2002; 120: 979–984. - PubMed
    1. Azzolini C,, Pierro L,, Codenotti M,, Brancato R. OCT images and surgery of juvenile macular retinoschisis. Eur J Ophthalmol. 1997; 7: 196–200. - PubMed
    1. Molday RS,, Kellner U,, Weber BH. X-linked juvenile retinoschisis: clinical diagnosis genetic analysis, and molecular mechanisms. Prog Retin Eye Res. 2012. ; 31: 195–212. - PMC - PubMed