

Technology and the Glaucoma Suspect
- PMID: 27409509
- PMCID: PMC5995486
- DOI: 10.1167/iovs.15-18931
Technology and the Glaucoma Suspect
Abstract
Purpose: To determine and compare the diagnostic performance of spectral-domain optical coherence tomography (SD-OCT), stereoscopic disc photographs, and automated perimetry as assessed by a group of glaucoma specialists in differentiating individuals with early glaucoma from suspects.
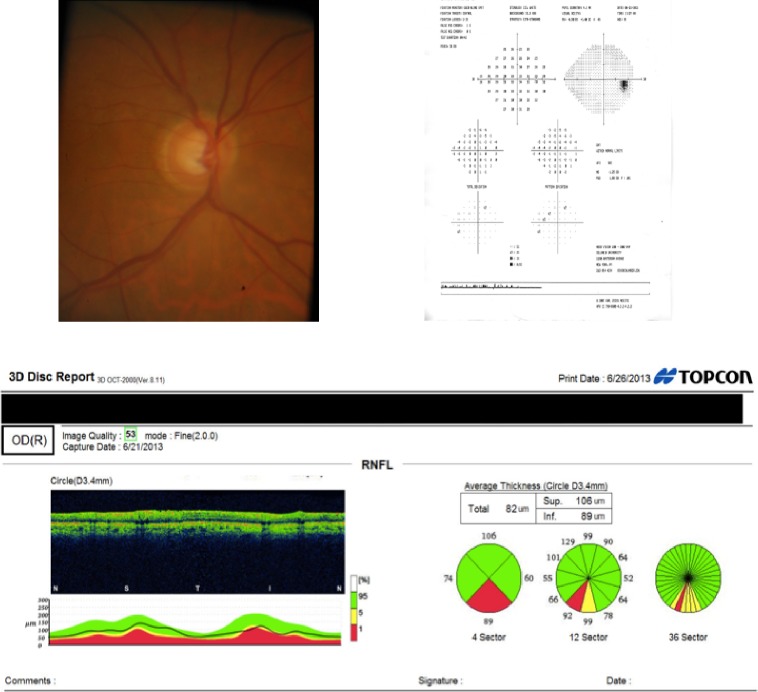
Methods: Forty-six eyes (46 patients) with suspicious optic nerves had previously undergone SD-OCT scans, 24-2 visual fields (VFs), and optic disc photographs. The average VF mean deviation was -1.97 ± 2.09 (SD) dB. Four glaucoma specialists examined the 138 individual diagnostic tests and classified the patient as likely glaucomatous or nonglaucomatous based on the results of a single test. The diagnostic performances of each of the three tests were compared to a previously determined reference standard, based on the consensus of a separate panel of four glaucoma specialists who examined all three tests together.
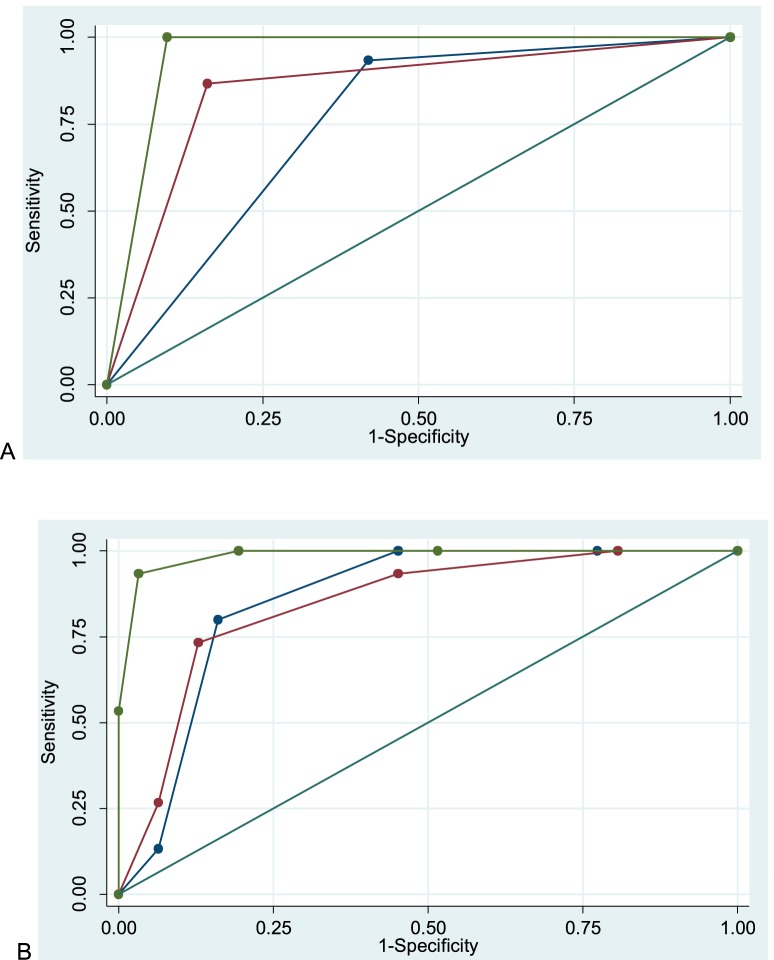
Results: Among the four specialists, the interobserver agreement across the three diagnostic tests was poor for VF and photos, with kappa (κ) values of 0.13 and 0.16, respectively, and moderate for OCT, with κ value of 0.40. Using panel consensus as reference standard, OCT had the highest discriminative ability, with an area under the curve (AUC) of 0.99 (95% 0.96-1.0) compared to photograph AUC 0.85 (95% 0.73-0.96) and VF AUC 0.86 (95% 0.76-0.96), suggestive of closer performance to that of a group of glaucoma specialists.
Conclusions: Compared to VF and disc photography, SD-OCT, when used alone, had better internal agreement as well as better agreement with the consensus of clinicians using all available data. Future studies should evaluate best practices for SD-OCT interpretation.
Figures
References
-
- American Academy of Ophthalmology Glaucoma Panel. Preferred Practice Pattern® Guidelines. Primary Open-Angle Glaucoma Suspect. 2010. Available at: www.aao.org/ppp. Accessed November 15, 2015.
-
- Whiting P, Rutjes AWS, Reitsma JB, Glas AS, Bossuyt PMM, Kleijnen J. . Sources of variation and bias in studies of diagnostic accuracy: a systematic review. Ann Intern Med. 2004; 140: 189– 202. - PubMed
-
- Landis JR, Koch GG. . The measurement of observer agreement for categorical data. Biometrics. 1977; 33: 159– 174. - PubMed
-
- DeLong ER, DeLong DM, Clarke-Pearson DL. . Comparing the areas under two or more correlated receiver operating characteristic curves: a nonparametric approach. Biometrics. 1988; 44: 837– 845. - PubMed
Publication types
MeSH terms
Grants and funding
LinkOut - more resources
Full Text Sources
Other Literature Sources
Medical
Miscellaneous
