. 2016 Jul 13;12(7):e1005760.
doi: 10.1371/journal.ppat.1005760. eCollection 2016 Jul.

A Quantitative Analysis of Complexity of Human Pathogen-Specific CD4 T Cell Responses in Healthy M. tuberculosis Infected South Africans

Affiliations

A Quantitative Analysis of Complexity of Human Pathogen-Specific CD4 T Cell Responses in Healthy M. tuberculosis Infected South Africans

Cecilia S Lindestam Arlehamn et al. PLoS Pathog. .

Abstract

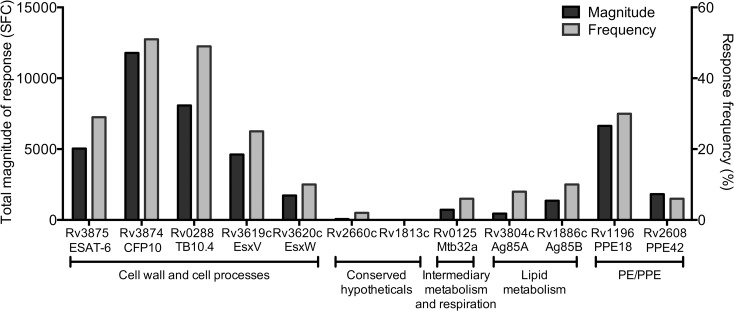
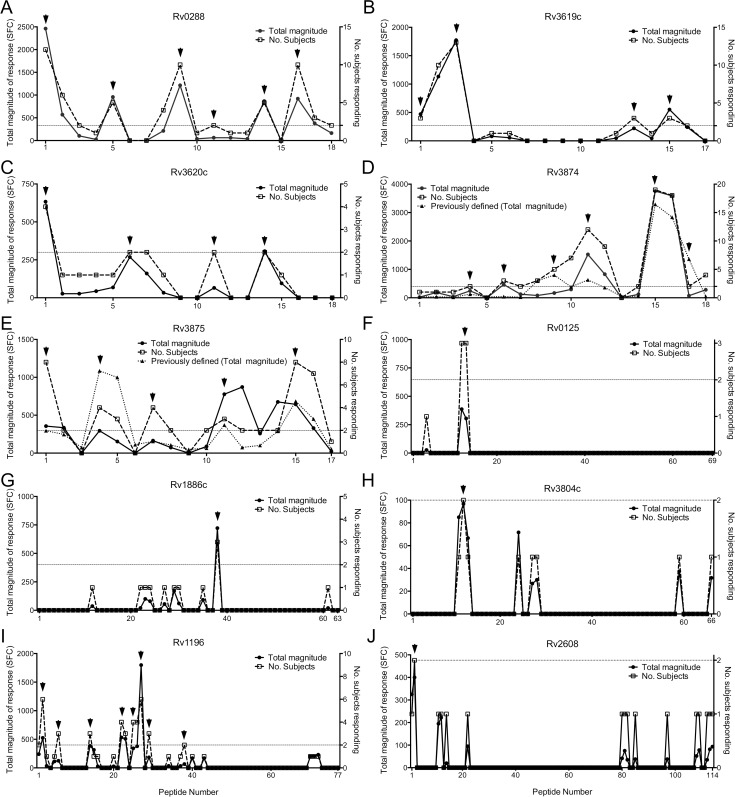
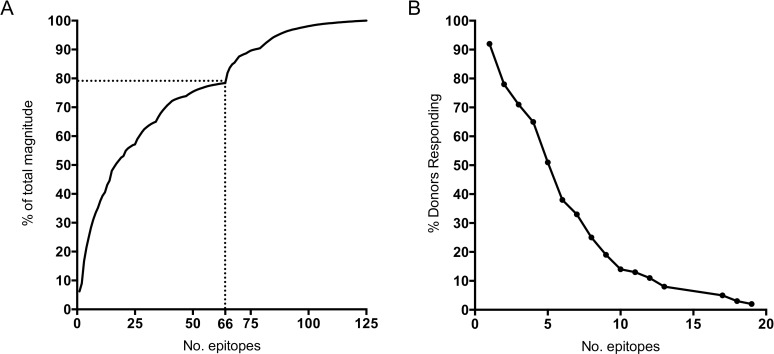
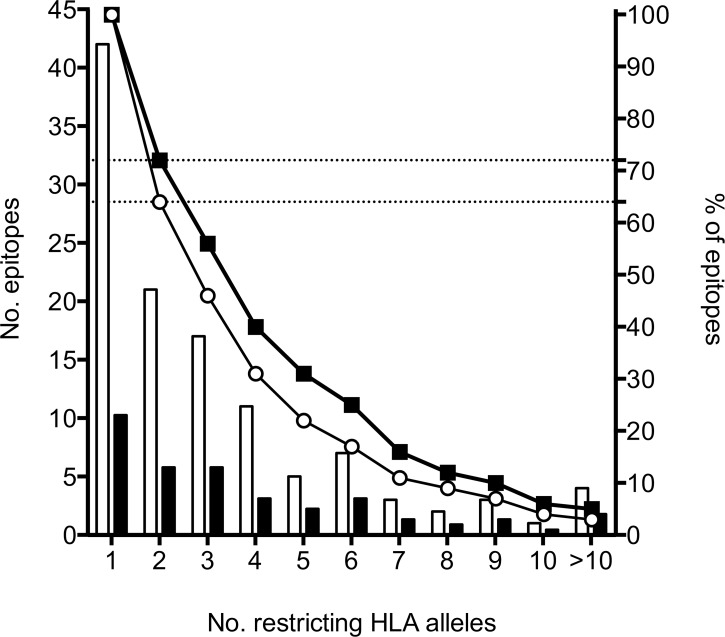
We performed a quantitative analysis of the HLA restriction, antigen and epitope specificity of human pathogen specific responses in healthy individuals infected with M. tuberculosis (Mtb), in a South African cohort as a test case. The results estimate the breadth of T cell responses for the first time in the context of an infection and human population setting. We determined the epitope repertoire of eleven representative Mtb antigens and a large panel of previously defined Mtb epitopes. We estimated that our analytic methods detected 50-75% of the total response in a cohort of 63 individuals. As expected, responses were highly heterogeneous, with responses to a total of 125 epitopes detected. The 66 top epitopes provided 80% coverage of the responses identified in our study. Using a panel of 48 HLA class II-transfected antigen-presenting cells, we determined HLA class II restrictions for 278 epitope/donor recognition events (36% of the total). The majority of epitopes were restricted by multiple HLA alleles, and 380 different epitope/HLA combinations comprised less than 30% of the estimated Mtb-specific response. Our results underline the complexity of human T cell responses at a population level. Efforts to capture and characterize this broad and highly HLA promiscuous Mtb-specific T cell epitope repertoire will require significant peptide multiplexing efforts. We show that a comprehensive "megapool" of Mtb peptides captured a large fraction of the Mtb-specific T cells and can be used to characterize this response.


Conflict of interest statement

The authors have declared that no competing interests exist.

Figures

Fig 1
Fig 1. Hierarchy in T cell reactivity against TB Vaccine and IGRA antigens.
Magnitude of responses, expressed as the total magnitude of response (black bars, left y-axis) or frequency of donors responding (grey bars, right y-axis), amongst the 63 donors. Rv number and synonyms for each antigen are indicated on the x-axis. Antigens were divided into protein categories as defined by Tuberculist [36]. All five antigens that are part of the cell wall and cell processes category are involved in the type VII secretion system [37].
Fig 2
Fig 2. Identification of antigenic regions within the TB Vaccine and IGRA antigens.
Magnitude of responses, expressed as the total magnitude of response (black dots, solid line, left y-axis) or number of responding donors (squares, dashed line, right y-axis) identified for Rv0288 (A), Rv3619c (B), Rv3620c (C), Rv3874 (D), Rv3875 (E), Rv0125 (F), Rv1886 (G), Rv3804c (H), Rv1196 (I), and Rv2608 (J). X-axes indicate peptide number of overlapping peptides spanning the entire protein. Dashed horizontal lines indicates 2 responding donors, and arrows indicate non-redundant antigenic regions. Cell wall and cell processes (A-E), Intermediary metabolism and respiration (F), Lipid metabolism (G, H) and PE/PPE antigens (I, J). Previously defined antigenic regions [35] (also expressed as total magnitude of response) are indicated by black triangles and dotted lines (left y-axis) for Rv3874 (D) and Rv3875 (E).
Fig 3
Fig 3. Breadth and dominance of T cell epitopes in Mtb antigens.
(A) All epitopes (n = 125) as a percentage of the total magnitude of response ranked on the basis of magnitude of T cell response and the 66 epitopes identified from TB vaccine and IGRA antigens and previously described epitopes. The dotted line indicates the 66 most immunodominant epitopes. (B) Proportion of the 63 donors who respond to the indicated number of epitopes of the top 66 identified epitopes.
Fig 4
Fig 4. Determination of HLA restriction of Mtb epitopes using HLA-transfected cell lines.
Representative examples showing determination of HLA restriction for two epitopes in three donors. (A-C) PBMCs were incubated with peptide-pulsed cell lines transfected with each individual HLA molecule that matched the HLA alleles of the PBMC donor. IFNγ release was measured by ELISPOT. Positive responses (black bars, p<0.05), negative responses (white bars). N/A indicates cell line not available for the HLA allele.
Fig 5
Fig 5. Promiscuity of HLA restrictions.
Number of epitopes identified (left y-axis) and the corresponding number of restricting HLA alleles per epitope (x-axis). Percentage of epitopes (right y-axis) restricted by ≥ indicated number of HLA alleles. All restrictions identified (open bars and circles). Restrictions in epitopes tested in ≥2 subjects (black bars and squares).
Fig 6
Fig 6. Characterization of CD4 T cell responses using epitope pools.
(A) Gating strategy for ICS assay. SSC-A; Side-scatter area, FSC-A; Forward-scatter area, SSC-W; Side-scatter width, FSC-W; Forward-scatter width, LD; Live/Dead discrimination. (B) Percentage cytokine detected from CD3+CD4+ T cells in response to the pool of 66, 125 and 300 epitopes, as well as heat killed H37Rv Mtb lysate. Each dot represents one donor (n = 34) median ± interquartile range is indicated. (C) Percentage Epitope pool-specific (125 epitopes) IFNγ, TNFα, IL-2 and IL-22 production by CD3+CD4+ T cells expressing each of the fifteen possible combinations. Each dot represents one donor (n = 34) median ± interquartile range is indicated. (D) The fraction of the total cytokine response against each stimuli expressing each combination of cytokines (pie chart) and all 4, 3, 2 or 1 cytokine (outer circle).
Fig 7
Fig 7. Epitope pool responses are highly polarized towards IFNγ production.
Frequencies of cytokine-expressing CD3+CD4+ memory T cells (A) or CD3+CD4+ naïve T cells (B) in response to the pool of 66, 125 and 300 epitopes. Each dot represents one donor, median ± interquartile range is indicated. (C) Gating strategy for memory versus naïve CD4 T cells. Plots are gated on total CD3+CD4+ T cells.
Fig 8
Fig 8. General applicability of peptide pools to detect responses in other cohorts.
(A) Magnitude of epitope pool (megapool) responses in a validation cohort of individuals with LTBI, and an IGRA-negative control cohort. Each dot represents one donor (n = 60, IGRA+, black dots and n = 17, IGRA-, open circles) median ± interquartile range is indicated. Two-tailed Mann-Whitney test, ns; no significant difference, **, p<0.01, ***, p<0.001. (B) Magnitude of megapool responses in individuals in the validation and negative control groups stratified by TST status. Each dot represents one donor (n = 46, TST+, black dots and n = 8, TST-, open circles) and median ± interquartile range is indicated. Two-tailed Mann-Whitney test, ns; no significant difference, ****, p<0.0001.

References

    1. Sallusto F, Geginat J, Lanzavecchia A (2004) Central Memory and Effector Memory T Cell Subsets: Function, Generation, and Maintenance. Annual Review of Immunology 22: 745–763. - PubMed
    1. Zhu J, Yamane H, Paul WE (2010) Differentiation of effector CD4 T cell populations (*). Annu Rev Immunol 28: 445–489. 10.1146/annurev-immunol-030409-101212 - DOI - PMC - PubMed
    1. Bendall SC, Simonds EF, Qiu P, Amir el AD, Krutzik PO, et al. (2011) Single-cell mass cytometry of differential immune and drug responses across a human hematopoietic continuum. Science 332: 687–696. 10.1126/science.1198704 - DOI - PMC - PubMed
    1. Newell Evan W, Sigal N, Bendall Sean C, Nolan Garry P, Davis Mark M (2012) Cytometry by Time-of-Flight Shows Combinatorial Cytokine Expression and Virus-Specific Cell Niches within a Continuum of CD8+ T Cell Phenotypes. Immunity 36: 142–152. 10.1016/j.immuni.2012.01.002 - DOI - PMC - PubMed
    1. Yao Y, Liu R, Shin MS, Trentalange M, Allore H, et al. (2014) CyTOF supports efficient detection of immune cell subsets from small samples. J Immunol Methods 415: 1–5. 10.1016/j.jim.2014.10.010 - DOI - PMC - PubMed

Publication types