. 2016 Aug 2;7(31):49859-49877.
doi: 10.18632/oncotarget.10489.

The miR-644a/CTBP1/p53 axis suppresses drug resistance by simultaneous inhibition of cell survival and epithelial-mesenchymal transition in breast cancer

Affiliations

The miR-644a/CTBP1/p53 axis suppresses drug resistance by simultaneous inhibition of cell survival and epithelial-mesenchymal transition in breast cancer

Umar Raza et al. Oncotarget. .

Abstract

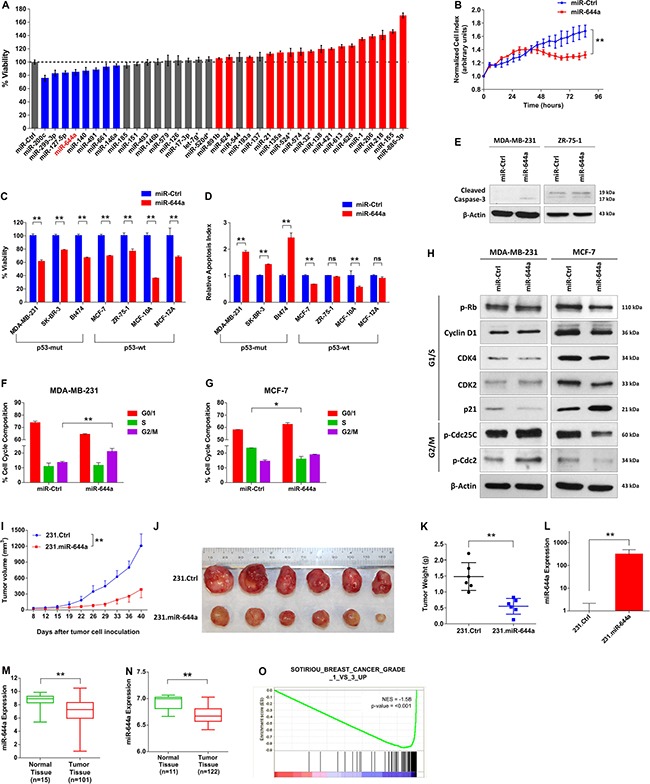
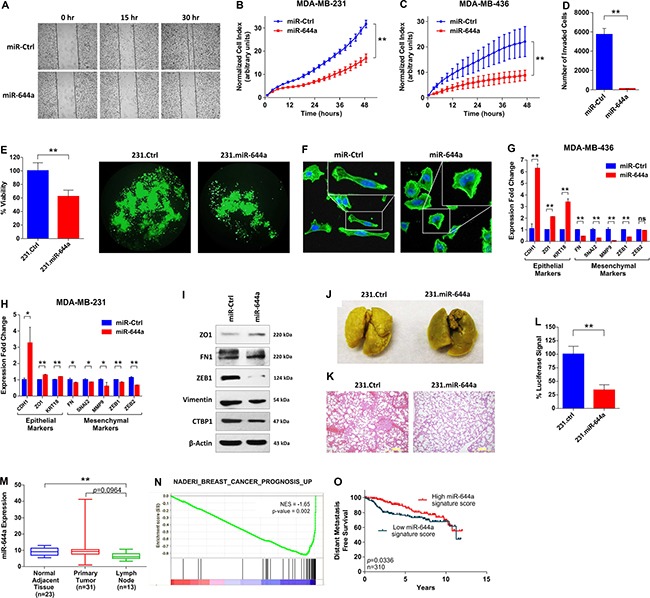
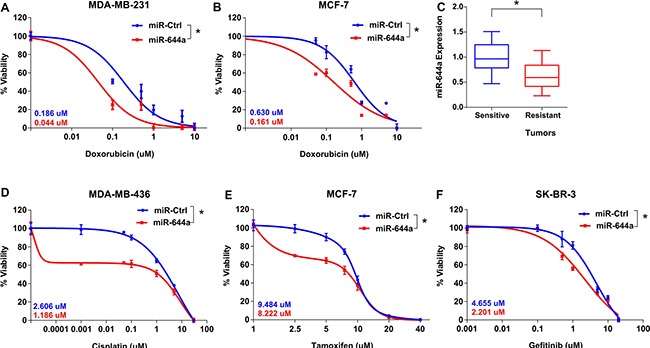
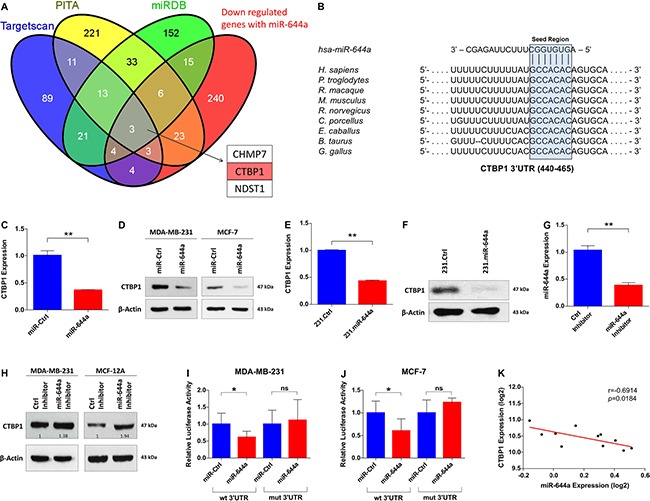
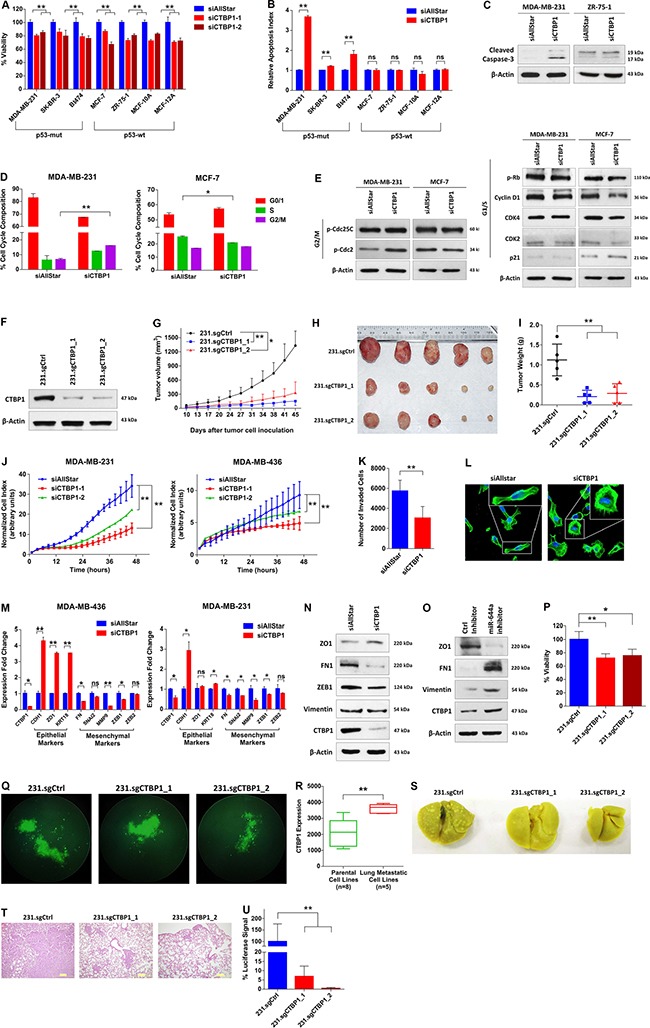
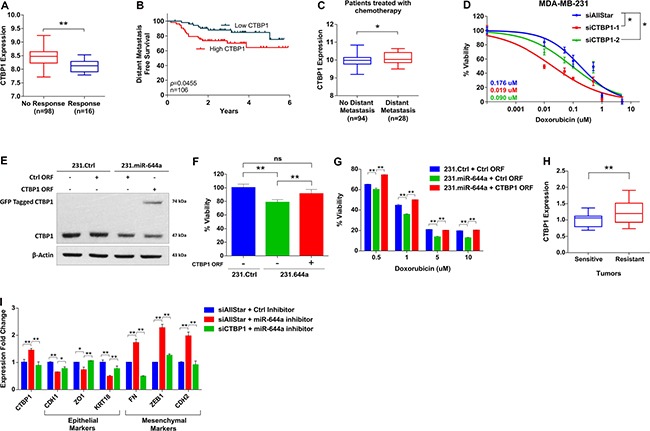
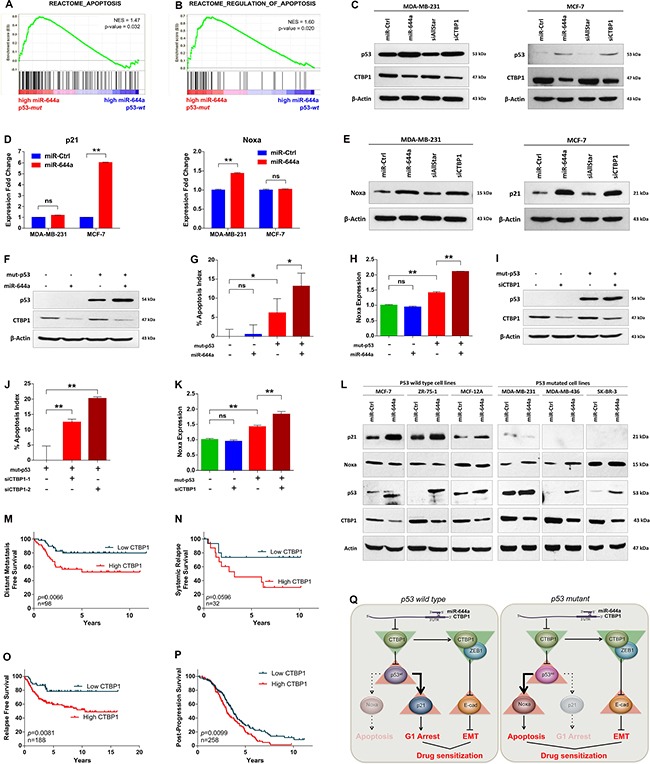
Tumor cells develop drug resistance which leads to recurrence and distant metastasis. MicroRNAs are key regulators of tumor pathogenesis; however, little is known whether they can sensitize cells and block metastasis simultaneously. Here, we report miR-644a as a novel inhibitor of both cell survival and EMT whereby acting as pleiotropic therapy-sensitizer in breast cancer. We showed that both miR-644a expression and its gene signature are associated with tumor progression and distant metastasis-free survival. Mechanistically, miR-644a directly targets the transcriptional co-repressor C-Terminal Binding Protein 1 (CTBP1) whose knock-outs by the CRISPR-Cas9 system inhibit tumor growth, metastasis, and drug resistance, mimicking the phenotypes induced by miR-644a. Furthermore, downregulation of CTBP1 by miR-644a upregulates wild type- or mutant-p53 which acts as a 'molecular switch' between G1-arrest and apoptosis by inducing cyclin-dependent kinase inhibitor 1 (p21, CDKN1A, CIP1) or pro-apoptotic phorbol-12-myristate-13-acetate-induced protein 1 (Noxa, PMAIP1), respectively. Interestingly, an increase in mutant-p53 by either overexpression of miR-644a or downregulation of CTBP1 was enough to shift this balance in favor of apoptosis through upregulation of Noxa. Notably, p53-mutant patients, but not p53-wild type ones, with high CTBP1 have a shorter survival suggesting that CTBP1 could be a potential prognostic factor for breast cancer patients with p53 mutations. Overall, re-activation of the miR-644a/CTBP1/p53 axis may represent a new strategy for overcoming both therapy resistance and metastasis.

Keywords: CTBP1; EMT; miRNAs; p53; therapy resistance.


Conflict of interest statement

The authors declare that they have no conflicts of interest.

Figures

Figure 1
Figure 1. miR-644a reduces the viability of breast cancer cells in vitro and in vivo and miR-644a expression or its gene signature is associated with tumor progression in breast cancer
(A) miRNA mimic cell viability screen on MDA-MB-231 human breast cancer cell line comprising of 35 different miRNAs, with miR-200c as a positive control. The cells were transfected with 20 nM of mimics for 48 hours, and viability was measured using Cell titer Glo. Color coding of the bars depicts the effect of each miRNA on cell viability (blue: decreasing viability, red: increasing viability, gray: no effect on viability). (B) Real time growth of MDA-MB-231 cells transiently transfected with either a control miRNA (miR-Ctrl) or miR-644a, monitored using an RTCA (real-time cell analyzer) assay. (C) Effect of miR-644a overexpression on proliferation of 5 breast cancer cell lines and 2 normal breast cell lines transfected with either miR-Ctrl or miR-644a. n = 4. (D) Changes in the apoptotic index based on Caspase-3 cleavage in cells from (C). n = 4. (E) Western Blot Analysis showing the levels of cleaved Caspase-3 in p53-mut MDA-MB-231 (left) and p53-wt ZR-75-1 cells (right) after 72 hours transfection with either miR-Ctrl or miR-644a. (F and G) Flow cytometric analysis of cell cycle in cells transfected with miR-Ctrl or miR-644a showing G2/M arrest in miR-644a transfected MDA-MB-231 cells (F) and G1 arrest in miR-644a transfected MCF-7 cells (G). (H) Western Blot Analysis showing the levels of cell cycle proteins related to G1/S (pRb, Cyclin D1, CDK4, CDK2 and p21) and G2/M transition (p-Cdc25C and p-Cdc2) in p53-mut MDA-MB-231 (left) and p53-wt MCF7 cells (right) after 48 hours transfection with either miR-Ctrl or miR-644a. (I) Tumor progression in xenografts generated by orthotropic subcutaneous injection of MDA-MB-231 cells stably expressing either a non-silencing control (231.Ctrl) or miR-644a (231.miR-644a) into nude mice. n = 6. (J) Representative images of tumors collected from xenografts of (I) on day 40. (K) Tumor weights in xenografts from (I) at day 40. (L) qRT-PCR analysis showing average miR-644a expression in 231.Ctrl and 231.miR-644a tumors collected from xenografts of (I) on day 40. n = 3. (M) miR-644a expression in 101 breast tumor tissues and 15 normal tissues from GSE45666 depicted as box-plot showing the median expression in all patients. (N) miR-644a expression in 122 breast tumor tissue and 11 normal tissue samples from GSE58606. (O) Enrichment plots of patients from GSE58644 (n = 320) with high or low miR-644a signature score. Genes up-regulated as breast tumors progress through histologic grade 3 were enriched in patients with low miR-644a signature score. Statistical significance was indicated (*p < 0.05; **p < 0.01; ns, not significant). Column data represent mean ± SD. Box-plots depict median number and the 25th to 75th quartiles. Upper and lower whiskers represent the minimum and maximum values in the corresponding group. This applies to all figures shown.
Figure 2
Figure 2. miR-644a inhibits metastasis, and its expression or gene signature is associated with metastasis of breast cancer patients
(A) Wound healing assay of MDA-MB-231 cells transfected with miR-Ctrl or miR-644a. Cells were scratched after 48 hours of transfection, and images were taken with 4× Magnification at 0, 15 and 30 hours after transfection. (B and C) Real-time migration of MDA-MB-231 (B) and MDA-MB-436 (C) cells transfected with either miR-Ctrl or miR-644a, monitored using an RTCA assay. (D) Number of invaded cells transfected with miR-Ctrl or miR-644a using Matrigel invasion assay. n = 3. (E) Viability of 231.Ctrl and 231.miR-644a cells grown in anchorage-independent conditions for 7 days, quantified by WST-1 assay (left) together with their fluorescence microscopy images with 10X magnification (right). (F) Fluorescence microscopy images of MD-MB-231 cells transfected with miR-Ctrl or miR-644a. Cell nuclei and filamentous actin were stained with 4,6-diamidino-2-phenylindole (DAPI) and Alexa Fluor 488 phalloidin, respectively. Images were taken after 72 hours of transfection with 20X magnification. Boxes at upper right corners of the images show cell morphology with higher resolution. (G and H) qRT-PCR analysis of epithelial and mesenchymal marker gene expression in MDA-MB-436 (G) and MDA-MB-231. (H) Cells transfected with miR-Ctrl or miR-644a. n = 3. (I) Western blot analysis of epithelial and mesenchymal marker expression in MDA-MB-231 cells transfected with miR-Ctrl or miR-644a. (J) Representative images of lungs collected from nude mice injected intravenously with 231.Ctrl or 231.miR-644a cells. Mice were sacrificed at week 7 and lungs were fixed in Bouin's Solution. (K) Hematoxylin and eosin staining of metastatic nodules in lungs from (J). (L) Luciferase signal coming from metastatic nodules in lungs of (J) as quantified by a luciferase assay. (M) miR-644a expression in 23 normal tissue, 31 primary tumor (IDC) and 13 lymph node metastasis tissues in GSE38167 depicted as box-plot. (N) Enrichment plot of patients from GSE58644 (n = 320) with high or low miR-644a signature score. Genes expressed higher in breast cancer patients with poor outcome as compared to those with good outcome were enriched in patients expressing low levels of miR-644a signature score. (O) Kaplan Meier survival curve representing the percentage distant metastasis-free survival in breast cancer patients based on miR-644a signature score median expression levels in GSE58644 (n = 310).
Figure 3
Figure 3. miR-644a overexpression acts as a therapy sensitizer in breast cancer cells and its expression correlates with doxorubicin resistance in vivo xenografts
(A and B) Effect of miR-644a overexpression on the response of MDA-MB-231 (A) and MCF-7 (B) cells to doxorubicin. (C) qRT-PCR analysis of miR-644a expression in xenografts sensitive or resistant to doxorubicin. Nude mice were subcutaneously injected with MDA-MB-231 cells and treated with doxorubicin. Among the treated mice, sensitive and resistant tumors were selected based on changes in tumor volumes upon successive drug treatments. n = 4. (DF) Effect of miR-644a overexpression on the response of MDA-MB-436 cells to cisplatin (D), response of MCF-7 cells to tamoxifen (E), and response of SKBR-3 cells to gefitinib (F). IC50 values for each condition are given on the left bottom corners of each curve with a color code.
Figure 4
Figure 4. CTBP1 is a direct target of miR-644a
(A) Venn diagram for the combinatorial target prediction analysis. List of genes downregulated by miR-644a in the microarray analysis was combined with genes predicted to be miR-644a targets by three different target prediction algorithms namely TargetScan (blue), PITA (yellow) and miRDB (green). Three genes that are common in all four groups were depicted, with CTBP1 highlighted in red. (B) Schematic diagram showing miR-644a binding site in CTBP1 3′-UTR (453–460) in different species including human. (C and D) Confirmation of CTBP1 downregulation by miR-644a overexpression at transcript and protein levels with qRT-PCR analysis in MDA-MB-231 (C) and with Western Blot analysis in MDA-MB-231 (left) and MCF-7 (right) (D) cells transfected with either miR-Ctrl or miR-644a. n = 3 for (C). (E and F) qRT-PCR (E) and Western Blot (F) analysis of CTBP1 expression in 231.Ctrl and 231.miR-644a cells confirming downregulation of CTBP1 in transcript and protein levels in cells stably expressing miR-644a. n = 3 for (E). (G) qRT-PCR analysis of miR-644a expression in MDA-MB-231 cells transfected with either a control Inhibitor (Ctrl Inhibitor) or miR-644a Inhibitor. n = 3. (H) Western Blot Analysis showing the levels of CTBP1 in MDA-MB-231 and MCF-12A cells transfected with either Ctrl Inhibitor or miR-644a Inhibitor. (I and J) Luciferase activity of a reporter construct fused with either a wt or mut CTBP1 3′-UTR in MDA-MB-231 (I) and MCF-7 (J) cells transfected with miR-Ctrl or miR-644a. n = 5. (K) Expression of miR-644a negatively correlates with CTBP1 expression in 9 breast cancer cell lines and 2 normal breast cell lines from GSE40059.
Figure 5
Figure 5. Loss of CTBP1 inhibits cell viability, tumor growth, migration and invasion in vitro, and inhibits tumor progression and metastasis in vivo
(A) Effect of CTBP1 knockdown on proliferation of cell lines previously used to test the effects of miR-644a overexpression on proliferation as in Figure 1C. Cells were transfected with either a non-targeting siRNA control (siAllStar) or different CTBP1 targeting siRNAs (siCTBP1–1, siCTBP1–2). n = 4. (B) Changes in the apoptotic index based on Caspase-3 cleavage in cells from (A) transfected with siAllStar or siCTBP1-Pool. n = 4. (C) Western Blot Analysis showing the levels of cleaved Caspase-3 in p53-mut MDA-MB-231 (left) and p53-wt MCF7 cells (right) after 72 hours transfection with siAllStar or siCTBP1-Pool. (D) Flow cytometric analysis of cell cycle in cells transfected with siAllStar or siCTBP1-Pool showing G2/M arrest in siCTBP1-Pool transfected MDA-MB-231 cells (left) and G1 arrest in siCTBP1-Pool transfected MCF-7 cells (right). (E) Western Blot analysis showing the levels of cell cycle proteins related to G2/M arrest (p-Cdc25C and p-Cdc2) (left) and G1/S (pRb, Cyclin D1, CDK4, CDK2 and p21) (right) transition in p53-mut MDA-MB-231 and p53-wt MCF7 cells after 48 hours transfection with siAllStar or siCTBP1-Pool. (F) Western Blot Analysis of CTBP1 levels in MDA-MB-231.luc cells stably expressing either a non-targeting sgRNA (231.sgCtrl) or different CTBP1 targeting sgRNAs (231.sgCTBP1_1, 231.sgCTBP1_2) confirming stable knock-out of CTBP1. (G) Tumor progression in xenografts generated by orthotopic subcutaneous injection of 231.sgCtrl, 231.sgCTBP1_1 or 231.sgCTBP1_2. n = 5. (H) Representative images of tumors collected from xenografts of (G) on day 45. (I) Tumor weights in xenografts from (G) at day 45. (J) Real time migration of MDA-MB-231 (left) and MDA-MB-436 (right) cells transfected with siAllStar, siCTBP1–1 or siCTBP1–2, monitored using an RTCA assay. (K) Number of invaded cells transfected with siAllStar or siCTBP1-Pool using Matrigel invasion assay. n = 3. (L) Fluorescence microscopy images of MDA-MB-231 cells transfected with either siAllStar or siCTBP1-Pool. Cell nuclei and filamentous actin were stained with DAPI and Alexa Fluor 488 phalloidin, respectively. Images were taken after 72 hours of transfection with 20× magnification. Boxes at the upper right corners of the images show cell morphology with higher resolution. (M) qRT-PCR analysis of epithelial and mesenchymal marker gene expression in MDA-MB-436 (left) and MDA-MB-231 (right) cells transfected with either siAllStar or siCTBP1-Pool. n = 3. (N) Western blot analysis of epithelial and mesenchymal marker expression in MDA-MB-231 cells transfected with either siAllStar or siCTBP1-Pool. (O) Western blot analysis of epithelial and mesenchymal marker expression in MCF-12A cells transfected with either Ctrl inhibitor or miR-644a inhibitor. (P and Q) Viability of 231.sgCtrl, 231.sgCTBP1_1 and 231.sgCTBP1_2 cells grown in anchorage-independent conditions for 7 days, quantified by WST-1 assay (P) together with their fluorescence microscopy images with 10× magnification (Q). (R) CTBP1 expression in parental MDA-MB-231 cells, its single-cell-derived progenies (SCPs) and in vivo isolated sub-lines with different lung metastatic capabilities from GSE2603 (n = 19). (S) Representative images of lungs collected from nude mice injected intravenously with 231.sgCtrl, 231.sgCTBP1_1 or 231.sgCTBP1_2. Mice were sacrificed at week 7 and lungs were fixed in Bouin's Solution. (T) Hematoxylin and eosin staining of metastatic nodules in lungs from (S). (U) Luciferase signal coming from metastatic nodules in lungs of (S) as quantified by a luciferase assay.
Figure 6
Figure 6. CTBP1 expression correlates with response to chemotherapy, and its loss sensitizes to chemotherapy and enhances epithelial-like state
(A) CTBP1 expression in anthracycline treated breast cancer patients from GSE16446 with no response to treatment (n = 98) or pathologic complete response (n = 16). (B) Kaplan Meier survival curve representing the percentage distant metastasis-free survival in breast cancer patients treated with anthracyclines based on CTBP1 median expression levels in GSE16446 dataset (n = 106). (C) CTBP1 expression in patients with no distant metastasis (n = 94) or with distant metastasis (n = 28) among breast cancer patients treated with chemotherapy from GSE58644. (D) Effect of CTBP1 knockdown on the response of MDA-MB-231 cells to doxorubicin. Cells were transfected with siAllStar, siCTBP1–1 or siCTBP1–2 and treated with increasing concentrations of doxorubicin. n = 4. (E and F) 231.Ctrl or 231.miR644a cells were transfected with Ctrl open reading frame (ORF) or CTBP1 ORF in mentioned combination to rescue the CTBP1 expression. Western Blot analysis showing rescue of CTBP1 expression in MDA-MB-231 (E). Effect of CTBP1 rescue on viability of MDA-MB-231 cells (F). (G) Bar graph showing the effect of CTBP1 rescue as shown in (F) on the response of MDA-MB-231 to 4 different doses of doxorubicin. n = 4. (H) qRT-PCR analysis of CTBP1 expression in xenografts sensitive or resistant to doxorubicin that were previously used to test the changes in miR-644a levels upon drug resistance (Figure 3C). n = 3. (I) qRT-PCR analysis of epithelial and mesenchymal marker gene expression in MCF-12A cells upon CTBP1 rescue by miR-644a inhibitor and further knockdown by siCTBP1.
Figure 7
Figure 7. miR-644a/CTBP1-mediated wild type or mutant p53 upregulation acts as a switch on G1-arrest or apoptosis, and CTBP1 expression predicts survival of patients with p53 mutation
(A and B) Enrichment plots of patients from GSE22220 with high miR-644a levels (n = 105). Among patients with high miR-644a, genes annotated to Apoptosis (A) and Regulation of Apoptosis (B) pathways in Reactome were significantly enriched in p53-mut group as compared to p53-wt group. (C) Western Blot analysis showing the regulation of p53 in MDA-MB-231 (left) and MCF-7 cells (right) upon miR-644a overexpression or CTBP1 knockdown. (D and E) qRT-PCR (D) and western blot (E) analysis of p21 and Noxa gene expression in MDA-MB-231 and MCF-7 cells upon miR-644a overexpression or CTBP1 knockdown. (FK) Changes in the apoptotic index based on Caspase-3 cleavage in p53-wt MCF-7 cells transfected with miR-644a (G) or siCTBP1–1, siCTBP1–2 (J) together with mut-p53 ORF. Regulation of Noxa expression upon miR-644a overexpression (H) or CTBP1 knockdown (K) in the presence of mut-p53 was shown with qRT-PCR analysis. Overexpression of mut-p53 in p53-wt MCF-7 cells was confirmed with Western Blot analysis (F and I). (L) Western blot analysis showing CTBP1, p53, Noxa and p21 expression upon miR-644a upregulation using mimics in 6 different breast cancer cell lines. (M and N) Kaplan Meier survival curves of breast cancer patients with p53 mutation based on CTBP1 median expression levels in datasets GSE58644 (n = 98) representing percentage distant metastasis-free survival (M) and in GSE19536 (n = 32) representing percentage systemic relapse-free survival (N). (O and P) Kaplan Meier survival curve of breast (O) and ovarian (P) cancer patients with p53 mutation based on ‘best cut-off’ for CTBP1 expression levels in KM Plotter (n = 188 for O, n = 258 for P) representing percentage relapse-free (O) and post-progression (P) survival. (Q) Schematic description of miR-644a/CTBP1/p53 axis-mediated drug resistance by simultaneous modulation of cell survival and EMT in p53-wt (left) and p53-mut (right) cells.

Similar articles

Cited by

References

    1. Siegel R, Naishadham D, Jemal A. Cancer statistics, 2013. CA Cancer J Clin. 2013;63:11–30. - PubMed
    1. Perou CM, Sorlie T, Eisen MB, van de Rijn M, Jeffrey SS, Rees CA, Pollack JR, Ross DT, Johnsen H, Akslen LA, Fluge O, Pergamenschikov A, Williams C, et al. Molecular portraits of human breast tumours. Nature. 2000;406:747–752. - PubMed
    1. Hanahan D, Weinberg RA. Hallmarks of cancer: the next generation. Cell. 2011;144:646–674. - PubMed
    1. Lujambio A, Lowe SW. The microcosmos of cancer. Nature. 2012;482:347–355. - PMC - PubMed
    1. Ambros V. microRNAs: tiny regulators with great potential. Cell. 2001;107:823–826. - PubMed

MeSH terms