. 2016 Jul 21;535(7612):440-443.
doi: 10.1038/nature18644. Epub 2016 Jul 13.

Glial-cell-derived neuroregulators control type 3 innate lymphoid cells and gut defence

Affiliations

Glial-cell-derived neuroregulators control type 3 innate lymphoid cells and gut defence

Sales Ibiza et al. Nature. .

Abstract

Group 3 innate lymphoid cells (ILC3) are major regulators of inflammation and infection at mucosal barriers. ILC3 development is thought to be programmed, but how ILC3 perceive, integrate and respond to local environmental signals remains unclear. Here we show that ILC3 in mice sense their environment and control gut defence as part of a glial–ILC3–epithelial cell unit orchestrated by neurotrophic factors. We found that enteric ILC3 express the neuroregulatory receptor RET. ILC3-autonomous Ret ablation led to decreased innate interleukin-22 (IL-22), impaired epithelial reactivity, dysbiosis and increased susceptibility to bowel inflammation and infection. Neurotrophic factors directly controlled innate Il22 downstream of the p38 MAPK/ERK-AKT cascade and STAT3 activation. Notably, ILC3 were adjacent to neurotrophic-factor-expressing glial cells that exhibited stellate-shaped projections into ILC3 aggregates. Glial cells sensed microenvironmental cues in a MYD88-dependent manner to control neurotrophic factors and innate IL-22. Accordingly, glial-intrinsic Myd88 deletion led to impaired production of ILC3-derived IL-22 and a pronounced propensity towards gut inflammation and infection. Our work sheds light on a novel multi-tissue defence unit, revealing that glial cells are central hubs of neuron and innate immune regulation by neurotrophic factor signals.


Conflict of interest statement

The authors declare no competing financial interests.

Figures

Extended Data Figure 1
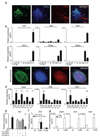
Extended Data Figure 1. ILC3 selectively express the neurotrophic factor receptor RET.
a, Expression of RET protein in gut CD45+Lin-Thy1.2hiIL7Rα+RORγt+ ILC3. b, Analysis of gut ILC3 from RetGFP mice. Embryonic day 14.5 (E14.5). c,d Analysis of enteric ILC3 subsets from RetGFP mice. e, Analysis of cytokine producing ILC3 from RetGFP mice. f, Pregnant RetGFP mice were provided with antibiotic cocktails that were maintained after birth until analysis at 6 weeks of age. Left: RET/GFP (white). Right: flow cytometry analysis of RET/GFP expression in ILC3. Thin line: Ab treated; Bold line: SPF. g, Ret expression in enteric ILC3 from Germ-Free (GF) mice and Specific Pathogen Free (SPF) controls. n=4. h, Analysis of lamina propria populations from RetGFP mice. i, Enteric ILC3 clusters. Green: RET/GFP; Blue: RORγt; Red: B220. Bottom: quantification analysis for RET/GFP and RORγt co-expression (79,97 ±4,72%). j, Rare RET expressing ILC3 in intestinal villi. Green: RET/GFP; Blue: RORγt; Red: CD3ε. Scale bars: 10µm. Data are representative of 4 independent experiments. Error bars show s.e.m. ns not significant.
Extended Data Figure 2
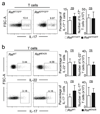
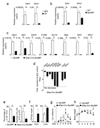
Extended Data Figure 2. T cell-derived IL-22 and IL-17 in RetGFP chimeras and RetMEN2B mice.
a, T cell derived IL-17 in RetGFP chimeras. RetWT/GFP n=25; RetGFP/GFP n=22. b, T cell derived IL-22 and IL17 in the intestine of RetMEN2B mice and their WT littermate controls. RetWT n=7; RetMEN2B n=7. Data are representative of 4 independent experiments. Error bars show s.e.m. ns not significant.
Extended Data Figure 3
Extended Data Figure 3. Enteric homeostasis in steady-state RetΔ mice.
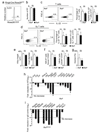
a, Rorgt-Cre mice were bread to Rosa26YFP. Analysis of Rosa26/YFP expression in gut ILC3 from Rorgt-Cre.Rosa26YFP mice. b, Number of Peyer’s patches (PP). Retfl n=10; RetΔ n=10. c, T cell derived IL-22 in RetΔ mice and their WT littermate controls. Retfl n=11; RetΔ n=11. d, γδ T cell derived IL-22 in RetΔ mice and their WT littermate controls. Retfl n=4; RetΔ n=4. e, Intestinal villus and crypt morphology. Retfl n=6; RetΔ n=6. f, Epithelial cell proliferation. Retfl n=5; RetΔ n=5. g, Intestinal paracellular permeability measured by Dextran-Fitc in the plasma. Retfl n=5; RetΔ n=5. h, Tissue repair genes in RetΔ intestinal epithelium in comparison to their WT littermate controls. n=8. i, Reactivity genes in RetMEN2B mice treated with anti-IL-22 blocking antibodies in comparison to RetMEN2B intestinal epithelium. RetMEN2B n=4; RetMEN2B + anti-IL-22 n=4. Data are representative of 3 independent experiments. Error bars show s.e.m. ns not significant.
Extended Data Figure 4
Extended Data Figure 4. Enteric inflammation in mice with altered RET signals.
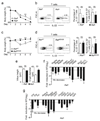
Mice were treated with DSS in the drinking water. a, Weight loss of DSS treated RetΔ mice and their littermate controls. Retfl n=8; RetΔ n=8. b, T cell derived IL-22 in RetΔ mice and their WT littermate controls after DSS treatment. Retfl n=8; RetΔ n=8. c, Weight loss of DSS treated RetMEN2B mice and their WT littermate controls. RetWT n=8; RetMEN2B n=8. d, T cell derived IL-22 in RetMEN2B mice and their WT littermate controls. RetWT n=8; RetMEN2B n=8. e, Intestinal villi and crypt morphology. Retfl n=6; RetΔ n=6. f, Epithelial reactivity gene expression in DSS treated RetΔ mice in comparison to their WT littermate controls. n=8. g, Tissue repair gene expression in DSS treated RetΔ mice in comparison to their WT littermate controls. n=4. Data are representative of 3-4 independent experiments. Error bars show s.e.m. ns not significant. Error bars show s.e.m. *P<0.05; **P<0.01; ns not significant.
Extended Data Figure 5
Extended Data Figure 5. Citrobacter rodentium infection in RetΔ mice.
a, C. rodentium translocation to the liver of Rag1-/-.RetΔ and their Rag1-/-.Retfl littermate controls at day 6 post-infection. n=15. b, MacConkey plates of liver cell suspensions from Rag1-/-.RetΔ and their Rag1-/-.Retfl littermate controls at day 6 after C. rodentium infection. c, Whole-body imaging of Rag1-/-.RetΔ and their Rag1-/-.Retfl littermate controls at day 6 after luciferase-expressing C. rodentium infection. d, Epithelial reactivity gene expression in C. rodentium infected Rag1-/-.RetΔ mice and their Rag1-/-.Retfl littermate controls. Rag1-/-.Retfl n=15; Rag1-/-.RetΔ n=17. e, Weight loss in C. rodentium infected Rag1-/-.RetΔ mice and their Rag1-/-.Retfl littermate controls. Rag1-/-.Retfl n=8; Rag1-/-.RetΔ n=8. f, Survival curves in C. rodentium infected Rag1-/-.RetΔ mice and their Rag1-/-.Retfl littermate controls. Rag1-/-.Retfl n=8; Rag1-/-.RetΔ n=8. g, C. rodentium translocation to the liver of RetΔ and their Retfl littermate controls at day 6 post-infection. n=6. h, MacConkey plates of liver cell suspensions from RetΔ and their Retfl littermate controls at day 6 after C. rodentium infection. i, Whole-body imaging of RetΔ and their Retfl littermate controls at day 6 after luciferase-expressing C. rodentium infection. j, C. rodentium infection burden. Retfl n=8; RetΔ n=8. k, Innate IL-22 in in C. rodentium infected RetΔ mice and their Retfl littermate controls. Retfl n=8; RetΔ n=8. Data are representative of 3-4 independent experiments. Error bars show s.e.m. ns not significant. Error bars show s.e.m. *P<0.05; **P<0.01; ns not significant.
Extended Data Figure 6
Extended Data Figure 6. Glial-derived neurotrophic factor family ligand (GFL) signals in ILC3.
a, Multi-tissue intestinal organoid system. Scale bar: 20µm. Black arrows: ILC3. b, Expression of ILC-related genes in ILC3 from RetΔ mice in comparison to their littermate controls. n=4. c, ILC3 activation with all GFL/GFRα pairs (GFL); single GDNF family ligand (GDNF, ARTN or NRTN); or single GFL/GFRα pairs (GDNF/GFRα1, ARTN/GFRα3 or NRTN/GFRα2) compared to vehicle BSA. n=5. d, ILC3 from RetΔ mice (open black) and their littermate controls (open dash). Isotype (closed grey). e, 30 minutes activation of ILC3 by GFL (open black) compared to vehicle BSA (open dash). Isotype (closed grey). f, 10 minutes activation of ILC3 by GFL. pERK n=8; pAKT n=8; phosphorylated p38/MAP kinase n=8; pSTAT3 n=8. Similar results were obtained in at least 3-4 independent experiments. Error bars show s.e.m. *P<0.05; **P<0.01; ns not significant.
Extended Data Figure 7
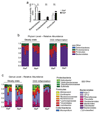
Extended Data Figure 7. Alterations in the diversity of intestinal commensal bacteria of RetΔ mice.
a, Quantitative PCR analysis at the Phylum level in stool bacterial from co-housed Retfl and RetΔ littermates in steady state. n=5. b, Metagenomic Phylum level comparisons in stool bacterial from co-housed Retfl and RetΔ littermates in steady state (left) and after DSS treatment (right). n=5. c, Genus level comparisons in stool bacterial from co-housed Retfl and RetΔ littermates in steady state (left) and after DSS treatment (right). n=5. Error bars show s.e.m. *P<0.05; **P<0.01; ns not significant.
Extended Data Figure 8
Extended Data Figure 8. GFL expressing glial cells anatomically co-localise with ILC3.
a, Intestine of RetGFP mice. Green: RET/GFP; Red: GFAP; Blue: RORγt. Similar results were obtained in three independent experiments. b, Purified lamina propria LTi, NCR- and NCR+ ILC3 subsets, T cells (T), B cells (B), Dendritic cells (Dc), Macrophages (Mø), enteric Neurons (N) and mucosal Glial cells (G). c, Neurosphere-derived glial cells. d, M: medium. Activation of neurosphere-derived glial cells with TLR2 (Pam3CSK4), TLR3 (Poli I:C), TLR4 (LPS) and TLR9 (DsDNA-EC) ligands, as well as IL-1β, IL-18 and IL-33. n=6. e, Il22 in co-cultures of glial and ILC3 using single or combined GFL antagonists. n=6. f, Il22 in co-cultures of ILC3 and glial cells from Il1b-/- or their WT controls. n=3. g, Gdnf, Artn and Nrtn expression in glial cells and ILC3 upon TLR2 stimulation. n=3. Scale bar: 30µm.Similar results were obtained in at least 4 independent experiments.
Extended Data Figure 9
Extended Data Figure 9. Glial cell sensing via MYD88 signals.
a-c, Intestinal glial cells were purified by flow cytometry. a, Germ-free (GF) and their respective Specific Pathogen Free (SPF) controls. n=3. b, Myd88-/- and their respective WT littermate controls. n=3. c, Gfap-Cre.Myd88Δ and their littermate controls (Myd88fl). n=3. d, Total lamina propria cells of Gfap-Cre.Myd88Δ and their littermate controls (Myd88fl). n=6. e-h, Citrobacter rodentium infection of Gfap-Cre.Myd88Δ mice and their littermate controls (Myd88fl). n=6. e, Innate IL-22. f, Citrobacter rodentium translocation. g, Infection burden. h, Weight loss. Data are representative of 3 independent experiments. Error bars show s.e.m. *P<0.05; **P<0.01; ns not significant.
Extended Data Figure 10
Extended Data Figure 10. A novel glial-ILC3-epithelial cell unit orchestrated by neurotrophic factors.
Lamina propria glial cells sense microenvironmental products, that control neurotrophic factor expression. Glial-derived neurotrophic factors operate in an ILC3-intrinsic manner by activating the tyrosine kinase RET, which directly regulates innate IL-22 downstream of a p38 MAPK/ERK-AKT cascade and STAT3 phosphorylation. GFL induced innate IL-22 acts on epithelial cells to induce reactivity gene expression (CBP: Commensal bacterial products; AMP: antimicrobial peptides; Muc: mucins). Thus, neurotrophic factors are the molecular link between glial cell sensing, innate IL-22 production and intestinal epithelial barrier defence.
Figure 1
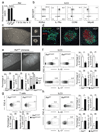
Figure 1. The neurotrophic factor receptor RET drives enteric ILC3-derived IL-22.
a, LTi, NCR- and NCR+ ILC3 subsets, T cells (T), B cells (B), Dendritic cells (Dc), Macrophages (Mø), enteric Neurons (N) and mucosal Glial cells (G). b, RetGFP ILC3. c, Left: RetGFP gut. White: GFP. Right: ILC3 aggregates. d, Cryptopatches (CP), immature (iILF) and mature (mILF) isolated lymphoid follicles. Green: RET/GFP; Blue: RORγt; Red: B220. e, RetGFP chimeras. n=15. f,g, RetGFP chimeras. RetWT/GFP n=25; RetGFP/GFP n=22. h, RetMEN2B mice. n=7. Scale bars: 1mm (c left, e); 50µm (c right); 30µm (d). Data are representative of 4 independent experiments. Error bars show s.e.m. *P<0.05; **P<0.01; ns not significant.
Figure 2
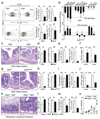
Figure 2. ILC3-intrinsic RET signals regulate gut defence.
a, ILC3-derived cytokines. n=11. b, RetΔ and RetMEN2B mice compared to their WT littermate controls. n=7. c-f, DSS treatment. Retfl n=8; RetΔ n=8. c, Histopathology. d, Inflammation score and colon length. e, Innate IL-22. f, Bacterial translocation. g-j, DSS treatment. RetWT n=8; RetMEN2B n=8. g, Histopathology. h, Inflammation score and colon length. i, Innate IL-22. j, Bacterial translocation. k-n, C. rodentium infection. Rag1-/-.Retfl n=15; Rag1-/-.RetΔ n=17. k, Histopathology. l, Inflammation score and colon length. m, Innate IL-22. n, Infection burden. Scale bars: 200µm. Data are representative of 4 independent experiments. Error bars show s.e.m. *P<0.05; **P<0.01; ns not significant.
Figure 3
Figure 3. ILC3-autonomous RET signals directly control Il22 downstream of pSTAT3.
a,b, Epithelial/ILC3 organoids. n=9. c, RetΔ ILC3 compared to their WT controls. n=4. d, ILC3 activation by GFL. n=4. e, RetΔ ILC3. pERK n=8; pAKT n=12; phosphorylated p38/MAP kinase n=6; pSTAT3 n=14. f, ILC3 activation by GFL. pERK n=10; pAKT n=16; phosphorylated p38/MAP kinase n=3; pSTAT3 n=15. g, pSTAT3 in ILC3 cultured with medium (n=7), GFL (n=11) or GFL and inhibitors for: p38 MAPK/ERK-AKT (LY) (n=7); ERK (PD) (n=7); AKT (VIII) (n=8); and p38 MAPK (SB) (n=6). h, Il22 in ILC3 cultured with GFL (n=17) or GFL and the inhibitors LY (n=18); PD (n=16); VIII (n=15); SB (n=15); and the STAT3 inhibitor (S3I) (n=8). i, Il22 locus. j. ChIP analysis of ILC3 stimulated with GFL. n=10. Data are representative of 3 independent experiments. Error bars show s.e.m. *P<0.05; **P<0.01; ns not significant.
Figure 4
Figure 4. Glial cells set GFL expression and innate IL-22, via MYD88-dependent sensing of the microenvironment.
a, Weighted Unifrac PCoA analysis and genus-level comparisons from co-housed Retfl (white circles) and RetΔ (black circles) littermates. n=5. Purple: Unclassified S24-7; Red: Bacteroides; Green: Sutterella; Blue: Unclassified Clostridiales; Grey: Other. b-d, DSS treatment of colonised germ-free (GF) mice. n=5. b, Histopathology. c, Inflammation score. d, Innate IL-22. e, Innate IL-22 after antibiotic treatment. n=8. f, RetGFP.Gfap-Cre.Rosa26RFP mice. Green: RET/GFP; Red: GFAP/RFP. g,h, Glial cell activation with TLR2, TLR4, IL-1β receptor and IL-33 receptor ligands. n=6. i, TLR ligands, IL-1β and IL-33 activation of co-cultured ILC3 with WT (white bars) or Myd88-/- glial cells (black bars). n=6. j-m, DSS treatment of Gfap-Cre.Myd88Δ mice. n=12. j, Histopathology. k, Inflammation score and colon length. l, Innate IL-22. m, Body weight. Scale bars: 200µm (b, j); 10µm (f). Data are representative of 3-4 independent experiments. Error bars show s.e.m. *P<0.05; **P<0.01; ns not significant.

Comment in

References

    1. Artis D, Spits H. The biology of innate lymphoid cells. Nature. 2015;517:293–301. - PubMed
    1. van de Pavert SA, et al. Maternal retinoids control type 3 innate lymphoid cells and set the offspring immunity. Nature. 2014;508:123–127. - PMC - PubMed
    1. Spencer SP, et al. Adaptation of innate lymphoid cells to a micronutrient deficiency promotes type 2 barrier immunity. Science. 2014;343:432–437. - PMC - PubMed
    1. Kiss EA, et al. Natural aryl hydrocarbon receptor ligands control organogenesis of intestinal lymphoid follicles. Science. 2011;334:1561–1565. - PubMed
    1. Lee JS, et al. AHR drives the development of gut ILC22 cells and postnatal lymphoid tissues via pathways dependent on and independent of Notch. Nat Immunol. 2011;13:144–151. - PMC - PubMed

Publication types

MeSH terms