Comparative Study
. 2016 Jul 21;535(7612):435-439.
doi: 10.1038/nature18927. Epub 2016 Jul 13.

Mobile genes in the human microbiome are structured from global to individual scales

Affiliations
Comparative Study

Mobile genes in the human microbiome are structured from global to individual scales

I L Brito et al. Nature. .

Erratum in

Abstract

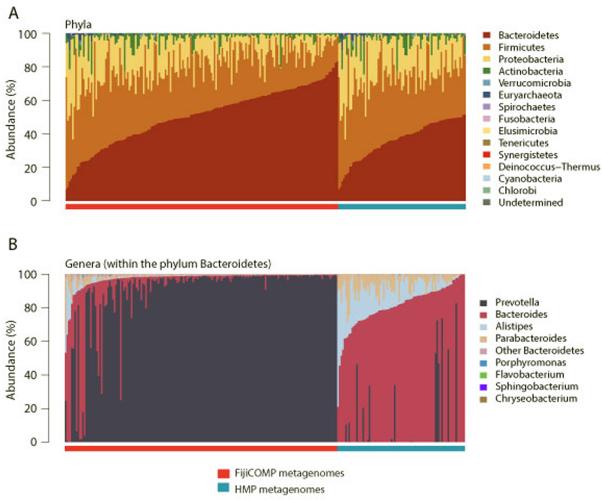
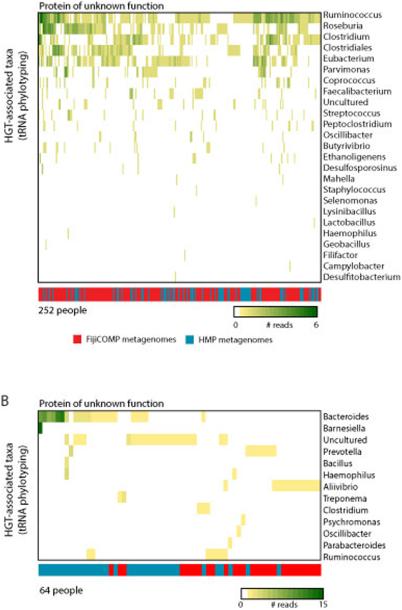
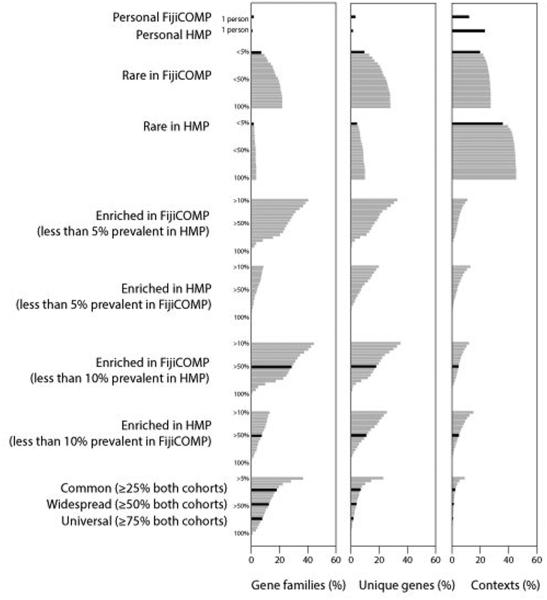
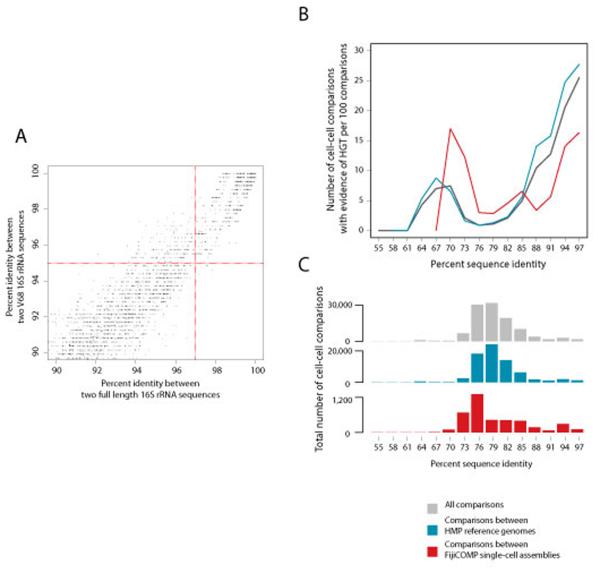
Recent work has underscored the importance of the microbiome in human health, and has largely attributed differences in phenotype to differences in the species present among individuals. However, mobile genes can confer profoundly different phenotypes on different strains of the same species. Little is known about the function and distribution of mobile genes in the human microbiome, and in particular whether the gene pool is globally homogenous or constrained by human population structure. Here, we investigate this question by comparing the mobile genes found in the microbiomes of 81 metropolitan North Americans with those of 172 agrarian Fiji islanders using a combination of single-cell genomics and metagenomics. We find large differences in mobile gene content between the Fijian and North American microbiomes, with functional variation that mirrors known dietary differences such as the excess of plant-based starch degradation genes found in Fijian individuals. Notably, we also observed differences between the mobile gene pools of neighbouring Fijian villages, even though microbiome composition across villages is similar. Finally, we observe high rates of recombination leading to individual-specific mobile elements, suggesting that the abundance of some genes may reflect environmental selection rather than dispersal limitation. Together, these data support the hypothesis that human activities and behaviours provide selective pressures that shape mobile gene pools, and that acquisition of mobile genes is important for colonizing specific human populations.


Figures

Extended Data Figure 1
Extended Data Figure 1. Phylogeny of assemblies utilized in the study span the bacterial Tree of Life
A phylogenetic tree constructed using a multiple sequence alignment of the full 16S rRNA gene or the V68 region of the 16S rRNA gene of all reference genomes and single-cell assemblies used in this analysis where available. 16S alignments were constructed using RDP. The tree was then assembled using FastTree. Support was low for all deep branches in the tree, therefore the archeal branch serves as the outgroup for illustrative purposes only. The outer color bar displays taxonomic associations for archea and bacterial phyla. The inner color bar displays the source of that operational taxonomic unit: HMP reference cells (blue) and FijiCOMP single cell assemblies (red). 16S rRNA gene sequences were not available for 70 FijiCOMP single-cell assembles, which are therefore not included in this tree.
Extended Data Figure 2
Extended Data Figure 2. Methodology for identifying horizontally transferred genes and assessing their distribution within the metagenomic samples
Horizontally transferred regions were first identified using pair-wise BLASTs between HMP reference genomes and FijiCOMP single cell assemblies. Open reading frames were annotated within the horizontally transferred regions. Genetic redundancy was removed in the mobile gene set to ensure accurate abundance estimates using a combination of UCLUST and BLAST. Metagenomic reads were then aligned to the dataset of unique mobile genes. Alignments were filtered to retain only reads that aligned with 99% identity across over 50% of their read length. Abundances of genes in the metagenomic samples were determined for genes whose alignments had a minimum of 4x alignment depth over 80% of the gene length.
Extended Data Figure 3
Extended Data Figure 3. The abundance of mobile gene families are largely determine by cohort
(A) A heatmap is plotted showing the abundances (FPKM) of mobile genes aggregated by functional gene family (COG assignment, KEGG, TIGRFAM or PFAM family) within each of the metagenomic samples. Hierarchical clustering using complete linkage was performed on the Euclidean distances between profiles of functional gene families across individuals; and on the distances between individuals’ mobile gene composition. Values are plotted on a logarithmic scale. (B) A heatmap is plotted showing the abundances (FPKM) of only those mobile gene families that were deemed of higher confidence within each of the metagenomic samples. These include mobile gene families from mobile genes that were annotated as horizontal transfer machinery or had additional support for their phylogenetic placement. The placements of gene families and individuals were maintained from Extended Data Figure 3A for comparative purposes. (C) A heatmap is plotted showing the abundances (FPKM) of only those mobile genes that were observed to be transferred between HMP reference genomes within each of the metagenomic samples. The placements of gene families and individuals were maintained from Extended Data Figure 3A for comparative purposes.
Extended Data Figure 4
Extended Data Figure 4. Distributions of glycoside hydrolase 13 genes and glycoside hydrolase families within mobile genes of higher confidence display population-specific enrichment
(A) Prevalence and abundance (measured by FPKM) of mobile genes annotated as members of the Glycoside Hydrolase 13 family in the FijiCOMP (red) and HMP (blue) metagenomic stool samples is plotted. (B) Prevalence and abundance of all glycoside hydrolase (GH) families within the higher confidence mobile gene subset present in the FijiCOMP (red) and HMP (blue) metagenomic stool samples is plotted. Only unique gene families from mobile genes that were annotated as horizontal transfer machinery or had additional support for their phylogenetic placement are included here. Abundances were measured by FPKM, aggregated according to GH family, and plotted as a function of the density across samples. For each GH family, the number of unique horizontally transferred genes observed is noted, as are the sources of their substrates.
Extended Data Figure 5
Extended Data Figure 5. Composition of the gut microbiomes of HMP and FijiCOMP study participants
(A) Relative abundances of bacteria according to phylum are plotted for metagenomic samples from individuals in the HMP (blue) and FijiCOMP (red) cohorts. Samples are sorted according to cohort and the abundance of the dominant phyla. (B) Relative abundances of families within the Order Bacteriodales are plotted for metagenomic samples from individuals in the HMP (blue) and FijiCOMP (red) cohorts. Samples are sorted according to cohort and the abundance of the top Bacteroidales member.
Extended Data Figure 6
Extended Data Figure 6. Mobile genes are observed in a wide variety of bacterial host backgrounds across the two cohorts
(A,B) A heatmap is plotted showing the number of read-pairs per person that aligned to both a tRNA gene and two specific horizontally transferred genes. Colors within the heatmap reflect the read abundance according to the species associated with the specific tRNA gene. The color bar represents from which meteganomic cohort the reads are from: FijiCOMP (red) and HMP (blue).
Extended Data Figure 7
Extended Data Figure 7. The relative abundances of genes and contexts across populations is not sensitive to precise definitions
Percentages of gene families, as determined by COG annotations (left panel), identical genes (middle panel) and gene contexts (right panel) across populations for a wide range of parameters. Bars are plotted in 5% increments. Bars shaded in black are the parameters that are plotted in Figure 4.
Extended Data Figure 8
Extended Data Figure 8. Horizontal transfer varies across cells at different phylogenetic distances
(A) Nucleotide identity cutoffs for full length 16S rRNA and the V68 16S rRNA region were compared to avoid comparisons between closely related cells. For each pair of HMP reference genomes, nucleotide identity for their full length 16S rRNA is plotted against that of their V68 regions. 97% identity of full-length 16S (corresponding to approximately 75 million years of evolution) was used as a cutoff, whereas 95% was used as a cutoff when only sequences in the V68 region were available. Only those genomes above 90% similar at both the full-length and V68 region are shown. (C) HGT frequency is plotted as a function of the phylogenetic divergence between species between all cell-cell comparisons (black), between HMP reference genomes only (blue) and between the FijiCOMP single cell assemblies (red). This plot includes only cells for which full-length 16S rRNA genes could be identified. The number of cell-cell comparisons contributing to each of the lines is plotted in (B).
Extended Data Figure 9
Extended Data Figure 9. Representative genes chosen for the final mobile gene dataset are highly similar to the genes that were filtered to reduce redundancy
For each overlapping horizontally transferred region observed in cell-cell BLASTn comparisons between the reference genomes and single-cell assemblies, genes were clustered to identify unique genes and reduce the redundancy of the gene set. This step is essential for accurate abundance measurements of these genes in the metagenomic datasets after read alignment. All open reading frames from each overlapping horizontally transferred region were grouped using UCLUST. The nucleotide identities of each of the filtered genes and it’s the gene chosen for read alignment (i.e. the centroid) is plotted.
Extended Data Figure 10
Extended Data Figure 10. Metagenomic reads align to mobile genes with high fidelity over their entire length
Metagenomic reads were required to align with 99% identity to a mobile gene over at least 50% of the read length. Despite the seemingly low 50% cutoff, almost all reads align with near-perfect nucleotide identity over the entire length of the gene.
Figure 1
Figure 1. Enrichment of functional mobile genes is locale-specific
(A) Prevalence and abundance of all of the annotated mobile glycoside hydrolase (GH) families present in the FijiCOMP (red) and HMP (blue) metagenomic stool samples. Abundances were measured by FPKM to each of the horizontally transferred genes, aggregated according to GH family, and plotted as a function of the density across samples. For each GH family, the number of unique horizontally transferred genes present across the two cohorts is plotted (in gray), as are the sources of their substrates. (B) Prevalence and abundance of plant matter (read alignments to rRNA from the Kingdom Viridiplantae) across the FijiCOMP (red) and HMP (blue) metagenomic stool samples. (C) Prevalence and abundance of annotated mobile antibiotic resistance genes across the FijiCOMP (red) and HMP (blue) metagenomic stool samples. (p-value is based on a Mann-Whitney test). (D) Prevalence and abundance of 8 village-specific mobile genes (of 31 total village-specific genes) across four Fijian villages. q-values (A,B,D) of prevalence comparisons are based on FDR-corrected Fisher’s exact tests; and q-values of abundance comparisons are based on FDR-corrected Mann-Whitney tests.
Figure 2
Figure 2. Microbiome composition across global and local populations
(A) Principal coordinates analysis of the Jenson-Shannon divergence between species compositions of the FijiCOMP (red) and HMP (blue) metagenomic samples. (B) Principal coordinates analysis of the Jenson-Shannon divergence between species compositions in the FijiCOMP metagenomic samples, according to their village membership.
Figure 3
Figure 3. Personal mobile genetic element architecture displays high variation due to recombination
(A-C) Examples showing comparisons of assembled mobile genetic elements between the microbiomes of individuals from different continents (A,B) or different villages (C). Gene linkages between mobile genes are colored according to the individual they are present in, with gray depicting linkages present in both individuals’ microbiomes. Genes are colored according to their broad COG category. (D) For each mobile gene end, the median and quartile proportions of neighbors (as determined by the proportion of metagenomic read pairs) is plotted according to whether the adjacent gene is in broad functional concordance (determined by COG category) and whether they are situated on the same DNA strand, denoting whether they are likely to comprise the same operon. (E) The average number of gene families connected to by mobile genes of each type of functional category, as determined by paired read linkage between mobile genes. Bars show standard error of the mean.
Figure 4
Figure 4. Genes are widespread across global populations, though specific mobile genetic element architecture is not
The percentages of gene families (determined by functional annotations) (left), identical genes (middle), and gene contexts, defined by unique linkages between genes (right) are plotted according to their prevalence across the FijiCOMP and HMP populations. Gene families, genes and gene contexts are referred to as “Personal” (present in a single individual), “Rare” (in <5% of one population and absent in the other); “Enriched” (in >50% of one population and <10% of the other); “Common” (in ≥25% of both populations); “Widespread” (in ≥50% of both populations); and “Universal” (in ≥75% of both populations). Color reflects association with one or both populations.

References

    1. Turnbaugh PJ, et al. An obesity-associated gut microbiome with increased capacity for energy harvest. Nature. 2006;444:1027–1031. - PubMed
    1. Giongo A, et al. Toward defining the autoimmune microbiome for type 1 diabetes. The ISME Journal. 2011;5:82–91. - PMC - PubMed
    1. Qin J, et al. A metagenome-wide association study of gut microbiota in type 2 diabetes. Nature. 2012;490:55–60. - PubMed
    1. Scher JU, et al. Expansion of intestinal Prevotella copri correlates with enhanced susceptibility to arthritis. eLife. 2013;2:e01202. - PMC - PubMed
    1. Kang DW, et al. Reduced Incidence of Prevotella and Other Fermenters in Intestinal Microflora of Autistic Children. PLOS One. 2013 10.1371/journal.pone.0068322. - PMC - PubMed

Publication types

Substances