. 2016 Jul 21;535(7612):448-52.
doi: 10.1038/nature18636. Epub 2016 Jul 13.

Allosteric nanobodies reveal the dynamic range and diverse mechanisms of G-protein-coupled receptor activation

Allosteric nanobodies reveal the dynamic range and diverse mechanisms of G-protein-coupled receptor activation

Dean P Staus et al. Nature. .

Abstract

G-protein-coupled receptors (GPCRs) modulate many physiological processes by transducing a variety of extracellular cues into intracellular responses. Ligand binding to an extracellular orthosteric pocket propagates conformational change to the receptor cytosolic region to promote binding and activation of downstream signalling effectors such as G proteins and β-arrestins. It is well known that different agonists can share the same binding pocket but evoke unique receptor conformations leading to a wide range of downstream responses (‘efficacy’). Furthermore, increasing biophysical evidence, primarily using the β2-adrenergic receptor (β2AR) as a model system, supports the existence of multiple active and inactive conformational states. However, how agonists with varying efficacy modulate these receptor states to initiate cellular responses is not well understood. Here we report stabilization of two distinct β2AR conformations using single domain camelid antibodies (nanobodies)—a previously described positive allosteric nanobody (Nb80) and a newly identified negative allosteric nanobody (Nb60). We show that Nb60 stabilizes a previously unappreciated low-affinity receptor state which corresponds to one of two inactive receptor conformations as delineated by X-ray crystallography and NMR spectroscopy. We find that the agonist isoprenaline has a 15,000-fold higher affinity for β2AR in the presence of Nb80 compared to the affinity of isoprenaline for β2AR in the presence of Nb60, highlighting the full allosteric range of a GPCR. Assessing the binding of 17 ligands of varying efficacy to the β2AR in the absence and presence of Nb60 or Nb80 reveals large ligand-specific effects that can only be explained using an allosteric model which assumes equilibrium amongst at least three receptor states. Agonists generally exert efficacy by stabilizing the active Nb80-stabilized receptor state (R80). In contrast, for a number of partial agonists, both stabilization of R80 and destabilization of the inactive, Nb60-bound state (R60) contribute to their ability to modulate receptor activation. These data demonstrate that ligands can initiate a wide range of cellular responses by differentially stabilizing multiple receptor states.


Figures

Extended Data Figure 1
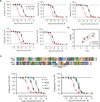
Extended Data Figure 1. Characterization of Nb60 interaction with β2AR
Competition equilibrium binding studies using [125I]-cyanopindolol (CYP), the cold competitor agonist isoproterenol (ISO), β2AR in HDL particles, and the indicated concentration of (a) Nb80, (b) Gs, or (c) Nb60. Dotted vertical line represents logIC50 in absence of modulator, and the change in ligand affinity is depicted with colored arrows. (d) 19F-NMR CPMG relaxation dispersion experiment with β2AR-Nb60-Carazolol (Cz). Kex – Exchange Rate. (e) Competition equilibrium binding studies using [125I]-CYP, the non-labeled competitor agonist ISO, β2AR in HDL-particles, and 1 µM Nb60 WT or T102A/F103A. (f) ELISA depicting capture of β2AR by Nb60 or the T102A/F103A variant. Inset: Coomassie stain of nanobody input. Radioligand binding and ELISA experiments were performed at least three times with deviation shown as standard error.
Extended Data Figure 2
Extended Data Figure 2. Characterization of β2AR-Nb60-carazolol crystals
(a) Monodispersity of T4L-β2AR-Nb60-carazolol (β2AR-Nb60-Cz) complex as assessed by size exclusion chromatography. Inset: Coomassie stain illustrating presence of β2AR and Nb60 in fractions combined for crystallography. (b) Representative picture of β2AR-Nb60-Cz lipidic cubic phase (LCP) crystals. (c) Insertion of F103 (green) from Nb60 CDR3 (purple) into hydrophobic β2AR pocket, nitrogen and oxygen shown as blue and red shaded surfaces, respectively. (d) Example of β2AR-Nb60-Cz crystal lattice. (e) Electron density 2FO-FC map (Sigma: 1) of carazolol binding pocket (top panels) Nb60 CDR3 binding pocket (bottom panels) within β2AR.
Extended Data Figure 3
Extended Data Figure 3. Differential effects of Nb60 and Nb80 on the affinity of 12 different β2AR ligands
Competition equilibrium binding studies using [125I]-cyanopindolol (CYP), the indicated non-labeled competitor, β2AR in HDL-particles, and 1 µM of Nb60 or Nb80. Data represent at least three independent experiments with deviation depicted as standard error.
Extended Data Figure 4
Extended Data Figure 4. Agonist induced G-protein activation in cellulo correlates with the magnitude of affinity change mediated by Nb80 in vitro
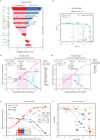
(a) Table representing cell signaling and ligand affinity data. Ligand-dependent G-protein activation was quantified by measuring cAMP levels (GloSensor, Promega) from HEK293 cells over-expressing β2AR. Ligand affinity was measured in membranes prepared from the same cells as above using competition binding assays with [125I]-CYP. Ligand efficacy (log Tau) was calculated as previously described. See methods and supplemental material for cooperativity (α) determination. Correlation plot of logTau and αNb80 (b) or αNb60 (c). All data represent at least three independent experiments with deviation shown as standard error.
Extended Data Figure 5
Extended Data Figure 5. Positive correlation between allosteric properties of Nb80 and Gs
(a) Equilibrium binding studies using HDL-β2AR, [125I]-cyanopindolol, the indicated unlabeled competitor, and 100 nM purified heterotrimeric Gs-protein. (b) Correlation plot of cooperativity values (α) for Nb80 and Gs. (c) Sequence alignment of Nb60 and NbA11. Radioligand competition binding studies with Nb80, Nb60 or NbA11, [125I]-cyanopindolol, the unlabeled competitor isoproterenol or clenbuterol, and HDL-β2AR. All data represent at least three independent experiments with deviation shown as standard error.
Extended Data Figure 6
Extended Data Figure 6. Affinity determination for Nb60 and Nb80 for unliganded β2AR
ELISA assay detecting capture of increasing concentrations of Nb60 or Nb80 by immobilized HDL-β2AR in the absence of ligand. All data represent at least three independent experiments with deviation shown as standard error.
Extended Data Figure 7
Extended Data Figure 7. Theoretical framework illustrating the two views of allostery
(a) Nested reaction schemes at equilibrium indicating the correspondence (arrowed light-blue shades) between binding site cooperativity (TCM in outer box) and changes of allosteric conformations (inner cubes). Arrows stand for reversible equilibrium interactions. (b) Change of the macroscopic dissociation constant (1/K) of a ligand L (shifting the equilibrium towards r1) induced by increasing the concentrations of nine different N-ligands with diverse allosteric effects (γ1, γ2) on receptor states. Simulations were made using a 3-state model based on the parameter values listed on the right side of the plot (curves on the left side are color coded in red/blue tones according to right-side boxes). The change in K (i.e. log difference between presence and absence of N) is calculated from eq. 1 in SI (Analysis of nanobody allostery).
Extended Data Figure 8
Extended Data Figure 8. Comparison of experimental and theoretical cooperativities predicted according to a 2-state (a–d) or 3-state (e, f) allosteric models
(See also SI, “Analysis of nanobody allostery.”) (a–d d) Theoretical log α values were computed according to a 2-state model for a series of hypothetical ligands (L) (log β1 range: −4/8) and a positive (PAN, log γ1 >>0) or negative (NAN, log γ1 << 0) nanobody. (a) Observed data overlaid on values simulated at J1 = 8.9 × 10⁻⁴ in histogram form (with experimental bars drawn on the closest theoretical log β1 bin value), or superimposed (b) on the log αNAN vs. log αPAN relationships predicted for different J1 values. The same data are replotted as separate graphs for lower J1 (c) and larger J1 (d) values, to show the sigmoid relationships existing between macroscopic log α’s and log β1. (e, f) Simulations made according to the 3-state allosteric model: (e) predicted (lines) and observed (circles) log α values plotted as functions of log (β12). Three groups of ligands (I to III, defined by the table of a0 and m parameters) produce increasingly stronger reductions of r2 equilibrium. (f) Same data plotted as log αNb60 vs. log αNb80 relationships (see fig. 4, main paper). All α values derived from at least three independent radioligand binding experiments with deviation depicted as standard error.
Figure 1
Figure 1. Allosteric nanobodies have opposing effects on agonist affinity for the β2AR
(a) Schematic of the ternary complex model (TCM). Ligand (L) affinity to receptor (R) increases in the presence of transducer (T), this allosteric linkage is denoted by dashed line with arrows. (b) Compared to the absence of modulator, Nb60 decreases ISO affinity (negative cooperativity) and Nb80/Gs increases affinity (positive cooperativity) as assessed by radioligand competition assays using β2AR HDL-particles. (c) The effects of Nb60 and Nb80/Gs on ISO affinity are saturable functions of their concentration. The affinity of Nb60 for unliganded β2AR (d), represented by a tight isotherm sigmoidal binding curve, is reduced in the presence of ISO (e) as determined by isothermal titration calorimetry. (f) Nb60 dose dependently increases and Nb80 decreases the binding of the radiolabeled antagonist [3H]-ICI-118,551 to the β2AR. All radioligand binding studies represent a minimum of three independent experiments with deviation shown as standard error.
Figure 2
Figure 2. Nb60 stabilizes the S2 inactive state by coordinating the β2AR ionic lock
Cartoon depicting a side (a) or cytoplasmic (b) view of the β2AR transmembranes (TM). Conversion from the two inactive states (S1 and S2) to the active S4 state requires both agonist and transducer (i.e. G-protein) binding and is represented by a 14Å outward movement of TM6. (c) 19F-NMR spectroscopy of the β2AR with the antagonist carazolol (Cz) +/− Nb60. (d) The 3.2Å structure of the β2AR bound to carazolol and Nb60 (β2AR-Cz-Nb60). (e) Coordination of β2AR ionic lock (R131 and E238) by Nb60 CDR3 residues T102 and Y106. For comparison, a disengaged and fully formed ionic lock are shown by the β2AR-Cz (PDB ID: 2RH1) and β1AR-Cz (PDB ID: 2YCZ), respectively. Hydrogen bonds shown as black dotted lines. (f) Overlay of β2AR-Cz and β2AR-Cz-Nb60 structures.
Figure 3
Figure 3. Nb60 and Nb80 have varying effects on the affinity of different β2AR ligands
(a) Schematic depicting the use of equilibrium radioligand binding studies to quantify the cooperativity (α) between Nb60 or Nb80 binding and ligand affinity (see methods and supplemental information). (b) Cooperativity values for Nb60 (αNb60) and Nb80 (αNb80) for β2AR ligands with varying efficacies. Ligands are ordered by magnitude of αNb80. (c) Correlation plot of αNb60 and αNb80; regression shown as solid red line with 95% confidence interval (dotted red line). All α values derived from at least three independent radioligand binding experiments with deviation depicted as standard error.
Figure 4
Figure 4. β2AR agonists differentially stabilize receptor states to regulate receptor activation
Illustration of a two- (a) or three-state (b) model of receptor activation describing the effect of β2AR ligands on receptor conformations stabilized by Nb60 (R60) or Nb80 (R80). The equilibrium (J) between receptor states can be influenced by ligand binding through the allosteric factor β. The theoretical cooperativity (α) between nanobody and ligand binding derived from the 2-state model (dashed black line) fails to predict the observed α values for a subset of ligands (dashed red oval). However, the observed cooperativity values can be accurately predicted using an allosteric model in which ligands can differentially modulate three independent receptor states (3-state). Certain ligands (orange) primarily stabilize the active R80 state, whereas others (purple, green) can stabilize R80 but simultaneously destabilize the inactive R60 state. All α values derived from at least three independent radioligand binding experiments with deviation depicted as standard error.

Similar articles

Cited by

References

    1. Kahsai AW, et al. Multiple ligand-specific conformations of the beta2-adrenergic receptor. Nat Chem Biol. 2011;7:692–700. - PMC - PubMed
    1. Liu JJ, Horst R, Katritch V, Stevens RC, Wuthrich K. Biased signaling pathways in beta2-adrenergic receptor characterized by 19F-NMR. Science. 2012;335:1106–1110. - PMC - PubMed
    1. Kofuku Y, et al. Efficacy of the beta(2)-adrenergic receptor is determined by conformational equilibrium in the transmembrane region. Nature communications. 2012;3:1045. - PMC - PubMed
    1. Nygaard R, et al. The dynamic process of beta(2)-adrenergic receptor activation. Cell. 2013;152:532–542. - PMC - PubMed
    1. Manglik A, et al. Structural Insights into the Dynamic Process of beta2-Adrenergic Receptor Signaling. Cell. 2015;161:1101–1111. - PMC - PubMed

References for Methods section

    1. Kobilka BK. Amino and carboxyl terminal modifications to facilitate the production and purification of a G protein-coupled receptor. Analytical biochemistry. 1995;231:269–271. - PubMed
    1. Whorton MR, et al. A monomeric G protein-coupled receptor isolated in a high-density lipoprotein particle efficiently activates its G protein. Proceedings of the National Academy of Sciences of the United States of America. 2007;104:7682–7687. - PMC - PubMed
    1. Rasmussen SG, et al. Crystal structure of the beta2 adrenergic receptor-Gs protein complex. Nature. 2011;477:549–555. - PMC - PubMed
    1. Ring AM, et al. Adrenaline-activated structure of beta2-adrenoceptor stabilized by an engineered nanobody. Nature. 2013;502:575–579. - PMC - PubMed
    1. Otwinowski ZMW. In: Methods in Enzymology. Carter Charlles W, editor. Vol. 276. Academic Press; 1997. pp. 307–326. - PubMed

Publication types

MeSH terms