Meta-Analysis
. 2016 Jul 21;535(7612):425-9.
doi: 10.1038/nature18626. Epub 2016 Jul 13.

Unexpected role of interferon-γ in regulating neuronal connectivity and social behaviour

Meta-Analysis

Unexpected role of interferon-γ in regulating neuronal connectivity and social behaviour

Anthony J Filiano et al. Nature. .

Abstract

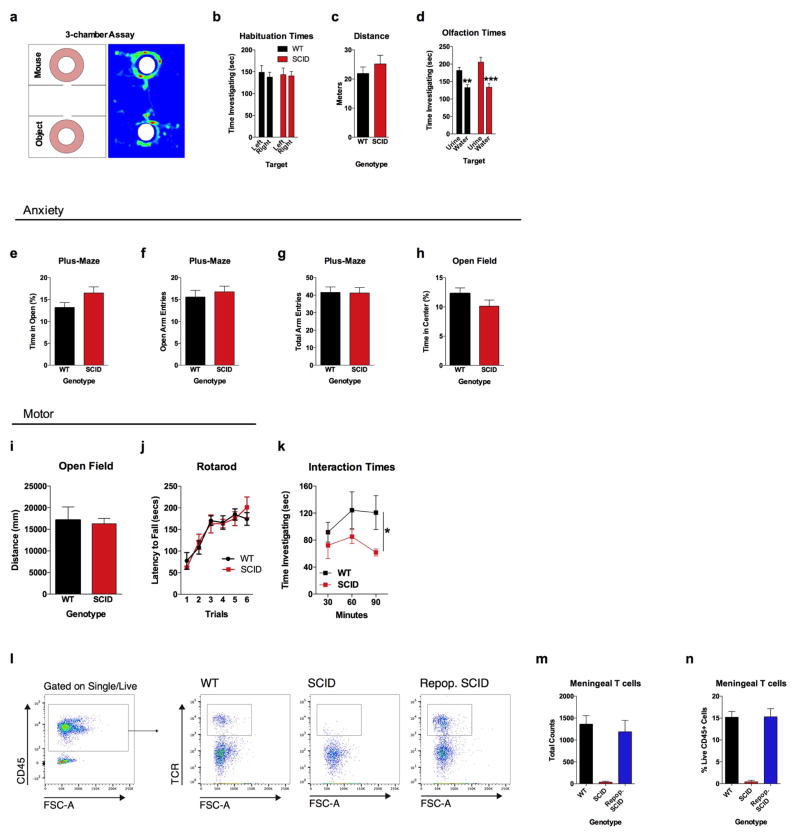
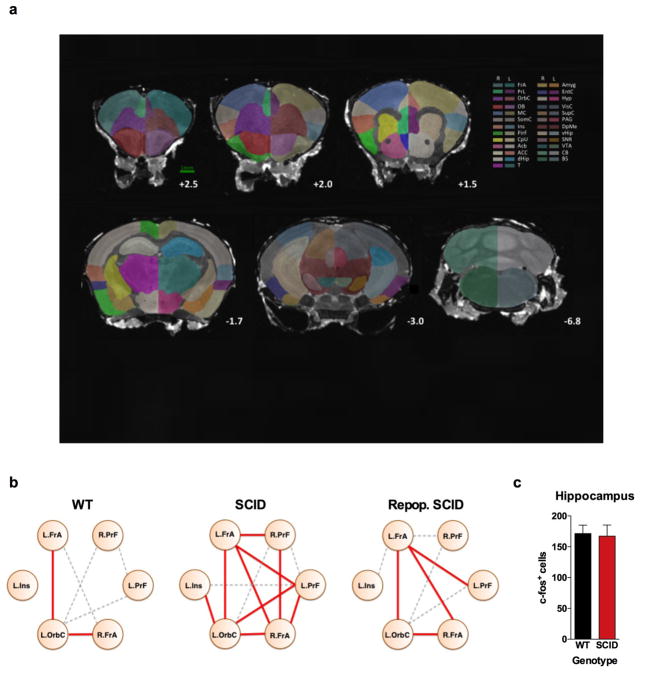
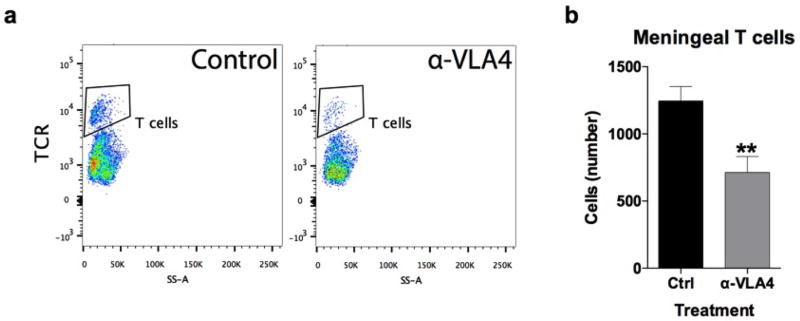
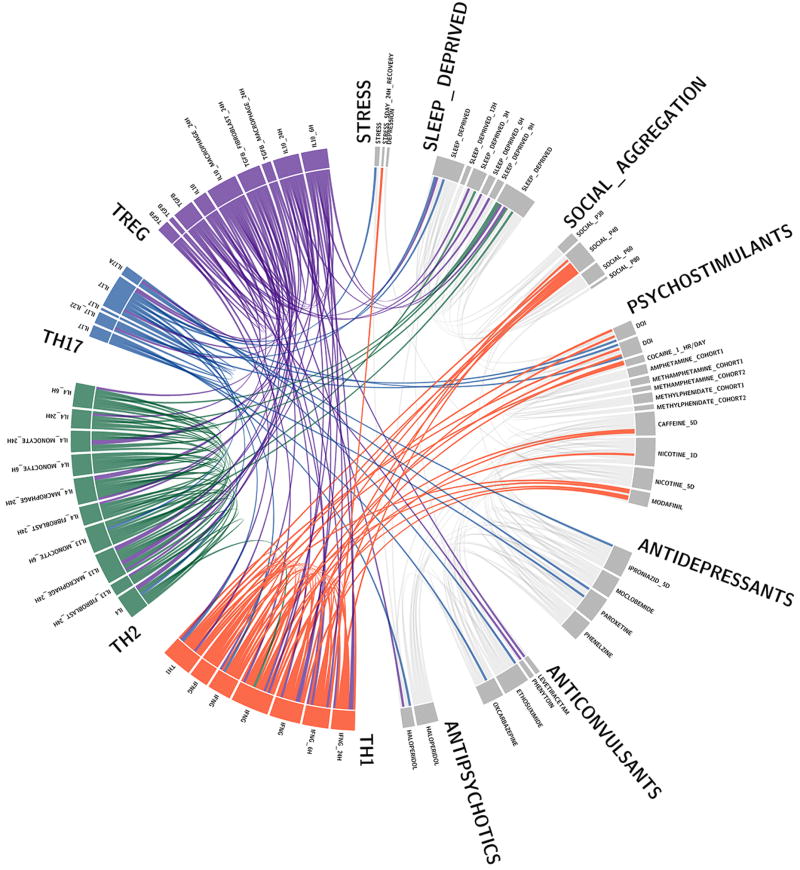
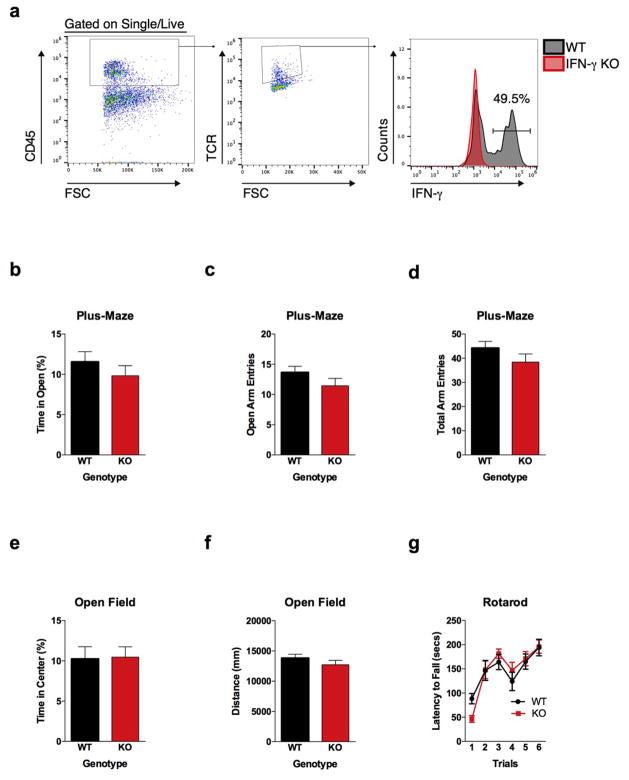
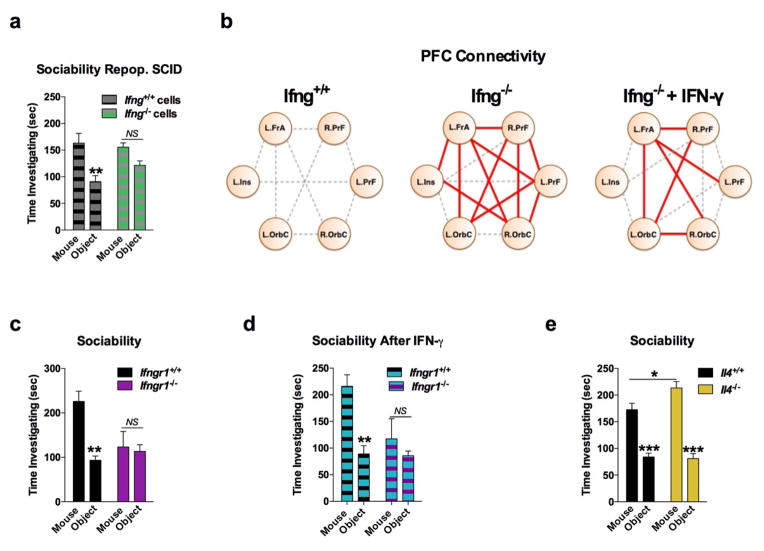
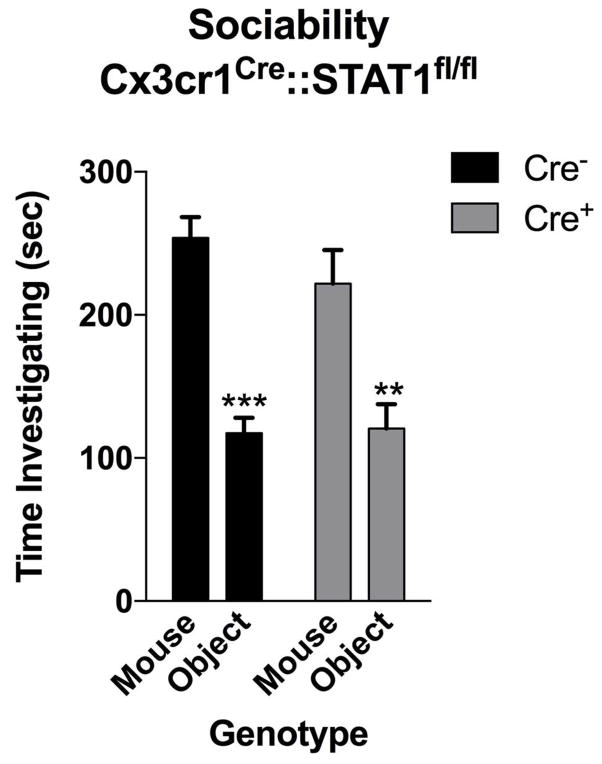
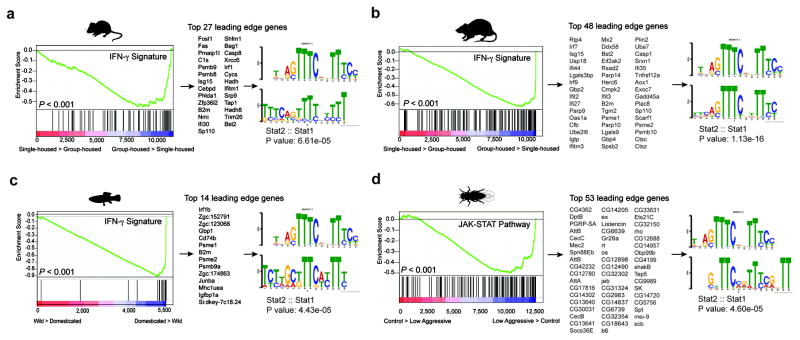
Immune dysfunction is commonly associated with several neurological and mental disorders. Although the mechanisms by which peripheral immunity may influence neuronal function are largely unknown, recent findings implicate meningeal immunity influencing behaviour, such as spatial learning and memory. Here we show that meningeal immunity is also critical for social behaviour; mice deficient in adaptive immunity exhibit social deficits and hyper-connectivity of fronto-cortical brain regions. Associations between rodent transcriptomes from brain and cellular transcriptomes in response to T-cell-derived cytokines suggest a strong interaction between social behaviour and interferon-γ (IFN-γ)-driven responses. Concordantly, we demonstrate that inhibitory neurons respond to IFN-γ and increase GABAergic (γ-aminobutyric-acid) currents in projection neurons, suggesting that IFN-γ is a molecular link between meningeal immunity and neural circuits recruited for social behaviour. Meta-analysis of the transcriptomes of a range of organisms reveals that rodents, fish, and flies elevate IFN-γ/JAK-STAT-dependent gene signatures in a social context, suggesting that the IFN-γ signalling pathway could mediate a co-evolutionary link between social/aggregation behaviour and an efficient anti-pathogen response. This study implicates adaptive immune dysfunction, in particular IFN-γ, in disorders characterized by social dysfunction and suggests a co-evolutionary link between social behaviour and an anti-pathogen immune response driven by IFN-γ signalling.


Conflict of interest statement

The authors do not have competing financial interests.

Figures

Extended Data Figure 1
Extended Data Figure 1. SCID mice have no observable anxiety, motor, or olfactory deficits
a, The 3-chamber sociability assay was used to test social behavior. b, Neither wild-type nor SCID mice had a side bias in the habituation phase (empty cups) of the 3-chamber assay (n = 6). c, There was no effect of genotype on distance traveled in the 3-chamber assay during the habituation phase (n = 6). d, Both wild-type and SCID mice had an olfactory preference to urine, suggesting normal olfactory behavior (n = 8 mice per group; ANOVA for urine preference F (1, 28) = 31.01; P < 0.0001; *** P < 0.001, ** P < 0.01 Sidak’s post-hoc). e, Percent time spent in the open arms of plus-maze (n = 22 mice per group). f, Number of entries into the open arms of the plus-maze (n = 22 mice per group). g, Total arm entries of plus-maze (n = 22 mice per group). h, Percent time spent in the center of the open field (n = 22 mice per group). i, Total ambulatory distance in the open field (n = 22 mice per group). j, Latency to fall off the accelerating rotarod (n = 8 mice per group). k, SCID mice spent less time investigating each other than wild-type mice spent investigating each other when placed into a novel social environment (n = 5 mice per group; repeated-measures ANOVA for genotype F (1, 21) = 5.708 * P < 0.05). l, Repopulated SCID mice have similar numbers (m) and percentage (n) of meningeal T cells as wild-type mice (n = 4–5 mice per group). Cells were gated on singlets, live, CD45+, and TCR.
Extended Data Figure 2
Extended Data Figure 2. Neuroanatomical Structures analyzed by rsfMRI
a, Regions of interests (ROIs) were generated using “The Mouse Brain” by Paxinos and Franklin as a reference. Abbreviations are as follows: FrA=frontal association cortex; PrL=prelimbic cortex; OrbC=orbital cortex; OB=olfactory bulb; MC=motor cortex; SocC=somatosensory cortex; Ins=insula; PirF=piriform cortex; CpU= caudate putamen; Acb=accumbens; ACC=anterior cingulate cortex; dHip=dorsal hippocampus; T=thalamus; Amyg=amygdala; EntC=entorhinal cortex; Hyp=hypothalamus; VisC=visual cortex; SupC=superior colliculus; PAG=periductal grey; DpMe=deep mesencephalic nucleus; vHip=ventral hippocampus; SNR=substantia nigra; VTA=ventral tegmental area; CB=cerebellum; BS=brain stem. b, Connectivity of local PFC/Insular nodes. Correlation thresholds were applied to visualize the strength of the connection. Connections that pass a high threshold are shown in red; connections that pass a lower threshold are shown in dashed grey. SCID mice have aberrant hyper-connectivity in the PFC (n = 8–9 mice per group; P < 0.05 Jennrich test). c, c-fos+ cells in the hippocampus (n = 9–10 mice per group).
Extended Data Figure 3
Extended Data Figure 3. Acute reduction of meningeal T cells with anti-VLA4
a, Anti-VLA4 depletes meningeal T cells. Meninges were dissected and single cell suspensions were immune-stained. T cells were gated on live, single, CD45+, TCR+ events and counted by flow cytometry. b, Acute injection of anti-VLA4 reduced the amount of TCR+ T cells in the meninges (n = 4 mice per group; * P < 0.01).
Extended Data Figure 4
Extended Data Figure 4. Circos plot showing the connectivity of Th1 response and social aggregation
Here labels are shown for the datasets analyzed and presented in Fig. 1h.
Extended Data Figure 5
Extended Data Figure 5. T cells in the meninges produce IFN-γ and IFN-γ deficient mice have normal levels of anxiety and motor behavior
a, A substantial percentage of meningeal T cells produce IFN-γ. Cells were gated for live, singlets, CD45+, and TCR+. Ifng−/−mice were used to gate for IFN-γ staining. b, Percent time spent is open arms of the plus-maze (n = 20 mice per group). c, Entries into the open arms of plus-maze (n = 20 mice per group). d, Total entries into all arms of the plus-maze (n = 20 mice per group). e, Percent time spent in the center of the open field (n = 20 mice per group). f, Total ambulatory distance in the open field (n = 20 mice per group). g, Latency to fall off the accelerating rotarod (n = 8 mice per group).
Extended Data Figure 6
Extended Data Figure 6. IFN-γ signaling is necessary for normal social behavior
a, Repopulating SCID mice with wild-type lymphocytes rescued a social preference; repopulating with Ifng−/−lymphocytes did not rescue a social preference; AVONA for Social behavior F (1, 14) = 11.99; P = 0.0038 (** P < 0.01; n = 8 mice per group). b, Connectivity of local PFC/Insular nodes. Correlation thresholds were applied to visualize the strength of the connection. Connections that pass a high threshold are shown in red; connections that pass a lower threshold are shown in dashed grey. Ifng−/−mice have more connections than wild-type mice (Jennerich test; P = 0.0006). These connections were reduced by IFN-γ (Jennerich test; P = 0.02). c, Ifngr1−/−mice have social deficits (n = 6 mice per group; ANOVA for interaction P = 0.01; ** P < 0.01 Sidak’s post-hoc) that were not rescued by injecting IFN-γ into the CSF (d; n = 5–6 mice per group; ANOVA for interaction P = 0.01; ** P < 0.01 Sidak’s post-hoc). e, Il4−/− mice spend more time than wild-type mice investigating a novel mice; ANOVA for genotype F (1, 32) = 5.397; P = 0.0267 (* P < 0.05 Sidak’s post-hoc; n = 16–18 mice per group).
Extended Data Figure 7
Extended Data Figure 7. Gating strategy for neurons and microglia
Brain homogenates were stained and analyzed by flow cytometry. Cells were gated on nucleated, singlets, and live. Neurons were then gated on NeuN positive and microglia on CD11B positive cells.
Extended Data Figure 8
Extended Data Figure 8. IFN-γ Signaling in Microglia is not Necessary for Normal Social Function
Mice deficient for STAT1 in microglia have normal social preference (n = 9 mice per group; ANOVA for Cre F(1, 16) = 1.809 and sociability F(1, 16) = 30.10; P < 0.0001; **P < 0.01; *** P < 0.001 Sidak’s post-hoc).
Extended Data Figure 9
Extended Data Figure 9. Deleting IFNGR1 by AAV transduction
Mice were injected with AVVs expressing Cre and GFP under a synapsin promoter. a, GFP fluorescence in the PFC. Atlas image adapted from: c 2015 Allen Institute for Brain Science. Allen Brain Atlas [Internet]. Available from: http://www.brain-map.org. b, GFP fluorescence is only observed in NeuN+ neurons, not Iba+ microglia (top = 20×; bottom 63× Objective).
Extended Data Figure 10
Extended Data Figure 10. IFN-γ increased the number of c-fos+ cells in Layer I of the PFC
a, IFN-γ was injected into the CSF (i.c.m.) 2 hours prior to sacrificing and processing brains for immunohistochemistry. Slices were stained for c-fos. Atlas image adapted from: c 2015 Allen Institute for Brain Science. Allen Brain Atlas [Internet]. Available from: http://www.brain-map.org. b, Total c-fos+ cells in layer I of the PFC (n = 3 mice per group; * P < 0.05). Holding current pre and post IFN-γ application on acute slices from the PFC (c) and somatosensory cortex (d; n = 6 neurons from 3 mice). c, VgatCre::Ifngr1fl/fl mice. IFN-γ increased tonic inhibition in Cre- mice (n = 6–7 cells from 4 mice per group; ** P < 0.01 Sidak’s post-hoc test).
Figure 1
Figure 1. Meningeal T cell compartment is necessary for supporting neuronal connectivity and social behavior
a, Wild-type mice exhibit social preference that is absent in SCID mice (ANOVA for genotype (F(1, 26)) = 6.370, P = 0.0181; n = 14 mice per group; **P < 0.01 Sidak’s post-hoc; pooled 2 independent experiments). b, Repopulating the adaptive immune system in SCID mice restored normal social behavior (n = 17;16;15 mice per group; ANOVA for genotype (F(2, 45)) = 8.282, P = 0.0009 and interaction (F(2, 45)) = 9.146, P = 0.0005; ***P < 0.001; **P < 0.01 Sidak’s post-hoc; pooled 3 independent experiments). c, Correlation matrices from wild-type, SCID, and repopulated (Repop.) SCID mice were generated by rsfMRI. Abbrev.: L=left; R=right; FrA=frontal association area; PrL=prelimbic cortex; Ins=insula; OrbC=orbital cortex. d, Correlation values from rsfMRI. The box and whisker plots extend to the 25th and 75th percentiles with the center-line showing the mean. The whiskers represent the min and max data points. (n = 8;9;4 mice per group; ANOVA < 0.05; *P < 0.05 Sidak’s post-hoc; pooled 2 independent experiments). e, Immunohistochemistry of c-fos in the PFC. f, Elevated c-fos+ cells in the prefrontal and orbital cortices of SCID compared to wild-type mice (n = 9;10 mice per group; **P < 0.01; *P < 0.05 t-test; single experiment). g, Acute partial depletion of meningeal T cells caused social deficits (n = 12;13 mice per group; ANOVA for interaction (F(1, 23)) = 7.900, P < 0.01; ***P < 0.001 Sidak’s post-hoc; pooled 2 independent experiments). h, Circos plot showing the connectivity map derived from the pairwise comparison of transcriptome datasets. IFN-γ signature genes are over-represented in cortex of animals exposed to social aggregation and psychostimulants. The representations of IFN-γ, IL-4/IL-13, IL-17, and IL-10/TGF-β dataset connectivity are shown in orange, green, blue, and purple, respectively. Each line represents a pairwise dataset overlap, which was determined using GSEA analysis and filtered by P < 0.05 and NES > 1.5. See Extended Data Fig. 5 for labels. Data from the 3-chamber test (a, b, g) were analyzed by applying a 2-way ANOVA for social behavior and genotype/treatment, followed by a post-hoc Sidak’s test. Bars represent average mean times investigating ± s.e.m.
Figure 2
Figure 2. IFN-γ supports proper neural connectivity and social behavior
a, Ifng−/− mice exhibit social deficits (n = 16;12 mice per group; ANOVA for genotype (F(1, 52)) = 8.327, P < 0.01; **P < 0.01 Sidak’s post-hoc; pooled 2 independent experiments). b, Correlation matrix from Ifng+/+ and Ifng−/− mice. c, Box and whisker plots of correlation values (n = 8 mice per group; *P < 0.05; # P = 0.06 t-test; repeated 2 times). d, A single CSF injection of IFN-γ (20ng) was sufficient to rescue social deficits in Ifng−/− mice 24 hours post-injection (n = 14;11 mice per group; ANOVA for interaction (F(1, 46)) = 10.22 P < 0.01; ***P < 0.001 Sidak’s post-hoc; pooled 2 independent experiments). e, Expression of IFN-γ receptor subunit mRNA by fluorescent in situ hybridization in slices from mouse PFC. RNA probes and corresponding colors: left:psd95-blue (neurons); right: CD11B-blue (microglia); top: IFNGR1-red; bottom:IFGR2-red. Yellow arrowheads denote co-localization. f, Expression of IFN-γ receptor subunit protein by flow cytometry. Cells were gated on Hoechst+/live/single then neurons and microglia were gated on NeuN and CD11B, respectively. Ifngr1−/− mice and no primary antibody for IFNGR2 were included as negative controls. g, Deleting Ifngr1 from neurons in the PFC caused social deficits. Ifngr1fl/fl mice were injected with AAV-Syn-CRE-GFP into the PFC and tested for social behavior 3 weeks post injection (n = 11;12 mice per group; ANOVA for genotype (F(1, 21)) = 10.62, P < 0.01; *P < 0.05 Sidak’s post-hoc; pooled 3 independent experiments). h, VgatCre::Stat1fl/fl mice exhibit social deficits (n = 10;11 mice per group; ANOVA for interaction (F(1, 19)) = 10.30 < 0.01; ***P < 0.001 Sidak’s post-hoc; pooled 3 independent experiments). i, Layer 2/3 neurons in slices from wild-type mice are held under tonic GABAergic inhibition (top), which is blocked by the GABA-A receptor antagonist bicuculline. IFN-γ increases tonic GABAergic inhibitory current (n = 11 cells from 4 mice; bottom). j, Holding current pre and during IFN-γ (P = 0.01 t-test). k, IFN-γ increased latency to reach each seizure stage (n = 6 mice per group; ANOVA with repeated measures < 0.001; ***P < 0.001 Sidak post-hoc) and (inset) reduced the maximum severity of seizures (***P < 0.001 t-test; repeated 2 times). l, Diazepam rescued social deficits in Ifng−/− mice (n = 12 mice per group; ANOVA for interaction (F(1, 22)) = 9.204 < 0.01; **P < 0.01 Sidak’s post-hoc; repeated 2 times). Data from the 3-chamber test (a, d, g, h, i) were analyzed by applying a 2-way ANOVA for social behavior and genotype/treatment, followed by a Sidak’s post-hoc test. Bars represent average mean times investigating ± s.e.m. All experiments were repeated at least once.
Figure 3
Figure 3. Over-representation of IFN-γ transcriptional signature genes in social behavior-associated brain transcriptomes of rat, mouse, zebrafish, and drosophila
GSEA plots demonstrate the over-representation of IFN-γ transcriptional signatures (derived from Molecular Signature Database C2, GSE33057, or Lopez-Munoz, A. et al) in brain transcriptomes of (a) mice and (b) rats subjected to social or isolated housing and in brain transcriptomes of (c) domesticated zebrafish compared to a wild zebrafish strain. (d) Over-representation of JAK/STAT pathway transcriptional signature genes (derived from GSE2828) in head transcriptomes of flies selected for low-aggressive behavior (behavioral readout for social behavior in flies (see methods section “Meta-data analysis” for more details)). Genes are ranked into an ordered list according to their differential expression. The middle part of the plot is a bar code demonstrating the distribution of genes in the IFN-γ transcriptional signature gene set against the ranked list of genes. The list on the right shows the top genes in the leading edge subset. Promoter regions of these genes were scanned for transcription factor binding site (TFBS) using MEME suite. MEME output demonstrates significant STAT TFBS enrichment in cis-regulatory regions of leading edge genes up-regulated in a social context.

Comment in

References

    1. Derecki NC, et al. Regulation of learning and memory by meningeal immunity: a key role for IL-4. J Exp Med. 2010;207:1067–1080. doi: 10.1084/jem.20091419. - DOI - PMC - PubMed
    1. Bourke AF. Hamilton’s rule and the causes of social evolution. Philosophical transactions of the Royal Society of London. Series B, Biological sciences. 2014;369:20130362. doi: 10.1098/rstb.2013.0362. - DOI - PMC - PubMed
    1. Cacioppo S, Capitanio JP, Cacioppo JT. Toward a neurology of loneliness. Psychol Bull. 2014;140:1464–1504. doi: 10.1037/a0037618. - DOI - PMC - PubMed
    1. Kennedy DP, Adolphs R. The social brain in psychiatric and neurological disorders. Trends Cogn Sci. 2012;16:559–572. doi: 10.1016/j.tics.2012.09.006. - DOI - PMC - PubMed
    1. Ashwood P, et al. Altered T cell responses in children with autism. Brain Behav Immun. 2011;25:840–849. doi: 10.1016/j.bbi.2010.09.002. - DOI - PMC - PubMed

Publication types

Substances