. 2016 Aug 9;7(32):52061-52084.
doi: 10.18632/oncotarget.10474.

Hypoxia-mediated alterations and their role in the HER-2/neuregulated CREB status and localization

Affiliations

Hypoxia-mediated alterations and their role in the HER-2/neuregulated CREB status and localization

André Steven et al. Oncotarget. .

Abstract

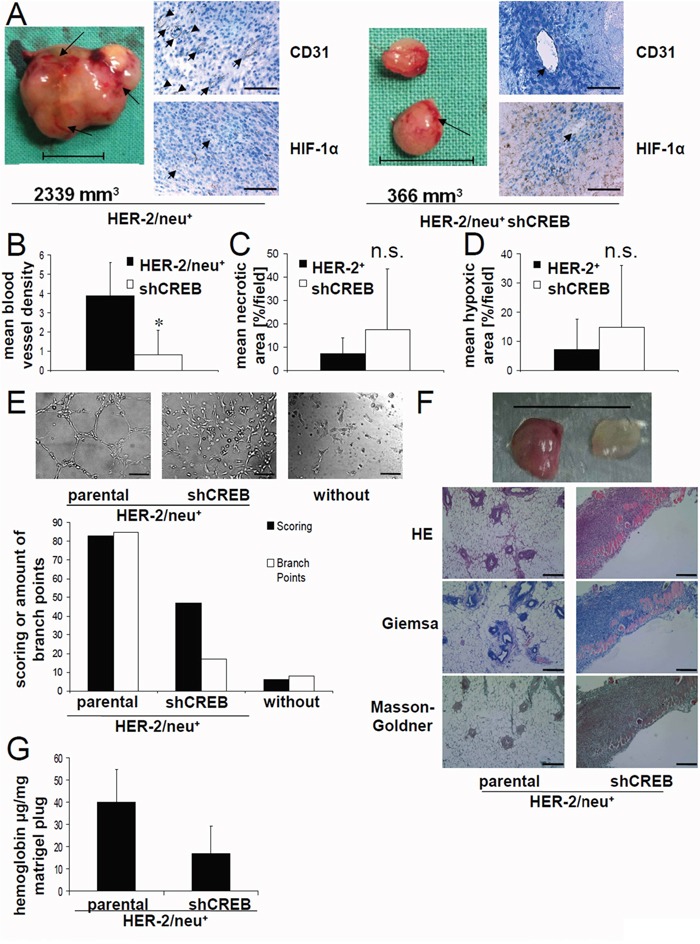
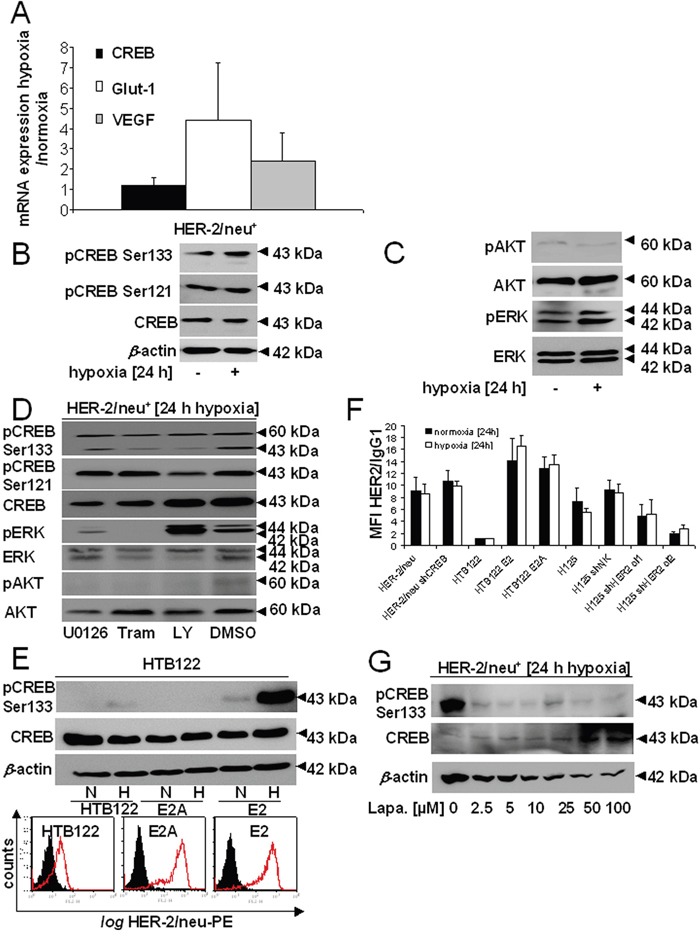
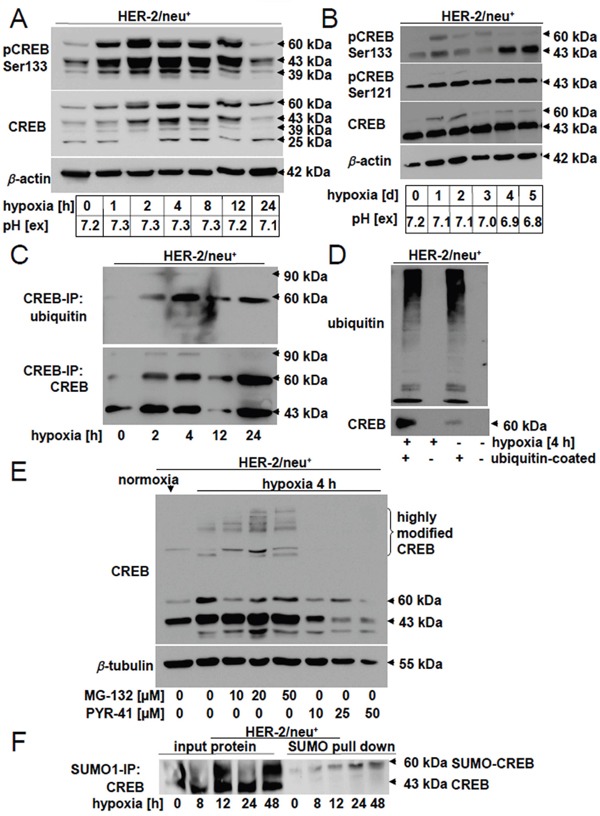
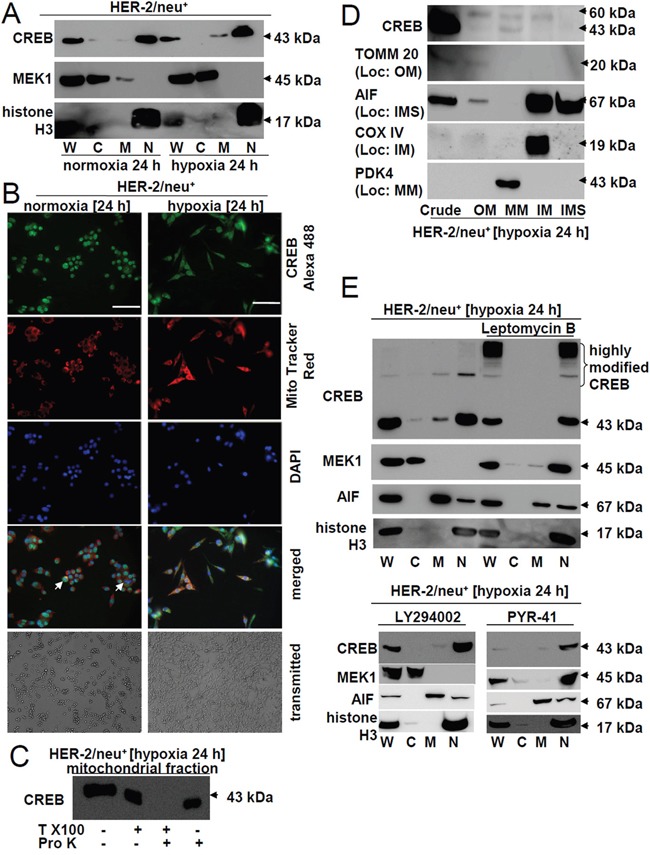
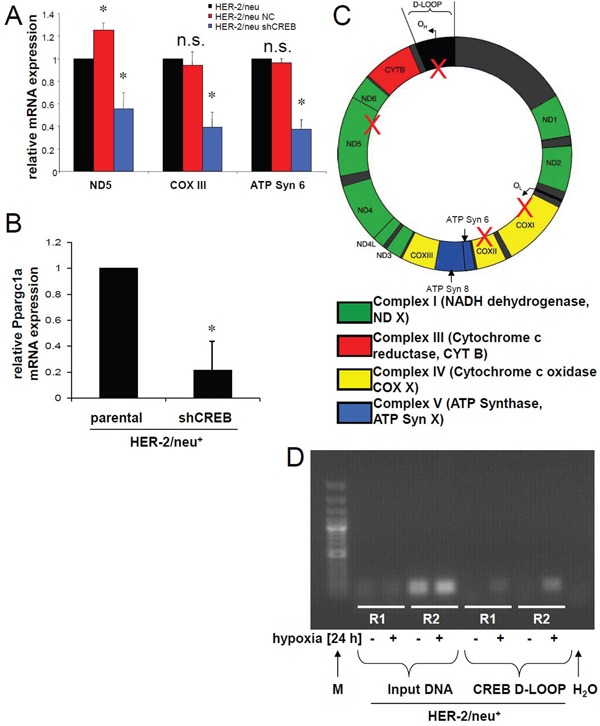
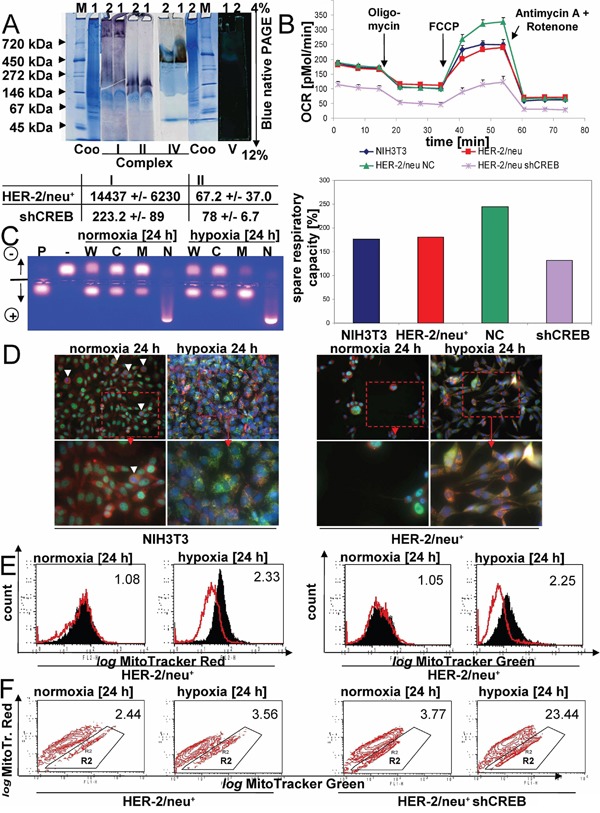
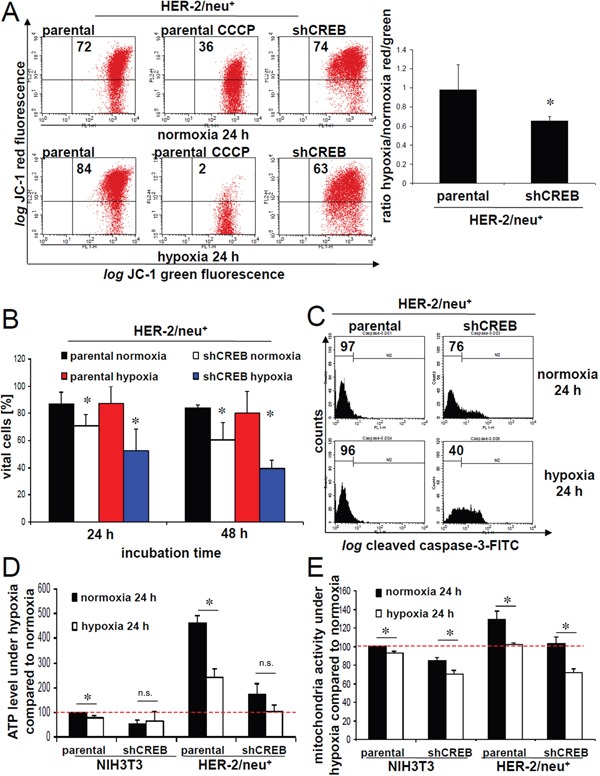
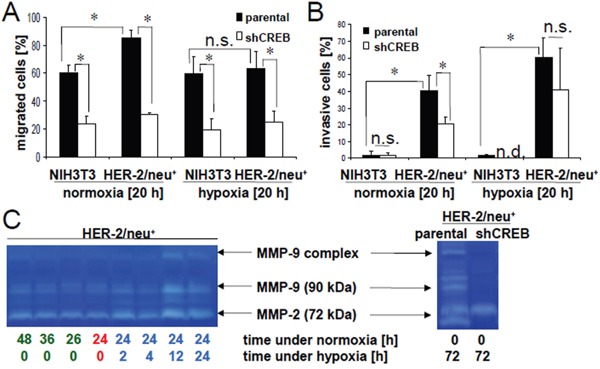
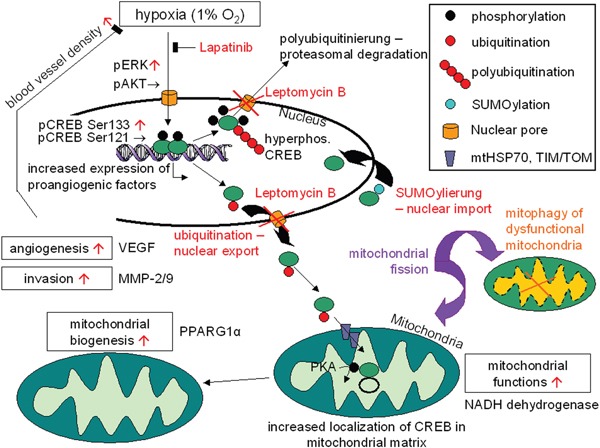
The cAMP-responsive element-binding protein (CREB) is involved in the tumorigenicity of HER-2/neu-overexpressing murine and human tumor cells, but a link between the HER-2/neu-mediated CREB activation, its posttranslational modification and localization and changes in the cellular metabolism, due to an altered (tumor) microenvironment remains to be established. The present study demonstrated that shRNA-mediated silencing of CREB in HER-2/neu-transformed cells resulted in decreased tumor formation, which was associated with reduced angiogenesis, but increased necrotic and hypoxic areas in the tumor. Hypoxia induced pCREBSer133, but not pCREBSer121 expression in HER-2/neu-transformed cells. This was accompanied by upregulation of the hypoxia-inducible genes GLUT1 and VEGF, increased cell migration and matrix metalloproteinase-mediated invasion. Treatment of HER-2/neu+ cells with signal transduction inhibitors targeting in particular HER-2/neu was able to revert hypoxia-controlled CREB activation. In addition to changes in the phosphorylation, hypoxic response of HER-2/neu+ cells caused a transient ubiquitination and SUMOylation as well as a co-localization of nuclear CREB to the mitochondrial matrix. A mitochondrial localization of CREB was also demonstrated in hypoxic areas of HER-2/neu+ mammary carcinoma lesions. This was accompanied by an altered gene expression pattern, activity and metabolism of mitochondria leading to an increased respiratory rate, oxidative phosphorylation and mitochondrial membrane potential and consequently to an enhanced apoptosis and reduced cell viability. These data suggest that the HER-2/neu-mediated CREB activation caused by a hypoxic tumor microenvironment contributes to the neoplastic phenotype of HER-2/neu+ cells at various levels.

Keywords: CREB; HER-2/neu; angiogenesis; hypoxia; mitochondria.


Conflict of interest statement

The authors declare to have no conflicts of interest.

Figures

Figure 1
Figure 1. Link of decreased tumorgenicity of CREB-deficient HER-2/neu+ cells and reduced angiogenesis, but enhanced hypoxic areas
A. DBA-1 mice were injected with parental or CREB-deficient HER-2/neu+ cells as described in Materials and Methods and tumors were removed after 42 days. Representative photos of parental and CREB-deficient HER-2/neu+ tumors are shown. The arrows indicate the blood vessels on the tumor surface. The tumor volume is given. The bar represents 1 cm (left). 5 μm slices of paraffin-embedded tumors were stained with the indicated primary antibody followed by an anti-rabbit secondary antibody. The detection was performed with the peroxidase substrate DAB. Slides were counterstained with methylene blue. The arrow heads indicate the blood vessels. The bar represents 100 μm; Magnification: 40x (right). B. The blood vessel density of the tumors was analysed by counting vessel structures in the anti-CD31 mAb-stained samples (see 1A). Bars represent mean values from four samples/group with four counted fields/sample. C. The necrotic area was analysed in the HE-stained samples. Bars represent mean values from four samples/group with four counted fields/sample. D. The hypoxic area was analysed in the anti-HIF-1α-stained samples. Bars represent mean values from four samples/group with four counted fields/sample. E. 1×10⁴ HUVEC/well were seeded in a 96 well plate on polymerized growth factor reduced matrigel. 100 μl/well fresh medium or cell conditioned medium was added and the cells were incubated for 16 h by 37°C. The morphology of the HUVEC under these distinct culture conditions was compared (left) and the mesh-like structures were quantified (right) as described by Zhang [51]. The bar represents 80 μm; Magnification: 10x. F. 1×10⁵ parental and CREB-deficient HER-2/neu+ cells resuspended in matrigel were injected into the flank of female DBA-1 mice (n = 8). 7 days after injection the mice were killed and the removed matrigel plugs were photographed. The bar represents 1 cm (up). 5 μm slices of the matrigel plugs from parental and CREB-deficient HER-2/neu+ cells were stained as indicated. The bar represents 100 μm; Magnification: 10x (down). G. Matrigel plugs from parental and CREB-deficient HER-2/neu+ cells were homogenized and their hemoglobin content was analysed as described as in Material and Methods. The bars represent the hemoglobin concentration of each plug from mice injected with the indicated cell line normalized to the weight of the plug. Data demonstrate the results of one out of two independent experiments (with five Matrigel plugs in each experiments) regarding the hemoglobin content/plug from parental and CREB-deficient HER-2/neu+ cells.
Figure 2
Figure 2. Hypoxia-induced CREB phosphorylation by induction of the MAPK/ERK signal transduction pathway
A. The transcription of CREB and of hypoxic markers (GLUT1, VEGF) was analysed by qPCR. The bar charts represent the mean values and SEM of three independent experiments. B. CREB expression and phosphorylation was compared in HER-2/neu+ NIH3T3 cells under normoxia and hypoxia by Western blot analysis as described in Materials and Methods using an anti-CREB and anti-CREB phosphorylation-specific antibodies. One of three representative Western blots is shown. C. The activity/phosphorylation of the AKT and ERK pathway was determined under normoxic and hypoxic conditions by Western blot analysis using total and phosphorylation-specific antibodies, respectively. The data represent one of three biological replicates. D. Cells were treated under hypoxia with 5 μM LY294002, 100 nM trametinib or 5 μM U0126 for 24 h. The phosphorylation and total expression of CREB, AKT and ERK was analysed by Western Blot. E. Hypoxia-mediated induction of CREB phosphorylation and its dependence on the HER-2/neu status was determined in HTB122 cells and their HER-2/neu-transformed transfectants (E2A: dominant negative mutation in the HER-2/neu kinase domain; E2: wild-type HER-2/neu) either incubated under normoxia or hypoxia for 24 h, respectively, before Western blot analysis was performed as described in Materials and Methods. The results show one of two independent experiments (up). HTB122, E2 and E2A cells were incubated under normoxic conditions for 24 h before the HER-2/neu cell surface expression was determined using flow cytometry. The data are represented as histograms from one out of two representative experiments. The black area represents the IgG control, while the red defined area is the HER-2/neu-PE staining (down). F. Cells were incubated for 24 h under normoxia or hypoxia and the presentation of HER-2/neu on the cell surface was determined by flow cytometry as described in Materials and Methods using a PE-labelled anti-HER-/neu mAb. The bars represent the MFI of HER-2/neu compared to an IgG control from two independent experiments. G. The effect of inhibition of the HER-2/neu activity by treatment of parental HER-2/neu+ cells with increasing concentrations of lapatinib on CREB phosphorylation was analysed by Western blot. Cells were treated with lapatinib for 24 h under hypoxic conditions.
Figure 3
Figure 3. Hypoxia-mediated post-transcriptional modification and altered distribution of CREB
A. Comparative analysis of different pCREB and CREB modifications under normoxia and early phase hypoxia (up to 12 h). Western blot analyses were performed as described using CREB and pCREBSer133-specific mAb. The size of the modified CREB protein is given. The blots represent one of three biological replicates. Extracellular pH (pH [ex]) of the cell free media was directly measured with a pH electrode after harvesting the cells. B. CREB phosphorylation at serine residue 133 and 121 as well as CREB protein expression was analysed under late phase hypoxia (up to 5 d). The photos represent one of two independent biological replicates. The pH of the culture media was measured with a pH electrode directy after harvesting the cells. C., D. Ubiquitination was analysed by CREB immune precipitation (C) and ubiquitin pull down (D) as described in Materials and Methods by loading the complete supernatant on 10% (C) or 12% (D) gels. The proteins were identified by using anti-CREB- or anti-ubiquitin-specific mAb. Results represent data of three (C) or two (D) biological replicates. E. Influence of the proteasome inhibitor MG-132 and the ubiquitin inhibitor PYR-41 on CREB modifications. Parental HER-2/neu+ cells were either left untreated or treated with different concentrations of MG-132 (10, 25, 50 μM) or PYR-41 (10, 20, 50 μM) for 4 h under hypoxia. Following Western blot analysis using anti-CREB-specific antibodies as described above, the appearance of highly modified CREB molecules was determined. The blot represents one of two biological experiments. F. Cells were cultivated under hypoxia for the indicated time and SUMO-1 modified proteins in the cell lysate were precipitated by immunoprecipitation. The proteins were loaded onto a 10% SDS Gel and CREB was detected with specific antibodies.
Figure 4
Figure 4. Increased mitochondrial localization of CREB under hypoxia
A. The distribution of CREB in different cell fractions was analysed by using a commercial kit for separations followed by Western blot analysis of the distinct fractions. Anti-MEK1 (cytosol) and anti-histone H3 (nucleus) mAb served as markers for the subcellular compartments. “W” marks the whole cell lysate, “C” the cytosolic fraction, “M” the membrane/mitochondrial fraction and “N” the nuclear fraction. The picture represents one of three independent experiments. B. Cells were incubated for 24 h under hypoxia or normoxia and 30 min before terminating the cells were stained with 500 nM MitoTracker. After removing the media and fixation with 4% PFA for 20 min the cells were permeabilized with 0.5% Triton X100 in HBBS (HBSS-T) for 30 min. Following incubation with CREB antibody overnight at 4°C the cells were washed three times with HBSS, incubated with the secondary antibody (rabbit-Alexa 488) for 1 h, washed again three times with HBSS and then the nuclei were stained with DAPI. Single and merged colors recorded at a Pathway 855 (BD) are shown. Note the complete loss of nuclear CREB in dividing cells (white arrow heads). The bar represents 100 μm; Magnification: 20x. Morphology of the cells cultivated under normoxia or hypoxia (24 h each) was recorded by microscopic pictures. The pictures were taken on living, non-stained cells (transmitted). C. 1 mg isolated intact mitochondria were incubated in 1% Triton X100 and/or 10 U proteinase K in proteinase K buffer and were incubated at 37°C for 30 min and 60°C for 10 min. The reaction was stopped by boiling the probes in Laemmli buffer for 5 min and the stability of CREB was analysed by Western blot using an anti-CREB-specific mAb as described in Materials and Methods. D. Mitochondria were sub fractionated into outer membrane (OM), inter membrane space (IMS), inner membrane (IM) and mitochondrial matrix (MM). The purity of the fractions was analysed with marker proteins: TOM20 for OM, AIF for IMS, COXIV for IM, PDK4 for MM. E. Cells were cultured in the presence or absence of 50 ng/ml Leptomycin B, 10 μM LY294002 and 10 μM PYR-41 for 24 h under hypoxic conditions. Then cellular proteins were fractionated as described in the Material and Methods section. Additionally to the marker proteins used in (A) AIF served as a marker for the mitochondrial fraction. “W” represents the whole cell lysate, “C” the cytosolic fraction, “M” the membrane/mitochondrial fraction and “N” the nuclear fraction. The picture shows one of two experiments. An accumulation of highly modified CREB and the nuclear translocation of MEK1 and partially of AIF was found under leptomycin B treatment.
Figure 5
Figure 5. Regulation of the mitochondrial biogenesis via Ppar1a and CREB binding to mitochondrial elements
A. mRNA expression of mitochondrial encoded genes was determined by real time PCR using gene specific primer. The bar charts represent the data from two independent experiments. B. Expression of Ppargc1a mRNA was quantified by qPCR. The bar charts represent the data from two independent experiments. C. Putative CRE motifs were identified in the mtDNA. The mtD-LOOP has 2 CRE elements and in the protein coding regions 3 other CRE elements were identified. These were marked with a red cross. D. CREB binding DNA was immunoprecipitated, purified and used in a real time PCR. The products were further analysed by 2% agarose gel electrophoresis. IgG rabbit antibody was used as a control. The gel represents two of three independent experiments.
Figure 6
Figure 6. Regulation of mitochondrial functions by mito-CREB
A. The activity of mitochondrial complexes was analysed by in gel activity. The numbers in A are the mitochondrial proteins from HER-2/neu+ cells (1) and HER-2/neu+ shCREB cells (2). M: representative molecular weight marker. Coo: Colloidal coomassie staining. The staining of complex V (ATP synthase) was documented in front of a dark background. The data beyond the gel staining represents the spectrometrically analysis of the complex I and II activities from three independent experiments. B. Basal oxygen consumption rate (OCR) (an indicator for mitochondrial respiration) was detected using the XF96e Extracellular Flux Analyzer (Seahorse Bioscience). Next, OCR responses towards the application of oligomycin (1 μM), FCCP (2.5 μM), and the combination of antimycin (3 μM), and rotenone (3 μM) (XF Cell Mito Stress Test Kit, Seahorse Bioscience) were evaluated. All experiments were performed in at least hexaplicates. Changes after FCCP application are indicative for the maximal respiratory capacity (up). The spare respiratory capacity was calculated from the results (down). C. The PKA activity of the whole cell lysate (W) and the intracellular fraction (C, M, N) was analysed as described in Materials and Methods. Samples (cultivated for 24 h under normoxia or hypoxia), positive (P) and negative (−) controls were loaded onto an agarose gel. The gel was photographed under UV irradiation. D. The localization of CREB (green), mitochondria (red) and the nucleus (blue) was compared in NIH3T3 and HER-2/neu+ cells under normoxia and hypoxia. White arrows mark dividing cells, which lacks nuclear CREB. Under hypoxic conditions the mitochondrial fission is visible. E. HER-2/neu+ cells and CREB-deficient derivatives were incubated under normoxia and hypoxia for 24 hours, before cells were stained with MitoTracker Green and Red, respectively. F. In the contour plot the cells in R2 represents mitochondrial dysfunctional cells (pos. for MitoTracker Green, weaker staining for MitoTracker Red). 10.000 cells were analysed by flow cytometry.
Figure 7
Figure 7. Decreased mitochondrial membrane potential and cell vitality upon CREB silencing
A. The mitochondrial membrane potential was determined in normoxic or hypoxic cultivated cells by using JC-1 fluorescence analysis. The fluorescence of 5×10³ stained cells was analysed with a FACsCalibur (BD) and CCCP-treated cells (2 μM) served as a control. The number of cells with an intact mitochondrial membrane potential is given in the upper right region (left). The ratio of cells with an intact mitochondrial membrane potential under normoxia/hypoxia is given for three independent experiments (right). B. The amount of apoptotic and necrotic cells was determined by annexin V/propidium iodide staining as recently described [35]. 1×10⁴ stained cells were analysed with a FACS Calibur (BD). The amount of vital cells after 24 h and 48 h cultivation is shown in the bar charts. Data represent the mean of three independent experiments. C. Cleaved caspase-3 activity was measured as recently described by Stehle and co-authors [35]. Both parental or CREB-deficient HER-2/neu+ cells were cultured under normoxic and hypoxic conditions before cleaved caspase-3 was determined as described in Materials and Methods using flow cytometry. D. ATP levels were measured with a luciferase specific substrate as described in Materials and Methods. Data show mean values from three independent experiments. E. Mitochondrial activity was analysed with the colorimetrical XTT substrate assay as described in Materials and Methods. Data show mean values from three independent experiments.
Figure 8
Figure 8. Abrogation of hypoxia-induced invasion by CREB silencing
The influence of 20 h hypoxia or normoxia on the migration A. and invasion B. of HER-2/neu and HER-2/neu+ cells was analysed using trans-well inserts as described in Material and Methods. The bar charts represent three independent experiments performed in duplicates. C. The MMP activity under normoxic and hypoxic conditions in the culture supernatant was determined by gelatin zymography (left). Cells were incubated for 24 h under normoxic conditions (red) and were then incubated for the indicated time under hypoxia (blue) or were left under normoxia (green). The increased activity of MMP-9 and MMP-2 after 12 h or 24 h hypoxia is visible in both right lanes compared to the normoxic controls (left lanes). Parental and CREB-deficient HER-2/neu+ cells were incubated for 72 h under hypoxia and 20 μl supernatant was analysed on gelatin zymogram (right). A decreased activity of MMP-9 and of the cleaved MMP-2 was detected in CREB deficient cells, while the inactive MMP-2 (72 kDa) is not altered. The gels represent one of two independent experiments.
Figure 9
Figure 9. Model for the regulation and functions of CREB activity under hypoxic conditions in nucleus and mitochondria
Hypoxia increases the activity of CREB (phosphorylation at Ser133 but not Ser121) by the MEK-ERK pathway, leading to an increased expression of pro-angiogenic factors (VEGF). This mechanism can counteract hypoxia. Hyperphosphorylation of CREB under hypoxia causes protein degradation by ubiquitination, while CREB can be stabilizied by SUMOylation. Import of modified CREB into mitochondria is enhanced under decreased oxygen supply, which in return can promote mitochondrial biogenesis and mitochondrial functions by binding to the mitochondrial promoter (D-LOOP) as well as regulating the expression of Ppargc1a.

Similar articles

Cited by

References

    1. Dodson GE, Tibbetts RS. DNA replication stress-induced phosphorylation of cyclic AMP response element-binding protein mediated by ATM. J Biol Chem. 2006;281:1692–1697. - PubMed
    1. Johannessen M, Delghandi MP, Moens U. What turns CREB on? Cell Signal. 2004;16:1211–1227. - PubMed
    1. Shi Y, Venkataraman SL, Dodson GE, Mabb AM, LeBlanc S, Tibbetts RS. Direct regulation of CREB transcriptional activity by ATM in response to genotoxic stress. Proc Natl Acad Sci U S A. 2004;101:5898–5903. - PMC - PubMed
    1. Ishimoto T, Mano H, Ozawa T, Mori H. Measuring CREB activation using bioluminescent probes that detect KID-KIX interaction in living cells. Bioconjug Chem. 2012;23:923–932. - PubMed
    1. Braeuer RR, Zigler M, Villares GJ, Dobroff AS, Bar-Eli M. Transcriptional control of melanoma metastasis: the importance of the tumor microenvironment. Semin Cancer Biol. 2011;21:83–88. - PMC - PubMed

MeSH terms

Substances