. 2016 Jul 26;113(30):8490-5.
doi: 10.1073/pnas.1608873113. Epub 2016 Jul 7.

Nonoverlapping roles of PD-1 and FoxP3 in maintaining immune tolerance in a novel autoimmune pancreatitis mouse model

Affiliations

Nonoverlapping roles of PD-1 and FoxP3 in maintaining immune tolerance in a novel autoimmune pancreatitis mouse model

Baihao Zhang et al. Proc Natl Acad Sci U S A. .

Abstract

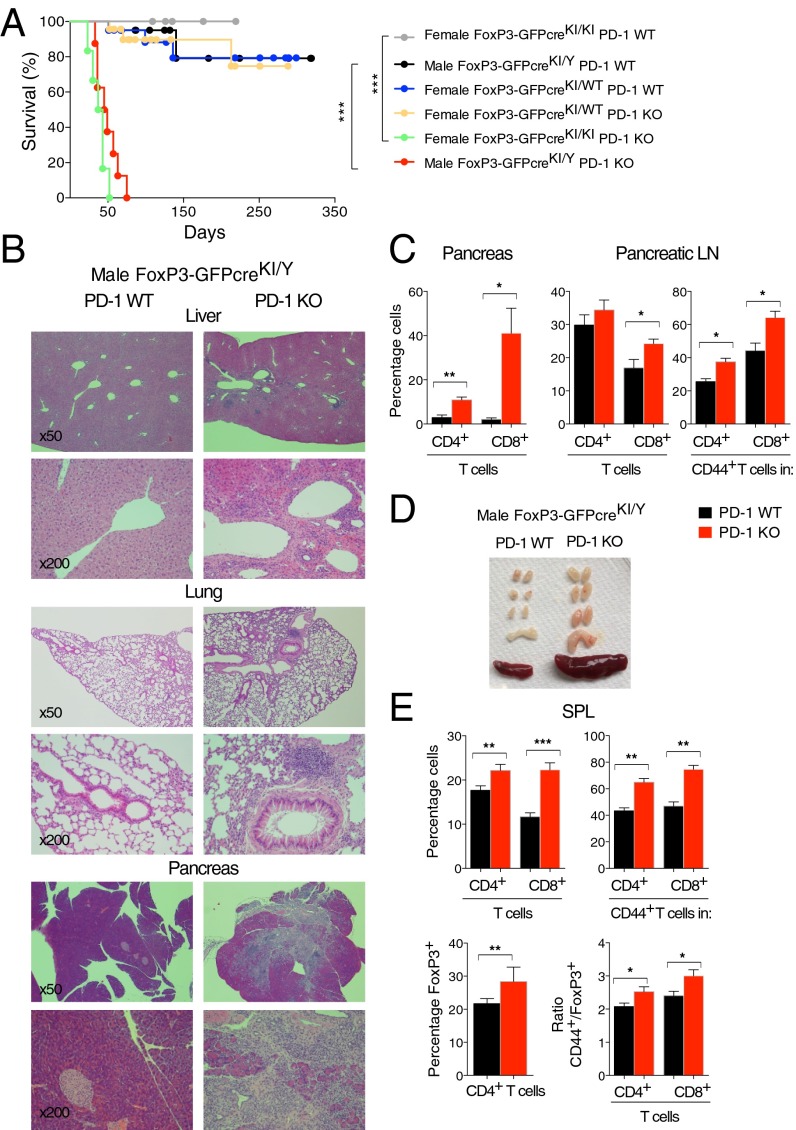
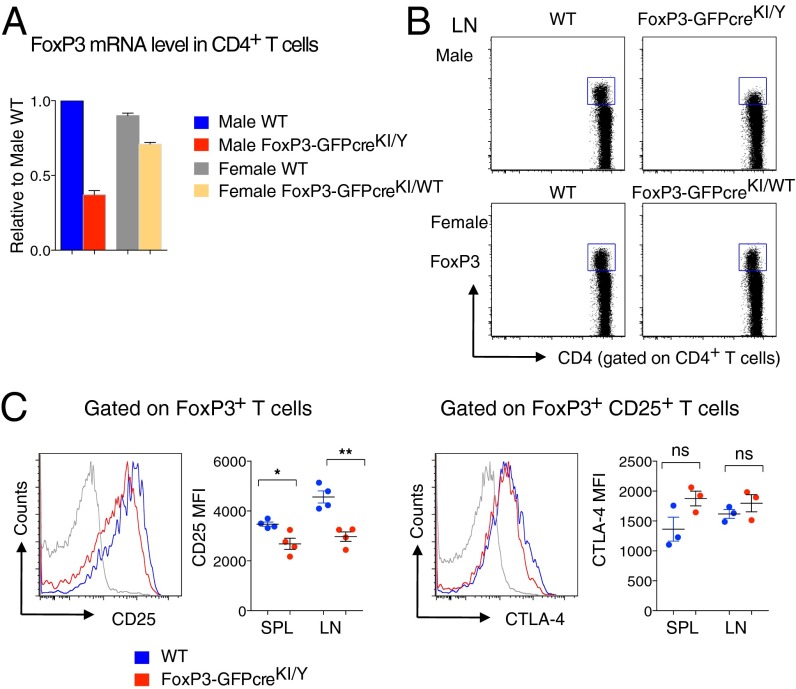
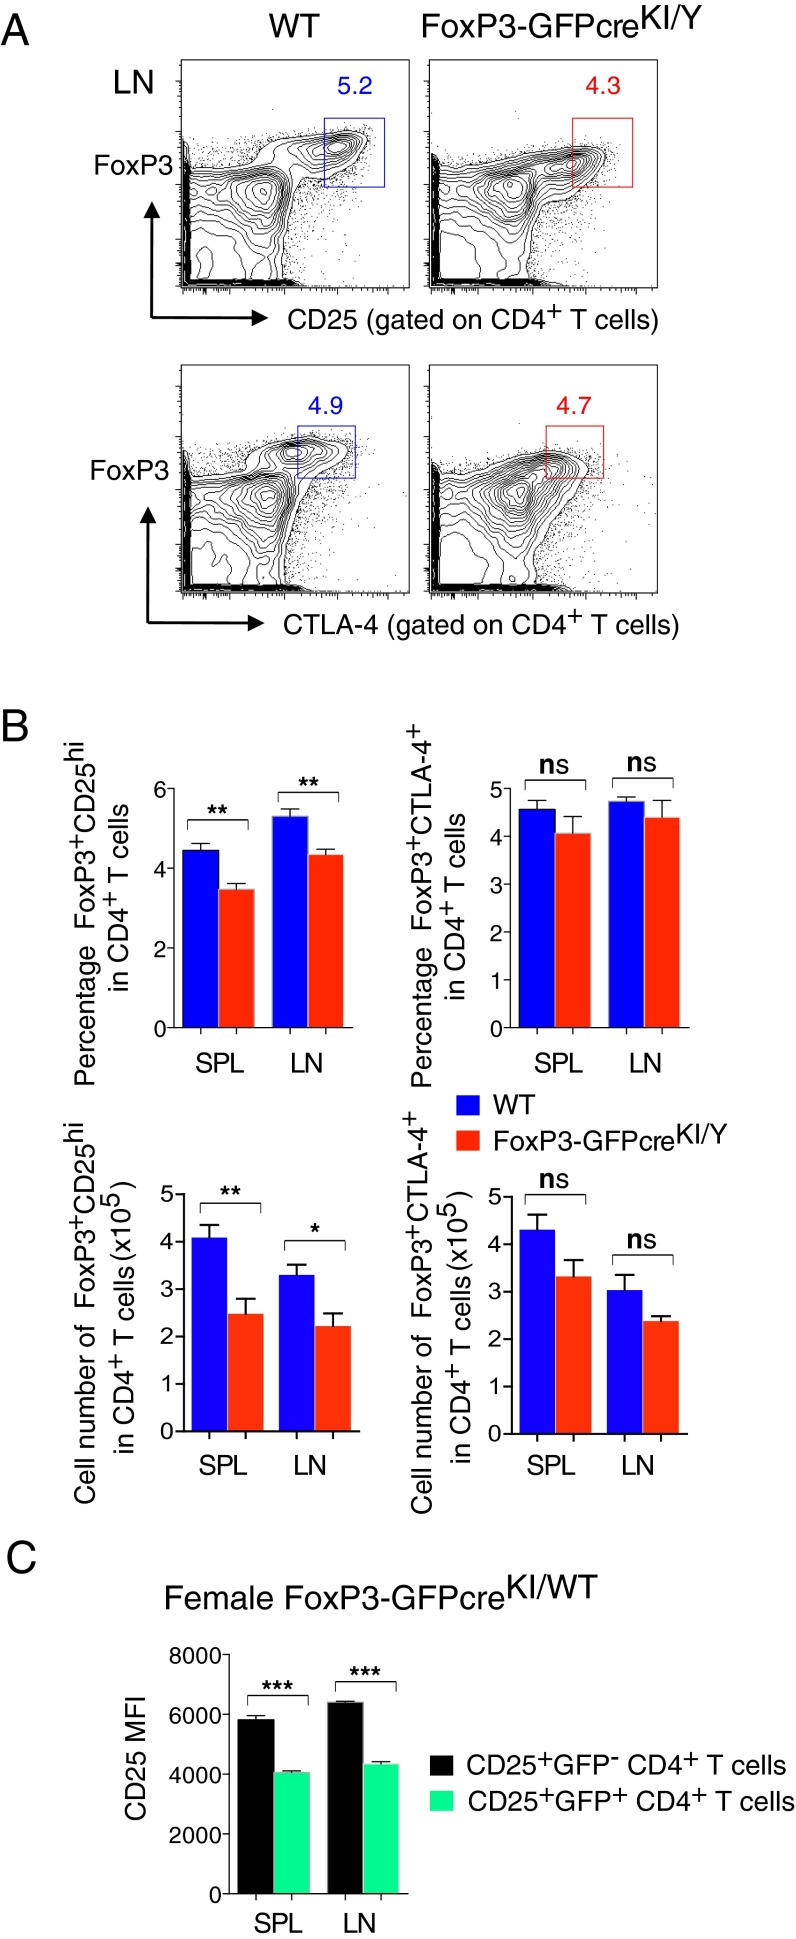
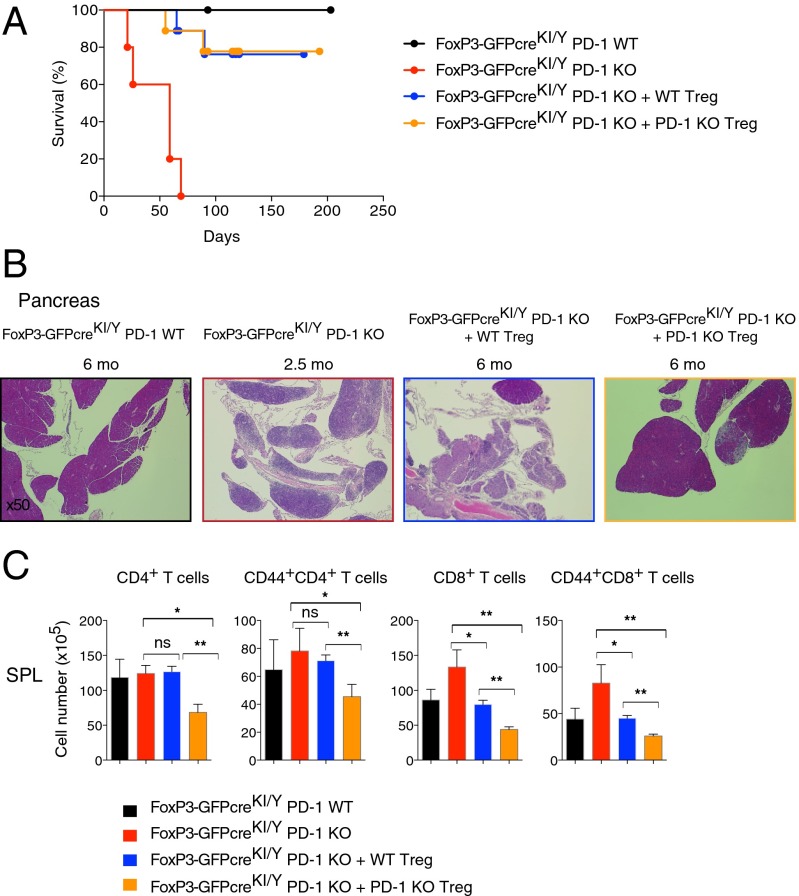
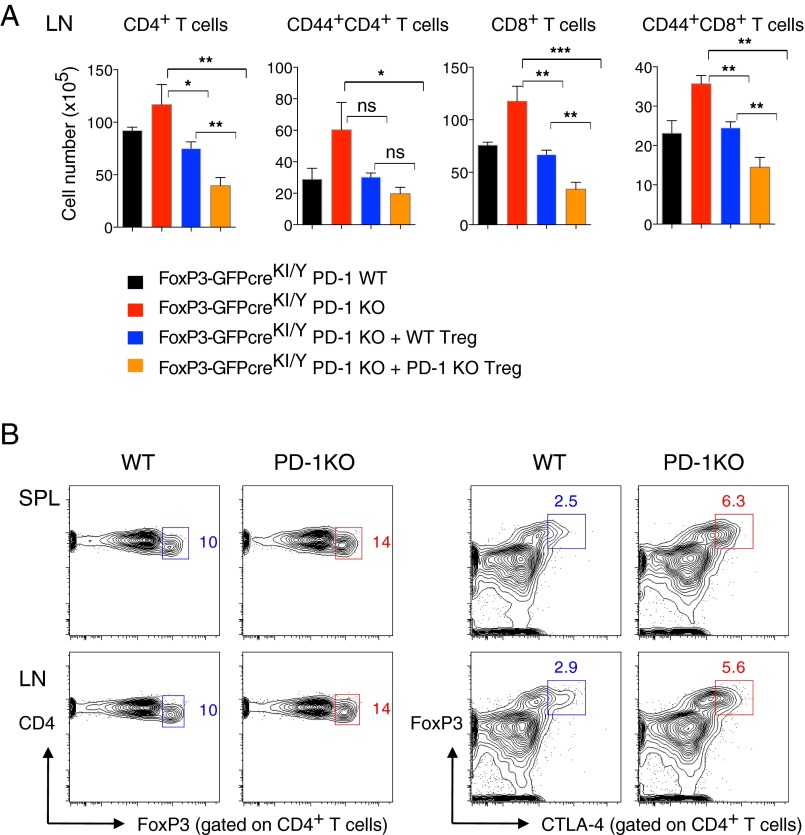
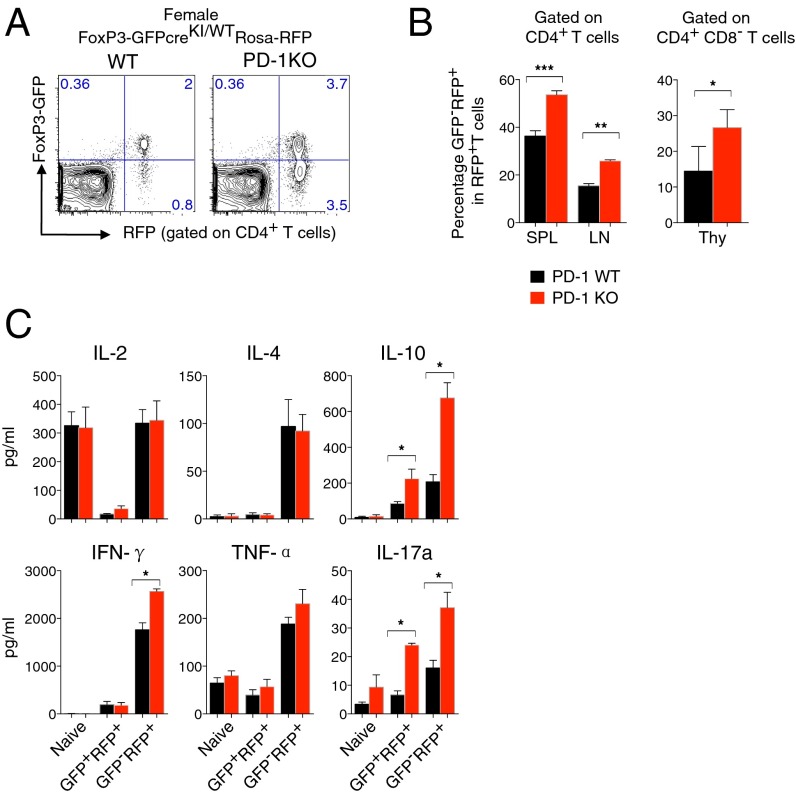
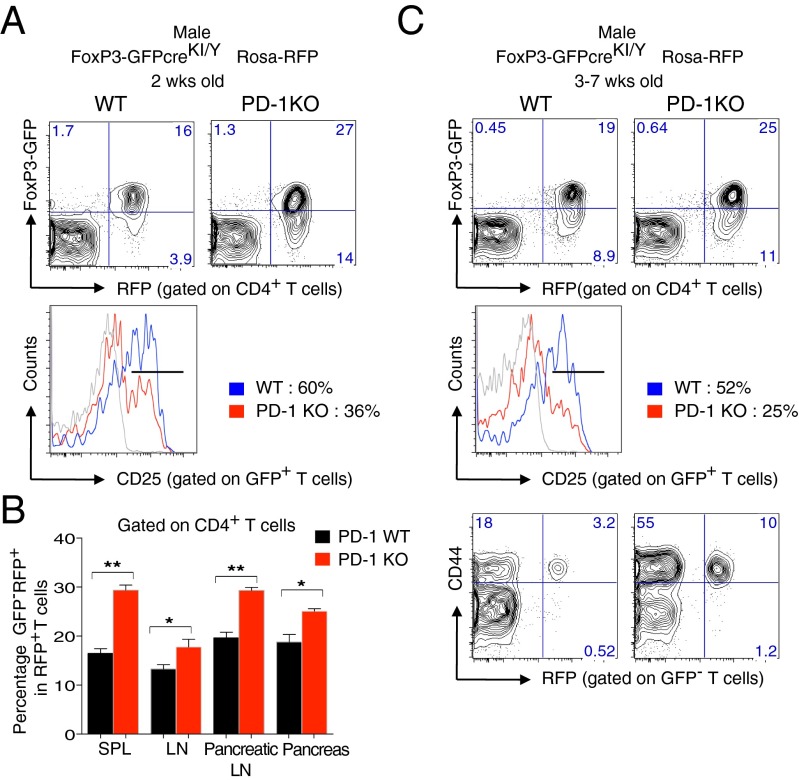
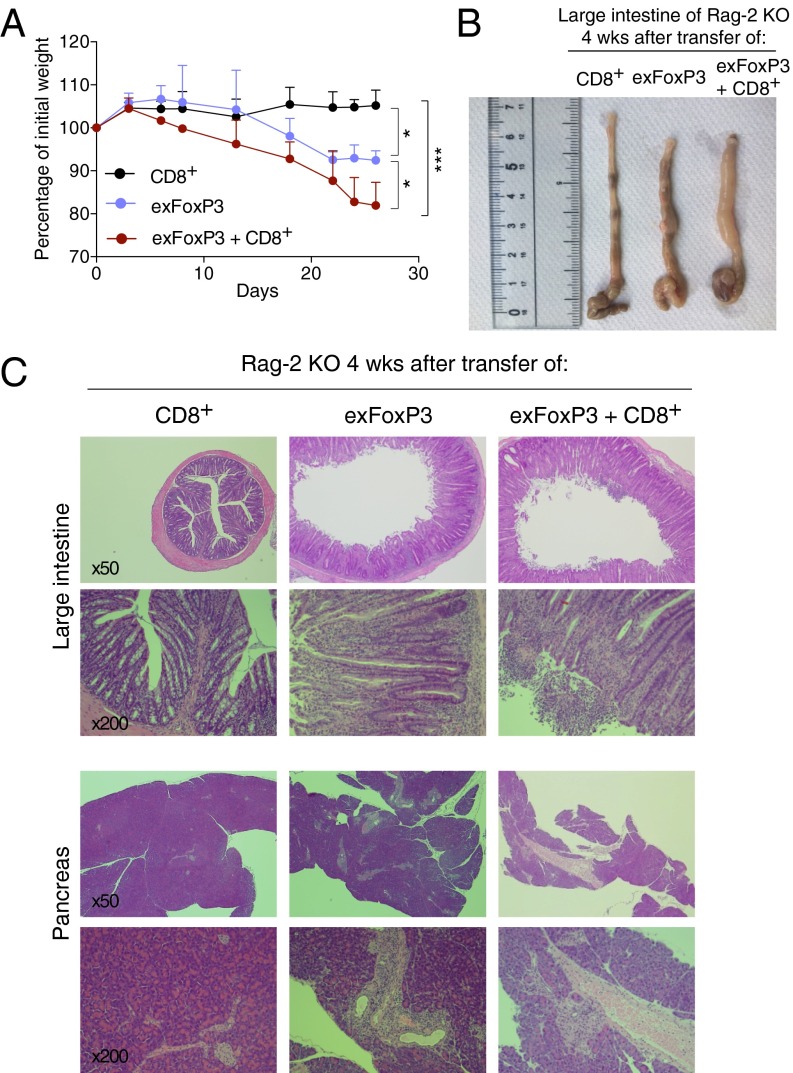
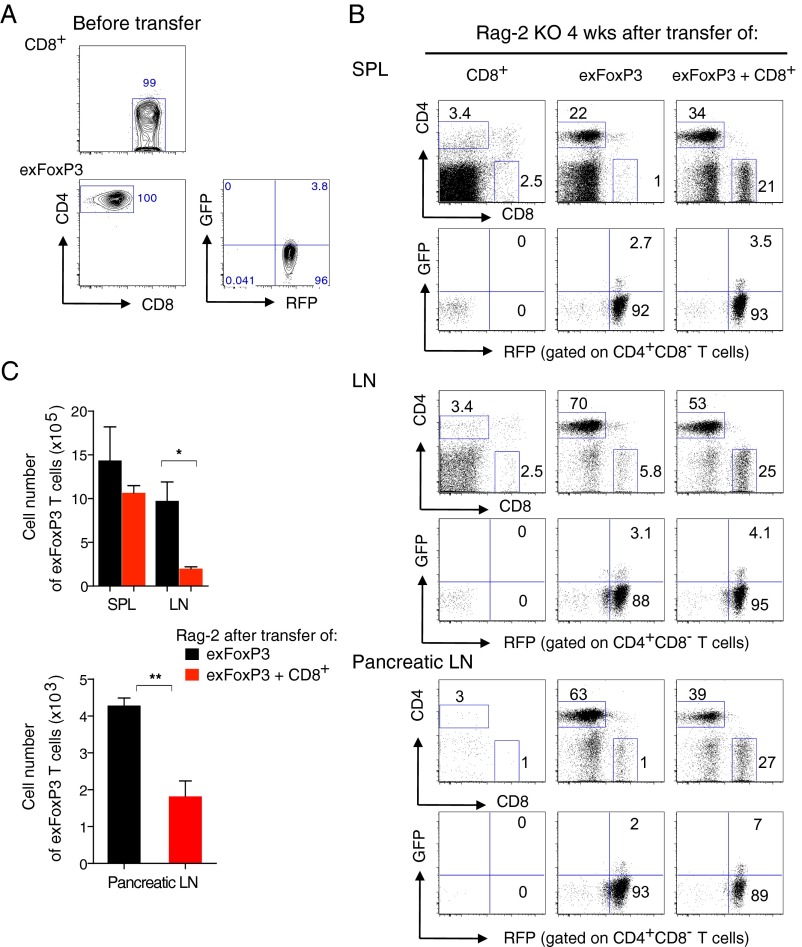
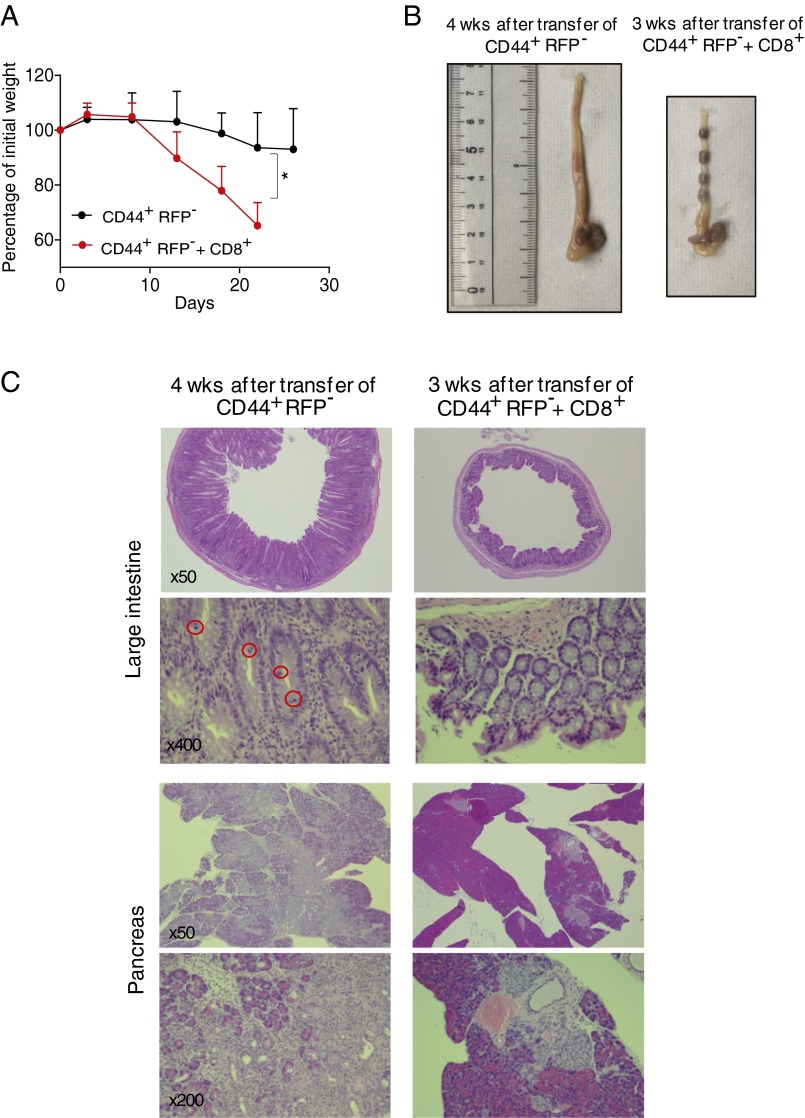
PD-1 (programmed-death 1), an immune-inhibitory receptor required for immune self-tolerance whose deficiency causes autoimmunity with variable severity and tissue specificity depending on other genetic factors, is expressed on activated T cells, including the transcription factor FoxP3(+) Treg cells known to play critical roles in maintaining immune tolerance. However, whether PD-1 expression by the Treg cells is required for their immune regulatory function, especially in autoimmune settings, is still unclear. We found that mice with partial FoxP3 insufficiency developed early-onset lympho-proliferation and lethal autoimmune pancreatitis only when PD-1 is absent. The autoimmune phenotype was rescued by the transfer of FoxP3-sufficient T cells, regardless of whether they were derived from WT or PD-1-deficient mice, indicating that Treg cells dominantly protect against development of spontaneous autoimmunity without intrinsic expression of PD-1. The absence of PD-1 combined with partial FoxP3 insufficiency, however, led to generation of ex-FoxP3 T cells with proinflammatory properties and expansion of effector/memory T cells that contributed to the autoimmune destruction of target tissues. Altogether, the results suggest that PD-1 and FoxP3 work collaboratively in maintaining immune tolerance mostly through nonoverlapping pathways. Thus, PD-1 is modulating the activation threshold and maintaining the balance between regulatory and effector T cells, whereas FoxP3 is sufficient for dominant regulation through maintaining the integrity of the Treg function. We suggest that genetic or environmental factors that even moderately affect the expression of both PD-1 and FoxP3 can cause life-threatening autoimmune diseases by disrupting the T-cell homeostasis.

Keywords: PD-1; T lymphocytes; autoimmunity; immune tolerance; regulatory T cell.


Conflict of interest statement

The authors declare no conflict of interest.

Figures

Fig. 1.
Fig. 1.
PD-1–deficient FoxP3-GFPcre mice show lethal autoimmunity. (A) Survival curve of male GFPcreKI/Y PD-1 WT (n = 20), male GFPcreKI/Y PD-1 KO (n = 8), female GFPcreKI/WT PD-1 WT (n = 20), female GFPcreKI/WT PD-1 KO (n = 23), female GFPcreKI/KI PD-1 WT (n = 11), and female GFPcreKI/KI PD-1 KO (n = 6) mice. (B) H&E staining of tissues (magnification, 50× and 200×). (C) FACS analysis of pancreas of 3- to ∼10-wk-old FoxP3-GFPcreKI/Y PD-1 WT or PD-1 KO mice. (D) Appearance of SPL and LNs. (E) FACS analysis of splenocytes. Data are representative of 3 to ∼7 mice per group. Bars represent the means (±SEM). *P < 0.05, **P < 0.01, ***P < 0.001.
Fig. S1.
Fig. S1.
Schematic representation of reporter mice and lympho-proliferation of FoxP3-GFPcreKI/Y PD-1 KO mice. (A) Map of the FoxP3-GFPcre locus is shown. Filled boxes, exons; gray box, 3′UTR of Foxp3 gene; I, IRES. (B) Principle of Cre-Lox–mediated tdRFP. (C) The 3- to ∼11-wk-old male FoxP3-GFPcreKI/Y PD-1 WT or PD-1 KO mice were analyzed for serum lipase concentration (excluding the maximum and minimum values). (D) Total number of mononuclear cells in the pancreas, pancreatic LNs, SPL, and LNs of 3- to ∼10-wk-old FoxP3-GFPcreKI/Y PD-1 WT or PD-1 KO mice. (E) The number of CD4+ and CD8+ T cells from the pancreas and pancreatic LNs and the number of CD44+ in CD4+ or CD8+ T cells from the pancreatic LNs of mice are as in D. (F) The number of CD4+, CD8+, CD44+CD4+, CD44+CD8+, and FoxP3+(GFP+) T cells from the SPL of mice as in D. (G) LN cells were analyzed for the frequency and number of CD4+, CD8+, CD44+CD4+, CD44+CD8+, and FoxP3+ (GFP+) T cells and for the ratio of CD44+ (gated on CD4+ or CD8+ T cells) and FoxP3+ (GFP+) T cells of mice as in D. Data are representative of 3 to ∼7 mice per group and shown as the means (±SEM). *P < 0.05, **P < 0.01, ***P < 0.001.
Fig. 2.
Fig. 2.
Reduced expression of endogenous FoxP3 in FoxP3-GFPcre mice. (A) CD4+ cells from the SPL and LNs of 2- to ∼3-mo-old indicated mice were subjected for quantitative real-time PCR (qRT-PCR) for the expression levels of endogenous FoxP3. (B) Intracellular staining for FoxP3 gated on LN CD4+ T cells. (C) FACS analysis of CD25 and CTLA-4 expression from LN cells of 2-mo-old male WT or FoxP3-GFPcreKI/Y mice. Statistical analysis of CD25 MFI and CTLA-4 MFI from the SPL and LNs of each mouse in indicated genotype is shown. Data are representative of 3 to ∼4 mice per group. Bars represent the means (±SEM). *P < 0.05, **P < 0.01; ns, not significant.
Fig. S2.
Fig. S2.
CD25+ T cells are decreased in FoxP3-GFPcre mice. (A) FACS analysis of LN cells from 2- to ∼3-mo-old male WT or FoxP3-GFPcreKI/Y mice for expression of FoxP3, CD25, and CTLA-4 gated on CD4+ T cells. Numbers in plots indicate percentage of cells in each gate. (B) Statistical analysis of FoxP3+CD25hi frequency and cell number in CD4+ T cells (Left) and FoxP3+CTLA-4+ frequency and cell number in CD4+ T cells (Right) from the SPL and LNs of mice as in A. (C) Statistical analysis of CD25 MFI within CD25+GFP or CD25+GFP+ T cells from the SPL and LNs of female FoxP3-GFPcreKI/WT mice. Data are representative of 3 to ∼4 mice per group. Bars represent the means (±SEM). *P < 0.05, **P < 0.01, ***P < 0.001; ns, not significant.
Fig. 3.
Fig. 3.
PD-1–deficient Tregs efficiently rescue FoxP3-GFPKI/Y PD-1 KO mice from lethal autoimmunity. (A) Tregs (CD4+CD25+) were sorted from C57BL/6 PD-1 WT or PD-1 KO mice and injected into 3-d-old mice as indicated (GFPcreKI/Y PD-1 KO + WT-Treg: n = 9; GFPcreKI/Y PD-1 KO + PD-1 KO-Treg: n = 9). Mice that did not receive Treg cells (GFPcreKI/Y PD-1 WT: n = 6; GFPcreKI/Y PD-1 KO: n = 5) served as controls. (B) H&E staining of the pancreas from the mice in A. (C) The FACS analysis of the SPL from 12- to ∼16-wk-old mice in A. (B and C) Note that the data from untreated GFPcreKI/Y PD-1 KO are collected at 3- to ∼10-wk-old due to early death in this group. Data are representative of 4 to ∼6 mice per group. Bars represent the means (±SEM). *P < 0.05, **P < 0.01; ns, not significant.
Fig. S3.
Fig. S3.
PD-1–deficient Treg cells showed increased CTLA-4 expression and suppressive activity in vivo. (A) The number of CD4+, CD8+, CD44+CD4+, and CD44+CD8+ T cells in LNs from indicated mice as in Fig. 3C. (B) FACS analysis of FoxP3 and CTLA-4 expression gated on CD4+ T cells from the SPL and LNs of 2-mo-old PD-1 WT or PD-1 KO mice on the C57BL/6 background. Numbers in plots indicate percentage of cells in each gate. Data are representative of 3 to ∼6 mice per group. Bars represent the means (±SEM). *P < 0.05, **P < 0.01, ***P < 0.001; ns, not significant.
Fig. 4.
Fig. 4.
The increase of ex-FoxP3 T cells in female FoxP3-GFPcreKI/WT PD-1 KO mice. (A) GFP and RFP expression from SPL of 4- to ∼8-wk-old FoxP3-GFPcreKI/WT Rosa-RFP PD-1 KO mice. (B) Percentage of GFPRFP+ (ex-FoxP3) T cells within RFP+ T cells (Treg plus ex-FoxP3) of CD4+ T cells or CD4CD8+ thymocytes (Thy). (C) The same number of naïve, GFP+RFP+, and GFPRFP+ of CD4+ T cells was sorted from mice in A and stimulated with phorbol 12-myristate 13-acetate (PMA) and ionomycin; the level of cytokine was measured. Data are shown from 3 to ∼6 mice per group. Bars represent the means (±SEM). *P < 0.05, **P < 0.01, ***P < 0.001,.
Fig. 5.
Fig. 5.
ex-FoxP3 T cells in autoimmune FoxP3-GFPcreKI/Y PD-1 KO mice. (A) FACS analysis of Tregs, ex-FoxP3 T cells, and CD25+ T cells from the SPL of 2-wk-old male FoxP3-GFPcreKI/Y PD-1 KO mice. (B) Statistical analysis of the ex-FoxP3 (GFP-RFP+) cells within RFP+ T cells in A. (C) FACS analysis of SPL cells from 3- to ∼7-wk-old male FoxP3-GFPcreKI/Y Rosa-RFP PD-1 KO mice. Data are from 3 to ∼6 mice per group. Bars represent the means (±SEM). *P < 0.05, **P < 0.01.
Fig. 6.
Fig. 6.
ex-FoxP3 T cells contain autoreactive cells with pathogenic potential. (A) CD8+, ex-FoxP3, or the combination of CD8+ and ex-FoxP3 (1:1) T cells from pancreatic LNs and the pancreas of FoxP3-GFPcreKI/Y Rosa-RFP PD-1 KO mice were transferred into Rag-2 KO mice (SI Materials and Methods). Body weight was monitored for 4 wk. The data are shown as a ratio of weight before injection. Statistical analysis was performed at 4 wk. (B) large intestine of the recipients at 4 wk. (C) H&E staining of the large intestine and pancreas of mice in B (magnification, 50× and 200×). Representative data of 3 to ∼4 mice per each group are shown. Bars represent the means (± SD). *P < 0.05, ***P < 0.001.
Fig. S4.
Fig. S4.
PD-1–deficient CD8 and ex-FoxP3 transferred Rag-2 KO mice. (A) Before transfer, CD8+ and ex-FoxP3 T cells as in Fig. 6A were resorted and analyzed for FACS. (B) FACS analysis of CD8 and ex-FoxP3 expression in the SPL, LNs, and pancreatic LNs of Rag-2 KO mice 4 wk after transfer of each indicated cell. (C) The absolute number of ex-FoxP3 T cells in the SPL, LNs, and pancreatic LNs of mice as in B. Numbers in plots indicate percentage of cells in each gate. Representative data of 3 to ∼4 mice for each group are shown. Bars represent the means (±SEM). *P < 0.05, **P < 0.01.
Fig. S5.
Fig. S5.
Proinflamatoy activities of PD-1–deficient CD44+RFP T cells in Rag-2 KO mice. (A) CD8+ and CD44+RFPGFPCD4+ (CD44+RFP) T cells were sorted from pancreatic LNs and the pancreas of male FoxP3-GFPcreKI/Y Rosa-RFP PD-1 KO mice and expanded in vitro by CD3/CD28 beads in the presence of IL-2 for 10 d; each group of cells was resorted and CD44+RFP or the combination of CD8+ and CD44+RFP (1:1) T cells were respectively transferred into Rag-2 KO mice. Body weight was monitored during the 3 to ∼4 wk for each group of mice. The mean weight is shown as a ratio of weight before injection. Statistical analysis was performed between each group after 3 wk of injection. (B) Picture of large intestine of Rag-2 KO mice transferred with indicated cells for 3 or 4 wk. (C) H&E staining of the large intestine and pancreas of mice as in B (magnification, 50×, 200×, and 400×). Mitosis in crypt is marked by a red circle. Representative data of 3 to ∼4 mice for each group are shown. Data are shown as the means (±SD). *P < 0.05.

Similar articles

Cited by

References

    1. Wu Y, et al. FOXP3 controls regulatory T cell function through cooperation with NFAT. Cell. 2006;126(2):375–387. - PubMed
    1. Ono M, et al. Foxp3 controls regulatory T-cell function by interacting with AML1/Runx1. Nature. 2007;446(7136):685–689. - PubMed
    1. Wing K, et al. CTLA-4 control over Foxp3+ regulatory T cell function. Science. 2008;322(5899):271–275. - PubMed
    1. Rudd CE, Taylor A, Schneider H. CD28 and CTLA-4 coreceptor expression and signal transduction. Immunol Rev. 2009;229(1):12–26. - PMC - PubMed
    1. Gough SC, Walker LS, Sansom DM. CTLA4 gene polymorphism and autoimmunity. Immunol Rev. 2005;204:102–115. - PubMed

Publication types

MeSH terms

Substances