. 2016 Jul 13;11(7):e0158936.
doi: 10.1371/journal.pone.0158936. eCollection 2016.

LHP1 Regulates H3K27me3 Spreading and Shapes the Three-Dimensional Conformation of the Arabidopsis Genome

Affiliations

LHP1 Regulates H3K27me3 Spreading and Shapes the Three-Dimensional Conformation of the Arabidopsis Genome

Alaguraj Veluchamy et al. PLoS One. .

Abstract

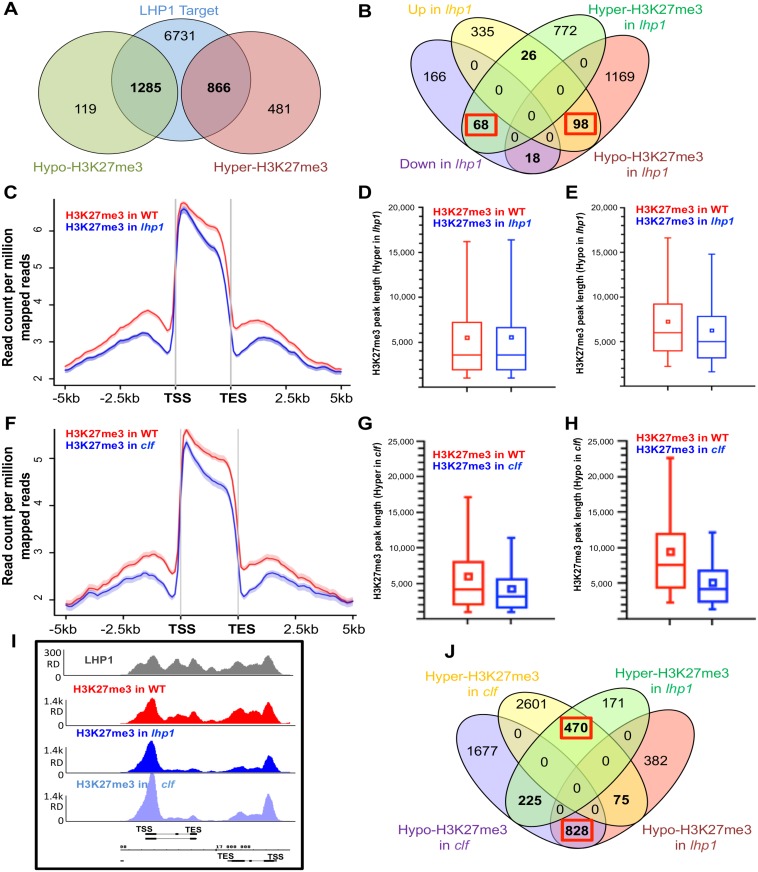
Precise expression patterns of genes in time and space are essential for proper development of multicellular organisms. Dynamic chromatin conformation and spatial organization of the genome constitute a major step in this regulation to modulate developmental outputs. Polycomb repressive complexes (PRCs) mediate stable or flexible gene repression in response to internal and environmental cues. In Arabidopsis thaliana, LHP1 co-localizes with H3K27me3 epigenetic marks throughout the genome and interacts with PRC1 and PRC2 members as well as with a long noncoding RNA. Here, we show that LHP1 is responsible for the spreading of H3K27me3 towards the 3' end of the gene body. We also identified a subset of LHP1-activated genes and demonstrated that LHP1 shapes local chromatin topology in order to control transcriptional co-regulation. Our work reveals a general role of LHP1 from local to higher conformation levels of chromatin configuration to determine its accessibility to define gene expression patterns.


Conflict of interest statement

Competing Interests: The authors have declared that no competing interests exist.

Figures

Fig 1
Fig 1. LHP1 occupancy across the Arabidopsis genome.
(A) Correlation between the genome-wide distribution of H3K27me3, RNA Pol II and LHP1. Tag density distribution of LHP1 in WT along with H3K27me3 and RNA Pol II across the genes with 2kb flank, as indicated in the scheme below de graph, gene in grey, flanking regions as black lines. Regions are clustered using K-means linear clustering according to tag density profiles. Density profiles were generated using density array method in seqMINER. Darker red indicates higher density of reads. On the Y-axis there is the list of all genes in TAIR10 annotation. Ten clusters are shown here, revealing the co-occupancy of LHP1 and H3K27me3 and a negative relationship between LHP1 and RNA Pol II. (B) Density plot showing overlap of LHP1 and RNA Pol II using Hexagonal binning routine. As large number of data points may overlap, Hexagonal binning gives additional dimension of differentiation of overlapping points based on count. Each point represents the distance of midpoint of peak to nearest gene. On the Y-axis is location of midpoint of LHP1 peak in comparison to gene position; X-axis is location of midpoint of RNA Pol II in comparison to mid-point of gene. This reveals peaks of RNA Pol II and LHP1 do not co-occur physically in the genome. (C) Hexagonal binning plot showing the association of LHP1 peak region to that of H3K27me3. Each point represents the distance of midpoint of peak to nearest gene. Most of the peaks overlap on the coding region. Large number of points occurs along the positive correlation line, showing the co-occurrence pattern of LHP1 and H3K27me3. (D) Average ChIP-seq enrichment profiles plot of H3K27me3 and LHP1 in WT, stratified by gene length. Normalization of coverage using spline algorithm was performed over the genes and flanking 2 kb region. (E) Average enrichment profile of LHP1 is correlated with gene expression variations. Gene expression is categorized from low (first quantile) to high expression (fourth quantile). Mean-normalized ChIP-Seq densities of equal bins along the gene and 2-kb region flanking the TSS or the TES were plotted. Highly expressed genes show lower enrichment for binding of LHP1. (F) Boxplot showing the comparison of expression levels in RPKM of LHP1-targeted genes and non-targeted genes in WT. LHP1 targeted genes show lower expression levels. (*) represents Mann–Whitney–Wilcoxon test between LHP1 target and non-target with a p-value < 2.2e-16.
Fig 2
Fig 2. Relationship between the level of LHP1 binding and the magnitude of gene expression.
(A) Heatmap showing fold change of expression level of LHP1-targeted and LHP1 unmarked genes in the lhp1 mutant compared to WT (Genes with a log2 fold change of -1 or lower are coloured in green and genes with a log2 fold change of +1 or above are coloured in red). Only genes which are mis-regulated in lhp1 are shown here. LHP1-targeted genes are predominantly up-regulated in the mutant lhp1. (B) Venn diagram showing the relationship of LHP1-targeted genes to gene expression. A higher number of LHP1-targeted genes are up-regulated in the mutant lhp1, compared to non-target genes. (C) Functional annotation of LHP1 targets which are up-regulated in the lhp1mutant (UT). (D) Average tag density profile of LHP1 on targeted and differentially regulated genes. Mean-normalized ChIP-Seq densities of equal bins along the gene and 2-kb region flanking the TSS or the TES were plotted. Up and down regulated genes are categorized with a p-value cutoff of 0.05 and fold change of one.
Fig 3
Fig 3. H3K27me3 spreading is affected in the lhp1 and clf mutants.
(A) Venn diagram showing differential marking of H3K27me3 deposition and LHP1 binding. Hyper (Higher enrichment) and Hypo-H3K27me3 (lower enrichment) refers to differential marking of H3K27me3 in the lhp1 mutant compared to WT. (B) Venn diagram showing that Hyper-methylated (H3K27me3) genes are predominantly down-regulated in lhp1 and Hypo-H3K27me3 genes are up-regulated in lhp1, as highlighted by the red boxes. (C) H3K27me3 distribution pattern (tag density) over the CDS and flanking regions for WT and lhp1. Mean-normalized ChIP-Seq densities of equal bins along the gene and 5 kb region flanking the TSS or the TES were plotted. (D) Boxplot showing differential peak lengths of H3K27me3 in WT and lhp1 over Hyper-H3K27me3 region (Higher enrichment of H3K27me3 in lhp1, compared to WT). (E) Boxplot showing differential peak lengths of H3K27me3 in WT and lhp1 over Hypo-H3K27me3 region (Lower enrichment of H3K27me3 in lhp1, compared to WT). (F) H3K27me3 distribution pattern (tag density) over the CDS and flanking regions for WT and clf. Normalizaton of coverage densities of equal bins using spline algorithm was performed over the genes and flanking 5 kb region. (G) Boxplot showing differential peak lengths of H3K27me3 in clf and WT over Hyper-H3K27me3 region (Higher enrichment of H3K27me3 in clf, compared to WT). (H) Boxplot showing differential peak lengths of H3K27me3 in clf and WT over Hypo-H3K27me3 region (Lower enrichment of H3K27me3 in clf, compared to WT). (I) LHP1 binding andH3K27me3 deposition in WT, lhp1 and clf across two genes. Decreased level of H3K27me3 towards the 3’-end of both genes is observed in lhp1 and clf compared to WT. (J) Venn diagram showing differential H3K27me3 deposition in lhp1 and clf. A high overlapping of Hypo and Hyper-methylated genes can be observed between lhp1 and clf, as indicated in the red boxes.
Fig 4
Fig 4. Genome topology is globally altered in the lhp1 backgorund.
(A) 2D interaction map showing significant interactions in WT and lhp1. Highly significant interactions are marked as red dots in their corresponding boxes. The color scale represents log2 (interaction) values. Lower panel in red (marked “LHP1”) are peaks from the LHP1 WT ChIP-seq. The two LHP1 panels are identical as they correspond to LHP1 binding in WT. The second LHP1 panel is shown here to correlate this dataset with the Hi-C in the mutant. (B) A screenshot of zoomed 2D interaction map showing intra-chromosomal interaction and LHP1 binding region for Chromosome 1. Centromeric interactions in those regions are masked. WT specific interactions are marked as black dots and lhp1 specific interactions are marked as purple dots. The color scale represents the log2 (interaction), which is calculated against the background (taken as lhp1 mutant). Lower panel in black (marked “LHP1”) shows the peaks of LHP1 deposition in WT ChIP-seq. (C) 2D interaction map showing the loss of interaction in lhp1 when compared to the same region in WT (top panels). Lower panels show the loss of H3K27me3 in the same region. In red it is highlighted the region in WT where LHP1 and H3K27me3 co-occur, exhibiting interaction changes in lhp1 mutants, along with the loss of H3K27me3.
Fig 5
Fig 5. Global changes in chromatin interactions are observed in lhp1, impacting gene transcription.
(A) Gene pairs showing altered chromatin interactions and reduced levels of H3K27me3 in lhp1 compared to WT. (B) Hi-C interactions between the pair of gene loci PID and APOLO (chr2:14588900–14599067). Several interactions can be detected between these two loci in WT. These interactions are diminished and even lost (the one in dark blue) in the lhp1 mutant. (C) Genome browser screenshot showing gene pairs revealing loss of chromatin interactions and reduced levels of H3K27me3 in lhp1 compared to WT. For A to C, colors indicate different interactions (red to blue) in cis and in trans (not adjacent Hind III sites). (D) Expression level changes inl hp1 compared to WT of significantly interacting pairs of genes which are LHP1-targeted. Colors were attributed according to the fold-change (FC) observed in the expression level: genes with a log 2 fold change of 2 or above are coloured in red while genes with a log 2 fold change of -2 or lower are coloured in green and genes with a log 2 fold change between -2 and 2 are in black. Interacting pairs show similar transcriptional behavior in the lhp1 background.

Similar articles

Cited by

References

    1. Delest A, Sexton T, Cavalli G. Polycomb: a paradigm for genome organization from one to three dimensions. Curr Opin Cell Biol. 2012;24(3):405–14. 10.1016/j.ceb.2012.01.008 . - DOI - PubMed
    1. Mozgova I, Hennig L. The polycomb group protein regulatory network. Annu Rev Plant Biol. 2015;66:269–96. 10.1146/annurev-arplant-043014-115627 . - DOI - PubMed
    1. Lewis EB. A gene complex controlling segmentation in Drosophila. Nature. 1978;276(5688):565–70. . - PubMed
    1. Di Croce L, Helin K. Transcriptional regulation by Polycomb group proteins. Nat Struct Mol Biol. 2013;20(10):1147–55. 10.1038/nsmb.2669 . - DOI - PubMed
    1. Schwartz YB, Pirrotta V. A new world of Polycombs: unexpected partnerships and emerging functions. Nat Rev Genet. 2013;14(12):853–64. 10.1038/nrg3603 . - DOI - PubMed

MeSH terms