

MHC I Expression Regulates Co-clustering and Mobility of Interleukin-2 and -15 Receptors in T Cells
- PMID: 27410738
- PMCID: PMC4944762
- DOI: 10.1016/j.bpj.2016.05.044
MHC I Expression Regulates Co-clustering and Mobility of Interleukin-2 and -15 Receptors in T Cells
Abstract
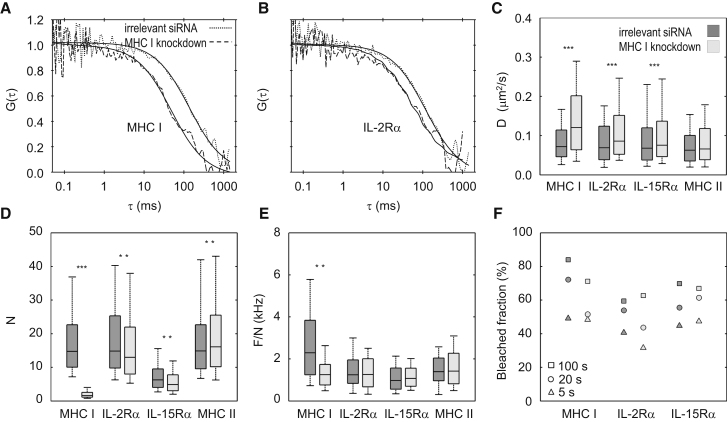
MHC glycoproteins form supramolecular clusters with interleukin-2 and -15 receptors in lipid rafts of T cells. The role of highly expressed MHC I in maintaining these clusters is unknown. We knocked down MHC I in FT7.10 human T cells, and studied protein clustering at two hierarchic levels: molecular aggregations and mobility by Förster resonance energy transfer and fluorescence correlation spectroscopy; and segregation into larger domains or superclusters by superresolution stimulated emission depletion microscopy. Fluorescence correlation spectroscopy-based molecular brightness analysis revealed that the studied molecules diffused as tight aggregates of several proteins of a kind. Knockdown reduced the number of MHC I containing molecular aggregates and their average MHC I content, and decreased the heteroassociation of MHC I with IL-2Rα/IL-15Rα. The mobility of not only MHC I but also that of IL-2Rα/IL-15Rα increased, corroborating the general size decrease of tight aggregates. A multifaceted analysis of stimulated emission depletion images revealed that the diameter of MHC I superclusters diminished from 400-600 to 200-300 nm, whereas those of IL-2Rα/IL-15Rα hardly changed. MHC I and IL-2Rα/IL-15Rα colocalized with GM1 ganglioside-rich lipid rafts, but MHC I clusters retracted to smaller subsets of GM1- and IL-2Rα/IL-15Rα-rich areas upon knockdown. Our results prove that changes in expression level may significantly alter the organization and mobility of interacting membrane proteins.
Copyright © 2016 Biophysical Society. All rights reserved.
Figures


Comment in
-
Complexity Revealed: A Hierarchy of Clustered Membrane Proteins.Biophys J. 2016 Jul 12;111(1):1-2. doi: 10.1016/j.bpj.2016.05.045. Biophys J. 2016. PMID: 27410727 Free PMC article. No abstract available.
Similar articles
-
IL-15 receptor α signaling constrains the development of IL-17-producing γδ T cells.Proc Natl Acad Sci U S A. 2015 Aug 4;112(31):9692-7. doi: 10.1073/pnas.1420741112. Epub 2015 Jul 20. Proc Natl Acad Sci U S A. 2015. PMID: 26195801 Free PMC article.
-
Membrane Potential Distinctly Modulates Mobility and Signaling of IL-2 and IL-15 Receptors in T Cells.Biophys J. 2018 May 22;114(10):2473-2482. doi: 10.1016/j.bpj.2018.04.038. Epub 2018 May 10. Biophys J. 2018. PMID: 29754714 Free PMC article.
-
Cholesterol-dependent clustering of IL-2Ralpha and its colocalization with HLA and CD48 on T lymphoma cells suggest their functional association with lipid rafts.Proc Natl Acad Sci U S A. 2000 May 23;97(11):6013-8. doi: 10.1073/pnas.97.11.6013. Proc Natl Acad Sci U S A. 2000. PMID: 10823948 Free PMC article.
-
Increasing the biological activity of IL-2 and IL-15 through complexing with anti-IL-2 mAbs and IL-15Rα-Fc chimera.Immunol Lett. 2014 May-Jun;159(1-2):1-10. doi: 10.1016/j.imlet.2014.01.017. Epub 2014 Feb 7. Immunol Lett. 2014. PMID: 24512738 Review.
-
From anabolic to oxidative: reconsidering the roles of IL-15 and IL-15Rα in skeletal muscle.Exerc Sport Sci Rev. 2013 Apr;41(2):100-6. doi: 10.1097/JES.0b013e318275d230. Exerc Sport Sci Rev. 2013. PMID: 23072822 Free PMC article. Review.
Cited by
-
A two-hybrid antibody micropattern assay reveals specific in cis interactions of MHC I heavy chains at the cell surface.Elife. 2018 Sep 5;7:e34150. doi: 10.7554/eLife.34150. Elife. 2018. PMID: 30180933 Free PMC article.
-
Thermogenic Activation Downregulates High Mitophagy Rate in Human Masked and Mature Beige Adipocytes.Int J Mol Sci. 2020 Sep 10;21(18):6640. doi: 10.3390/ijms21186640. Int J Mol Sci. 2020. PMID: 32927882 Free PMC article.
-
IL-2 receptors preassemble and signal in the ER/Golgi causing resistance to antiproliferative anti-IL-2Rα therapies.Proc Natl Acad Sci U S A. 2019 Oct 15;116(42):21120-21130. doi: 10.1073/pnas.1901382116. Epub 2019 Sep 30. Proc Natl Acad Sci U S A. 2019. PMID: 31570576 Free PMC article.
-
Open MHC Class I Conformers: A Look through the Looking Glass.Int J Mol Sci. 2021 Sep 8;22(18):9738. doi: 10.3390/ijms22189738. Int J Mol Sci. 2021. PMID: 34575902 Free PMC article. Review.
-
Role of C-Terminal Domain and Membrane Potential in the Mobility of Kv1.3 Channels in Immune Synapse Forming T Cells.Int J Mol Sci. 2022 Mar 18;23(6):3313. doi: 10.3390/ijms23063313. Int J Mol Sci. 2022. PMID: 35328733 Free PMC article.
References
-
- Bodnár A., Nizsalóczki E., Vámosi G. A biophysical approach to IL-2 and IL-15 receptor function: localization, conformation and interactions. Immunol. Lett. 2008;116:117–125. - PubMed
-
- Brodsky F.M., Guagliardi L.E. The cell biology of antigen processing and presentation. Annu. Rev. Immunol. 1991;9:707–744. - PubMed
-
- Bene L., Balázs M., Damjanovich S. Lateral organization of the ICAM-1 molecule at the surface of human lymphoblasts: a possible model for its co-distribution with the IL-2 receptor, class I and class II HLA molecules. Eur. J. Immunol. 1994;24:2115–2123. - PubMed
MeSH terms
Substances
LinkOut - more resources
Full Text Sources
Other Literature Sources
Research Materials
