

Urinary Incontinence as a Predictor of Death: A Systematic Review and Meta-Analysis
- PMID: 27410965
- PMCID: PMC4943733
- DOI: 10.1371/journal.pone.0158992
Urinary Incontinence as a Predictor of Death: A Systematic Review and Meta-Analysis
Abstract
Background: The association between urinary incontinence (UI) and increased mortality remains controversial. The objective of our study was to evaluate if this association exists.
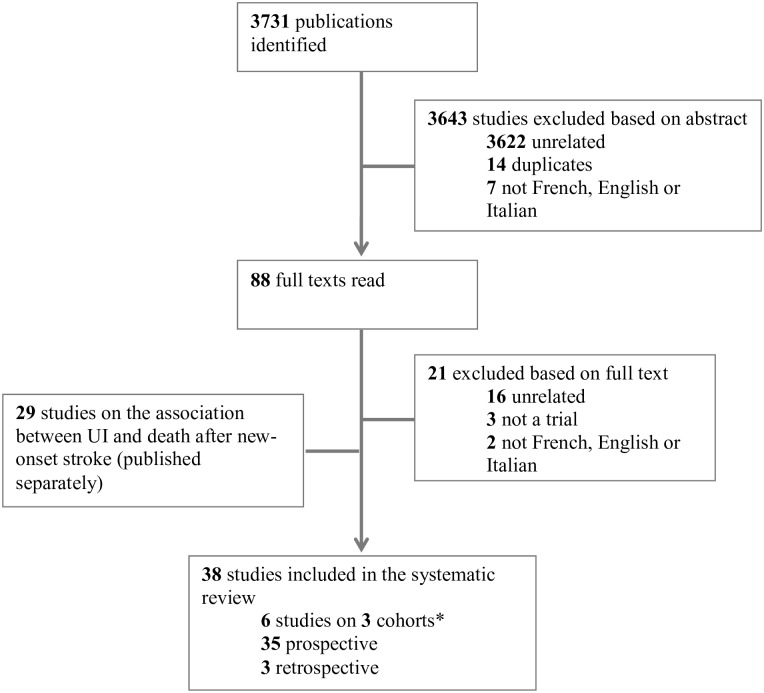
Methods: We performed a systematic review and meta-analysis of observational studies comparing death rates among patients suffering from UI to those without incontinence. We searched in Medline, Embase and the Cochrane library using specific keywords. Studies exploring the post-stroke period were excluded. Hazard ratios (HR) were pooled using models with random effects. We stratified UI by gender and by UI severity and pooled all models with adjustment for confounding variables.
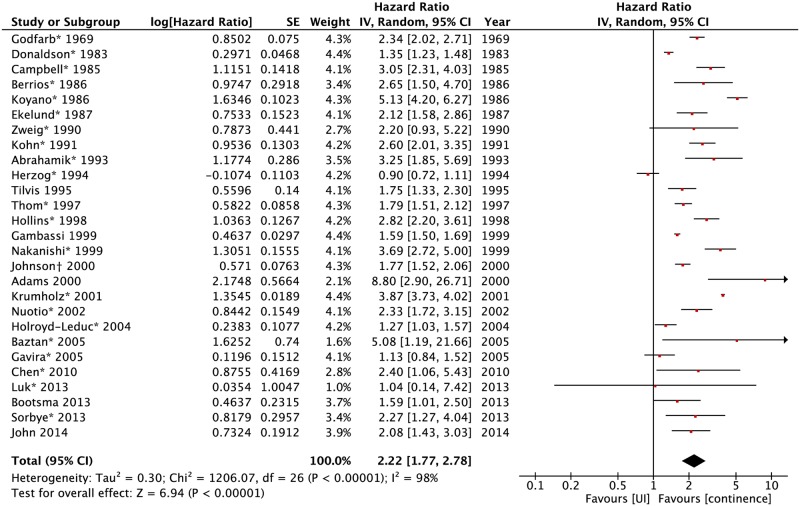
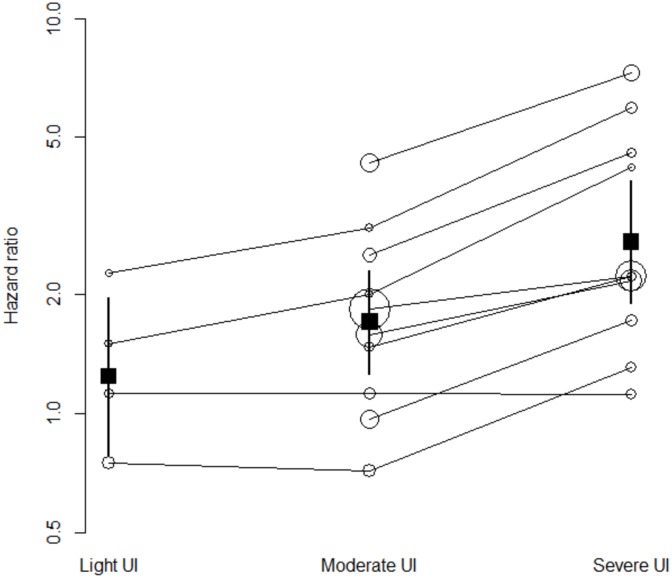
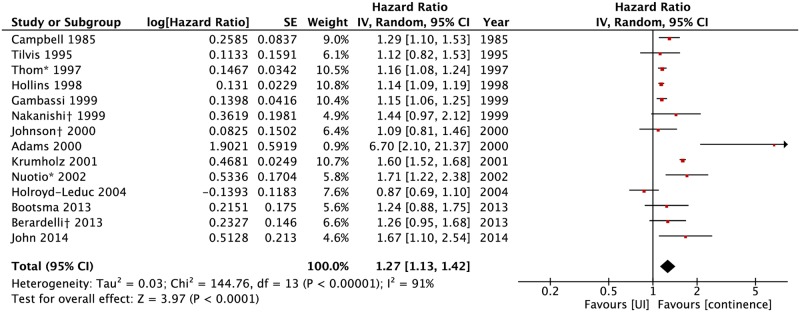
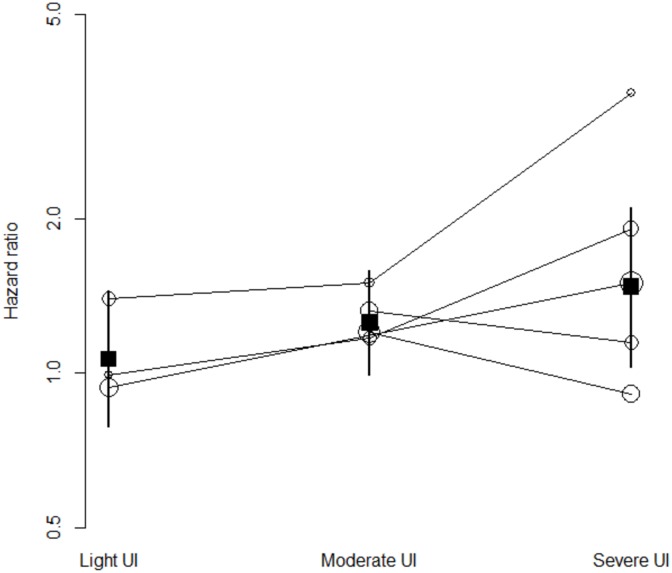
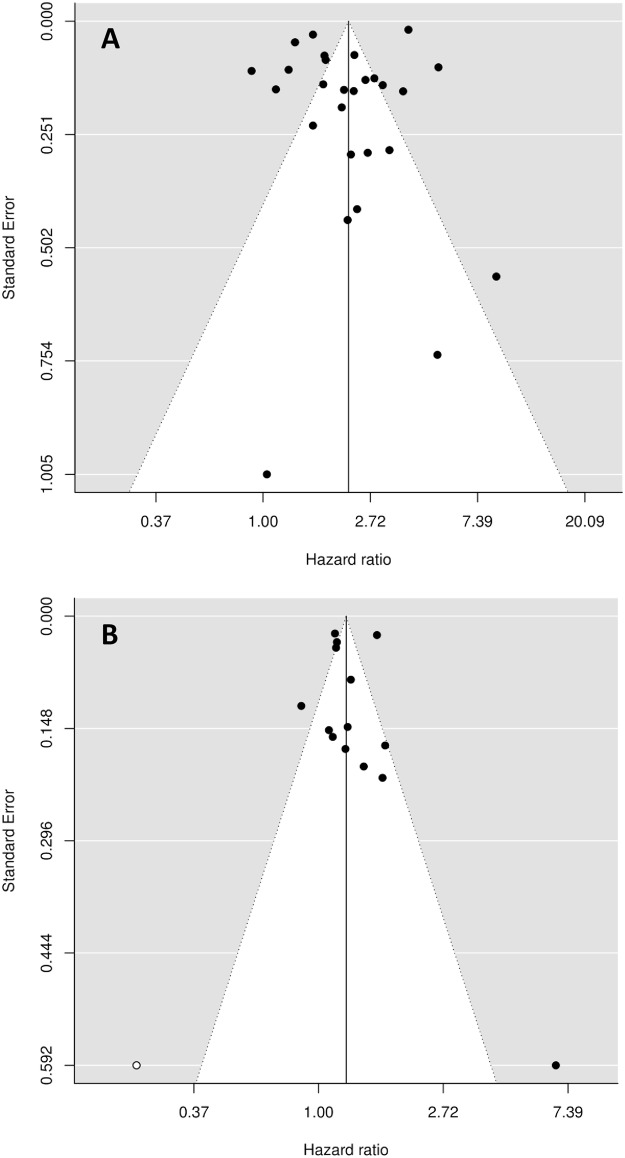
Results: Thirty-eight studies were retrieved. When compared to non-urinary incontinent participants, UI was associated with an increase in mortality with pooled non adjusted HR of 2.22 (95%CI 1.77-2.78). The risk increased with UI severity: 1.24 (95%CI: 0.79-1.97) for light, 1.71 (95%CI: 1.26-2.31) for moderate, and 2.72 (95%CI: 1.90-3.87) for severe UI respectively. When pooling adjusted measures of association, the resulting HR was 1.27 (95%CI: 1.13-1.42) and increased progressively for light, moderate and severe UI: 1.07 (95%CI: 0.79-1.44), 1.25 (95%CI: 0.99-1.58), and 1.47 (95%CI: 1.03-2.10) respectively. There was no difference between genders.
Conclusion: UI is a predictor of higher mortality in the general and particularly in the geriatric population. The association increases with the severity of UI and persists when pooling models adjusted for confounders. It is unclear if this association is causative or just reflects an impaired general health condition. As in most meta-analyses of observational studies, methodological issues should be considered when interpreting results.
Conflict of interest statement
Figures
References
-
- Abrams P, Cardozo L, Fall M, Griffiths D, Rosier P, Ulmsten U, et al. The standardisation of terminology of lower urinary tract function: report from the Standardisation Sub-committee of the International Continence Society. Am J Obstet Gynecol 2002;187(1):116–26. - PubMed
-
- Bedretdinova D, Fritel X, Panjo H, Ringa V. Prevalence of Female Urinary Incontinence in the General Population According to Different Definitions and Study Designs. Eur Urol 2015. - PubMed
-
- Jerez-Roig J, Santos MM, Souza DL, Amaral FL, Lima KC. Prevalence of urinary incontinence and associated factors in nursing home residents. Neurourol Urodyn 2014. - PubMed
-
- Thom DH, Haan MN, Van Den Eeden SK. Medically recognized urinary incontinence and risks of hospitalization, nursing home admission and mortality. Age Ageing 1997;26(5):367–74. - PubMed
Publication types
MeSH terms
LinkOut - more resources
Full Text Sources
Other Literature Sources
Medical
