. 2016 Jul 12;24(1):104-17.
doi: 10.1016/j.cmet.2016.06.007.

Mitochondrial Biogenesis and Proteome Remodeling Promote One-Carbon Metabolism for T Cell Activation

Affiliations

Mitochondrial Biogenesis and Proteome Remodeling Promote One-Carbon Metabolism for T Cell Activation

Noga Ron-Harel et al. Cell Metab. .

Abstract

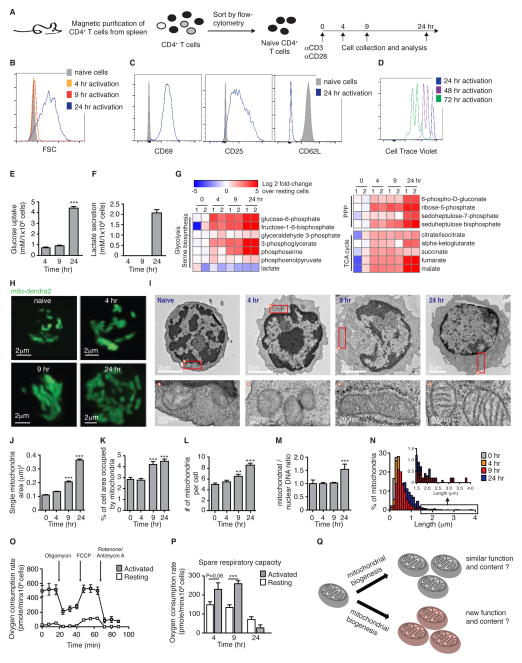
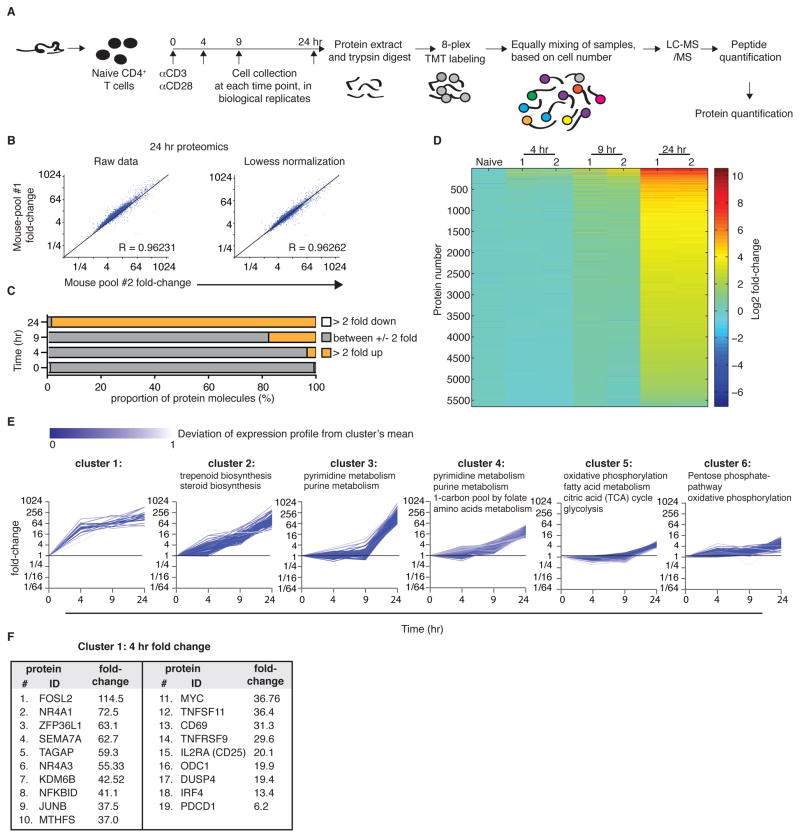
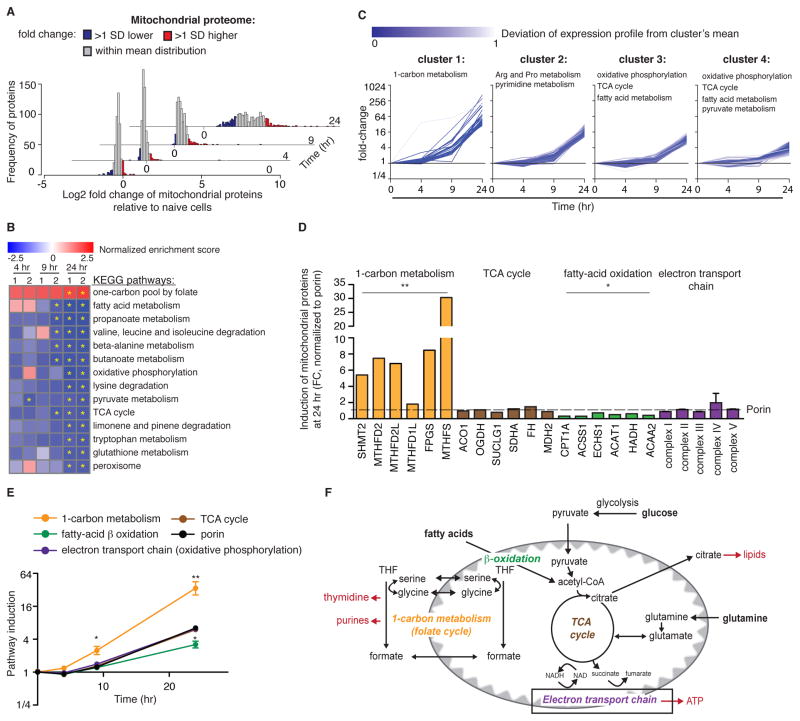
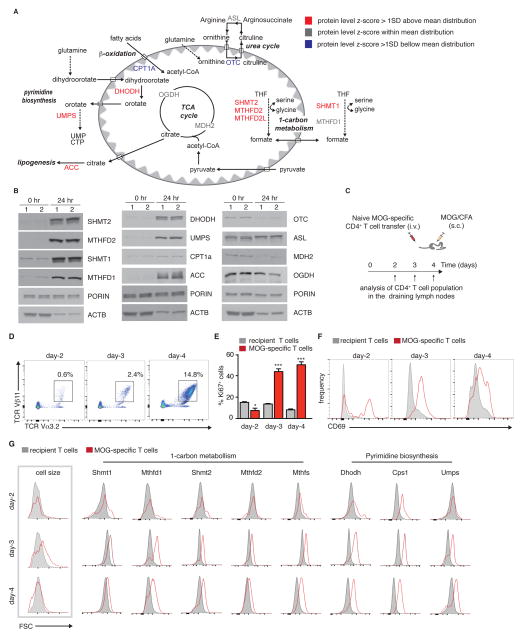
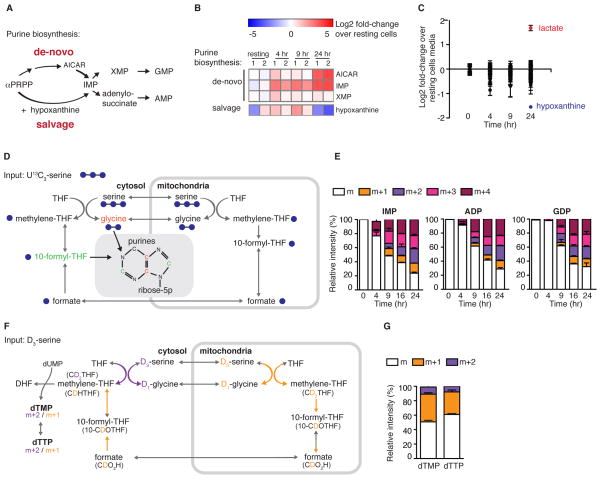
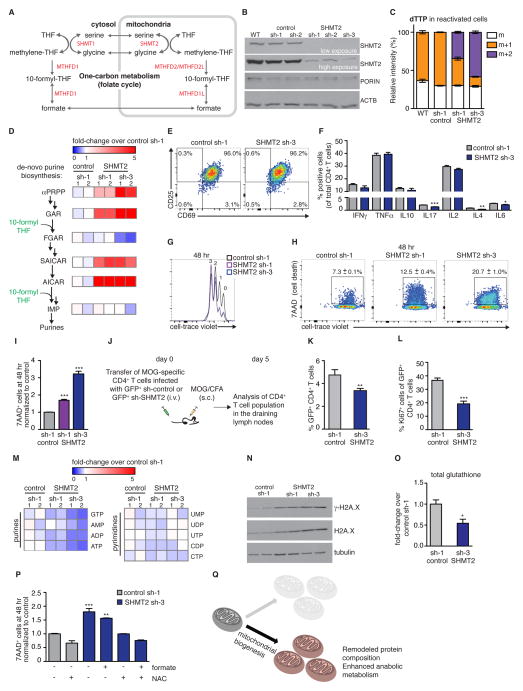
Naive T cell stimulation activates anabolic metabolism to fuel the transition from quiescence to growth and proliferation. Here we show that naive CD4(+) T cell activation induces a unique program of mitochondrial biogenesis and remodeling. Using mass spectrometry, we quantified protein dynamics during T cell activation. We identified substantial remodeling of the mitochondrial proteome over the first 24 hr of T cell activation to generate mitochondria with a distinct metabolic signature, with one-carbon metabolism as the most induced pathway. Salvage pathways and mitochondrial one-carbon metabolism, fed by serine, contribute to purine and thymidine synthesis to enable T cell proliferation and survival. Genetic inhibition of the mitochondrial serine catabolic enzyme SHMT2 impaired T cell survival in culture and antigen-specific T cell abundance in vivo. Thus, during T cell activation, mitochondrial proteome remodeling generates specialized mitochondria with enhanced one-carbon metabolism that is critical for T cell activation and survival.


Figures

Figure 1
Figure 1. Activation of naïve CD4+ T cell initiates a synchronized program of mitochondrial biogenesis and bioenergetics
(A) Scheme of experimental design. Purified naïve CD4+ T cells were activated, and harvested at 0, 4, 9 and 24 hr post-activation as indicated. Representative flow-cytometry plots (from >5 individual experiments) demonstrate: (B) activation-induced growth in cell size, (C) up-regulation of CD69 and CD25, and down regulation of the L-selectin CD62L. (D) Representative FACS histograms demonstrating cell proliferation (detected by dilution of Cell Trace Violet) occurring at 48 and 72 hr post-activation. (E) Glucose uptake, and (F) lactate secretion were measured by analyzing the growth media of CD4+ T cells purified and activated as described in Figure 1A (n=4 pools of 4 mice each). (G) Kinetic changes in metabolite levels in activated vs. naïve CD4+ T cells. (H) Representative 3D reconstructions of Z-stacks taken by live-cell imaging of activated CD4+ T cells from PHAMexcised mice. (I) Representative EM micrographs of naive CD4+ T cells at 0, 4, 9 and 24 hr post-activation (scale bar = 2 μm). Rectangle indicates region represented in lower panels, with a scale bar of 200 nm. Asterisk indicates orientation of panel. (J–L) Quantitation of the EM micrographs (n=30 images per sample, 4–5 samples time point) showed changes over time in single mitochondrial area (J), the % of cell area occupied by the mitochondria (K) and the number of mitochondria per cell (L). (M) qPCR analysis of mitochondrial (Cox-I) vs. nuclear (Rp18s) DNA content (n=4 pools of 4 mice). (N) Quantitation of mitochondrial length in EM micrographs. (O) Oxygen consumption rate in resting versus activated (24 hr) T cells. (P) Spare respiratory capacity calculated based on the changes in oxygen consumption rates (n=5 pools of 2 mice each). All results are mean ± SEM of 2–3 individual experiments. **p<0.01, ***p<0.001. (Q) A schematic illustrating potential roles of mitochondrial biogenesis to: 1) increase mitochondria with a similar function or 2) to generate a new population of specialized mitochondria.
Figure 2
Figure 2. Quantitative proteomics identifies differential induction of metabolic pathways during activation of naïve CD4+ T cells
(A) Experimental scheme. Naïve CD4+ T cells were purified from two separate pools of mice, activated using plate-bound anti-CD3/anti-CD28, collected, and processed by protein extraction and digestion. The peptide pool from each of the 8 samples was labeled with a specific TMT label. Pools were equally mixed, based on cell numbers and analyzed by LC-MS/MS, to quantify proteins. (B) Scatter plots showing the biological replicates at 24 hr are well correlated. (C) Graph demonstrating the overall induction in protein content during T cell activation. Values are the average of the two biological replicates at each time. (D) Heatmap showing the kinetics of changes in CD4+ T cell proteomics following activation. (E) 6 Representative clusters (see Figure S2 for clusters 7–12) of proteins that share similar expression kinetics during T cell activation. KEGG pathway analysis identified the specific metabolic pathways enriched within each cluster. (F) A list of the proteins in cluster 1, representing the proteins with the greatest induction at 4 hr.
Figure 3
Figure 3. Mitochondrial protein composition is changed with T cell activation
(A) Kinetic distribution of mitochondrial proteome induction following CD4+ T cell activation. Color codes show in blue: proteins induced more than one standard deviation below mean distribution, in red: proteins induced more than one standard deviation above mean distribution, and in grey: proteins induced within mean distribution. Values are the average of the two biological replicates at each time. (B) GSEA analysis of the mitochondrial proteome indicating in blue, pathways that were significantly downregulated by 24 hr post-activation, and in red: pathways that were significantly upregulated by 24 hr post-activation. Analysis was performed on the full list of mitochondrial proteins, pre-ranked based on their fold-change induction compared to naïve T cells. Yellow asterisk indicates P<0.05. (C) The mitochondrial proteome was segregated into 4 clusters based on protein level kinetics following T cell activation. KEGG pathway analysis identified the specific metabolic pathways enriched within each cluster. (D) Fold-change induction of individual proteins in pathways of one carbon metabolism, TCA cycle, fatty acid oxidation 24 hr post-activation. Electron transport chain complexes are shown as the average level of individual subunits within each complex. Values are the average of two biological replicates, normalized to porin (E) Average induction of mitochondrial metabolic pathways from panel D compared to porin. (F) Schematic of central metabolic pathways in the mitochondria. Results are mean ± SEM. *p<0.05, **p<0.01 (Student’s t-test comparing each of the metabolic pathways to porin).
Figure 4
Figure 4. Enzymes involved in one carbon metabolism and pyrimidine biosynthesis are induced in vivo in antigen specific T cells
(A) Schematic showing central metabolic pathways in the mitochondria, listing representative enzymes, color-coded based on their fold-change at 24 hr post-activation. In blue: proteins induced more than one standard deviation below mean distribution, in red: proteins induced more than one standard deviation above mean distribution, and in grey: proteins induced within mean distribution. (B) Protein quantitation by western blot of the enzymes listed in (A) using porin and β-actin as loading controls. (C) Experimental strategy. Naïve, MOG-specific CD4+ T cells were transferred into C57Bl/6 wild-type recipients, which were immunized with MOG35-55 peptide in CFA. Mice (n=4 per time point) were sacrificed at days 2, 3 and 4 following immunization for analysis of the T cells in the draining lymph nodes by flow cytometry. (D) Representative plots showing percentages of MOG-specific T cells TCRβ11/TCRα3.2 in the draining lymph nodes following immunization, and (E) percentages of proliferating 2D2 MOG-specific cells (Ki67+), compared to host CD4+ T cell population. *p<0.05, ***p<0.001 (Student’s t-test comparing wild-type and 2D2-specific T cells at each time point). (F) Representative plots showing the kinetics of CD69 expression on MOG-specific 2D2 T cells following immunization. (G) Representative plots showing changes in cell size (FSC), and expression of metabolic enzymes in MOG-specific 2D2 T cells following immunization by flow cytometry. N=4 mice per time point in each experiment. Experiments were performed 2–3 times. Results are mean ± SEM.
Figure 5
Figure 5. Mitochondrial one carbon metabolism is induced in CD4+ T cells upon activation, and contributes to de novo purine biosynthesis
(A) Schematic showing major metabolic pathways contributing to purine biosynthesis. αPRPP – phosphoribosyl pyrophosphate; AICAR-5-Aminoimidazole carboxamide ribonucleotide; IMP – inosine monophosphate; XMP-xanthosine monophosphate; GMP – guanosine monophosphate; AMP-adenosine monophosphate. (B) Heatmap showing Log2 fold-change of intermediates in purine biosynthetic pathways in activated compared to naïve T cells, measured by LC-MS. (C) Changes in culture media composition in cultures of naïve T cells and of T cells at 4, 9 and 24 hr post-activation, highlighting lactate secretion (red) and hypoxanthine consumption (blue). (D) Metabolic tracing strategy of the one carbon metabolic pathway using uniformly labeled 13C-serine, highlighting the incorporation of its products: glycine (13C2) and two molecules of 10-formyl-THF (13C1) into the purine ring, thru de-novo purine biosynthesis. Incorporation of one molecule of 13C 10-formyl-THF will give rise to a mass of m+1. m+2 is the result of incorporation of two molecules of 13C 10-formyl-THF or one labeled 13C2-glycine. m+3 indicates addition of one molecule of 13C 10-formyl-THF and one labeled 13C2-glycine, and m+4 is the result of addition of two 13C 10-formyl-THF molecules and one labeled 13C2-glycine. THF: tetrahydrofolate. (E) 13C labeling of representative purine molecules. (F) Metabolic tracing strategy using D3-serine, to differentiate flux thru the mitochondrial versus the cytosolic arm of one carbon metabolism by monitoring the labeling pattern of thymidylate. DHF: dihydrofolate. (G) Activated T cells produce predominantly the m+1 isotopomer of dTMP and dTTP, indicative of mitochondrial rather than cytosolic flux. All results are mean ± SEM.
Figure 6
Figure 6. Genetic inhibition of mitochondrial one carbon metabolism impairs T cell survival in vitro and in vivo
(A) Schematic of enzymes in mitochondrial and cytosolic one carbon metabolism. SHMT: Serine hydroxymethyltransferase; MTHFD: methylenetetrahydrofolate dehydrogenase; MTHFD1L: methylenetetrahydrofolate dehydrogenase 1-like. (B) Protein quantitation of SHMT2 in non-infected cells (WT) or cells infected with retrovirus containing individual shRNA sequences to target LacZ (control) or SHMT2. Resting CD4+ T cells infected with either sh-LacZ (control, sh-1) or sh-SHMT2 (sh-1, sh-3) were used for the following experiments (C–O): (C) Cells were reactivated in media containing D3-serine for 48 hr, and m+1 and m+2 dTTP isotopomer were analyzed by LC-MS. (D) Pathway on left indicates metabolites in de novo purine synthesis, 10-formyl THF (green) indicates addition of one carbon units. Double arrows indicate multiple enzyme steps. Heat map shows fold-change in metabolite in SHMT KD versus control LacZ sh cells (48 hr after reactivation). (E–I) Representative plots from control and SHMT2 knockdown T cells 48 hr after reactivation showing (E) activation markers (CD69 and CD25) (F) intracellular cytokine levels, (G) cell proliferation, and (H–I) survival (measured by 7-AAD incorporation). (J) Experimental strategy. Resting CD4+, MOG-specific 2D2 TCR transgenic T cells infected with retrovirus expressing GFP+ sh-control or GFP+ sh-SHMT2 were adoptively transferred into wild type C57BL/6 recipient mice that were immunized with MOG/CFA. 5 days post-immunization, the mice were sacrificed and the draining lymph nodes analyzed by FACS. (K) % GFP+ cells of total CD4+ T cells, in the draining lymph node. (L) % of proliferating cells (Ki67+) of infected (GFP+) CD4+ T cells. Experiment was performed two times with n=7 mice per group for each experiment. (M) Cells were reactivated for 48 hr as for panel D. Heatmap summarizes the levels of purines (left panel) and pyrimidines (right panel). (N) Protein quantitation of γ-H2A.X at 48 hr post reactivation. (O) Total glutathione levels at 48 hr post-reactivation, measured by LC-MS. (P) Cells were reactivated +/− formate (1 mM) and +/− NAC (7.5 mM) and analyzed for cell death (7-AAD+) by flow cytometry. (Q) Model: mitochondrial biogenesis in T cells gives rise to remodeled mitochondria with enhanced anabolic functions. **p<0.01, ***p<0.001 (Student’s t-test (F,K,L); One-Way ANOVA followed by Tukey’s multiple comparisons test (I,O), showing significant changes over sh-control cell (G). Results are mean ± SEM.

References

    1. Anderson DD, Quintero CM, Stover PJ. Identification of a de novo thymidylate biosynthesis pathway in mammalian mitochondria. Proceedings of the National Academy of Sciences of the United States of America. 2011;108:15163–15168. - PMC - PubMed
    1. Arnold CN, Pirie E, Dosenovic P, McInerney GM, Xia Y, Wang N, Li X, Siggs OM, Karlsson Hedestam GB, Beutler B. A forward genetic screen reveals roles for Nfkbid, Zeb1, and Ruvbl2 in humoral immunity. Proceedings of the National Academy of Sciences of the United States of America. 2012;109:12286–12293. - PMC - PubMed
    1. Berod L, Friedrich C, Nandan A, Freitag J, Hagemann S, Harmrolfs K, Sandouk A, Hesse C, Castro CN, Bahre H, et al. De novo fatty acid synthesis controls the fate between regulatory T and T helper 17 cells. Nature medicine. 2014;20:1327–1333. - PubMed
    1. Carr EL, Kelman A, Wu GS, Gopaul R, Senkevitch E, Aghvanyan A, Turay AM, Frauwirth KA. Glutamine uptake and metabolism are coordinately regulated by ERK/MAPK during T lymphocyte activation. Journal of immunology. 2010;185:1037–1044. - PMC - PubMed
    1. D’Souza AD, Parikh N, Kaech SM, Shadel GS. Convergence of multiple signaling pathways is required to coordinately up-regulate mtDNA and mitochondrial biogenesis during T cell activation. Mitochondrion. 2007;7:374–385. - PMC - PubMed

Publication types