. 2016 Jul 13;11(7):e0159001.
doi: 10.1371/journal.pone.0159001. eCollection 2016.

Preventing Data Ambiguity in Infectious Diseases with Four-Dimensional and Personalized Evaluations

Affiliations

Preventing Data Ambiguity in Infectious Diseases with Four-Dimensional and Personalized Evaluations

Michelle J Iandiorio et al. PLoS One. .

Abstract

Background: Diagnostic errors can occur, in infectious diseases, when anti-microbial immune responses involve several temporal scales. When responses span from nanosecond to week and larger temporal scales, any pre-selected temporal scale is likely to miss some (faster or slower) responses. Hoping to prevent diagnostic errors, a pilot study was conducted to evaluate a four-dimensional (4D) method that captures the complexity and dynamics of infectious diseases.

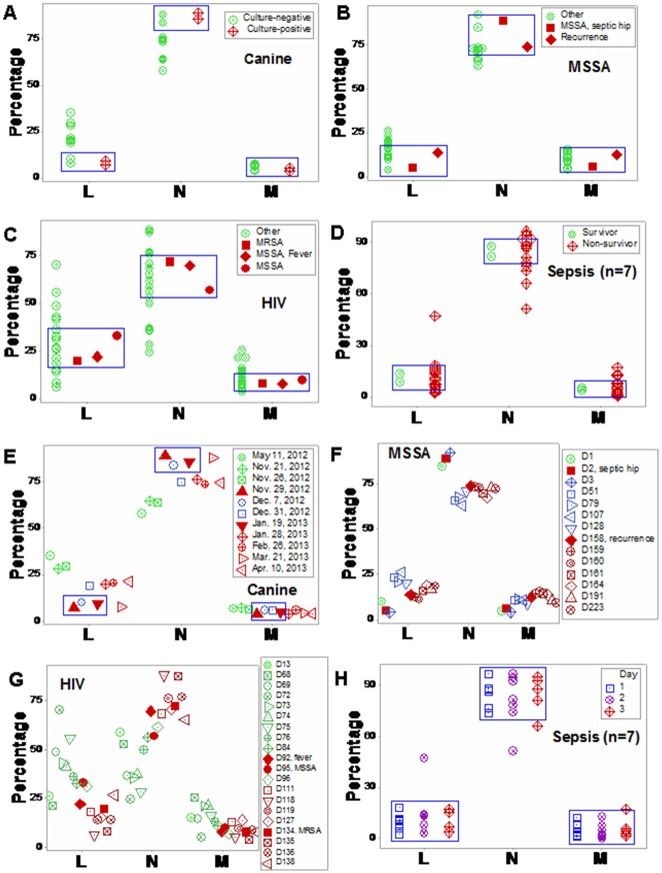
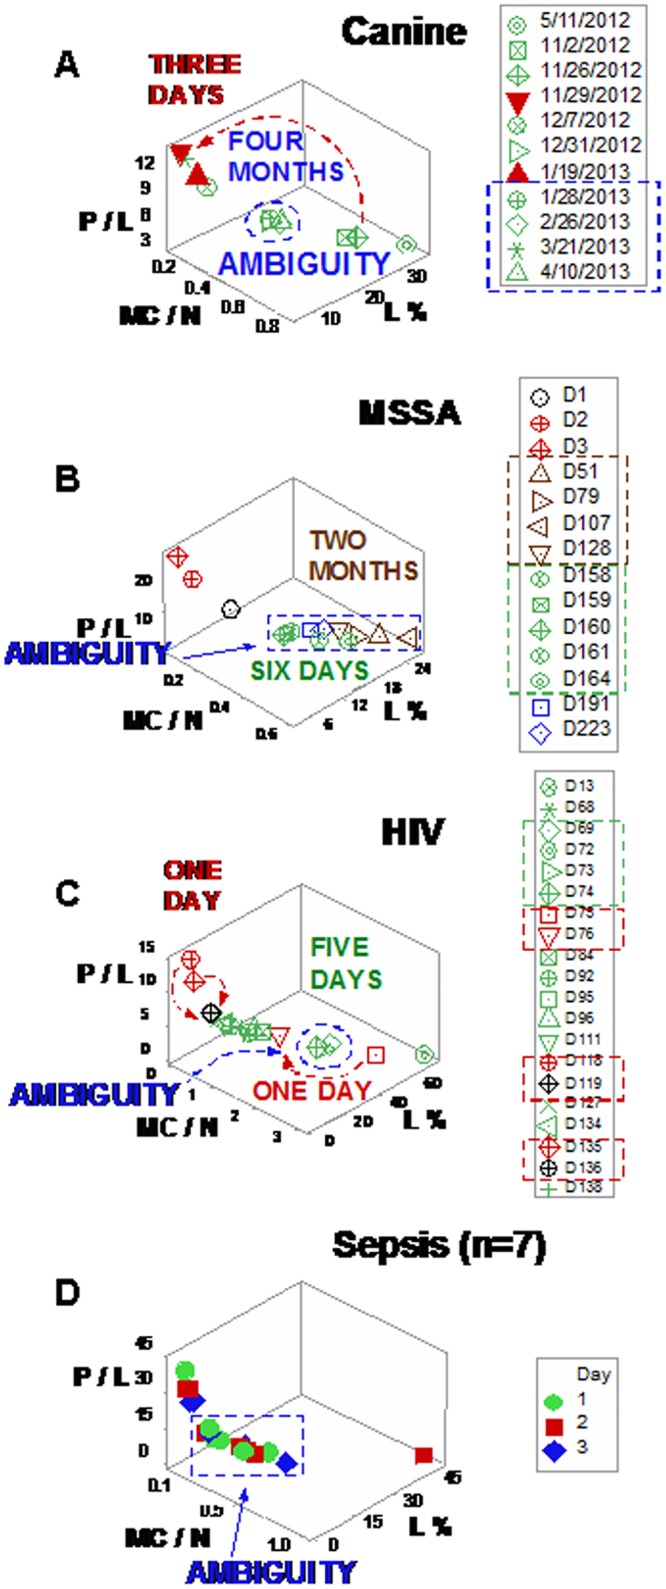
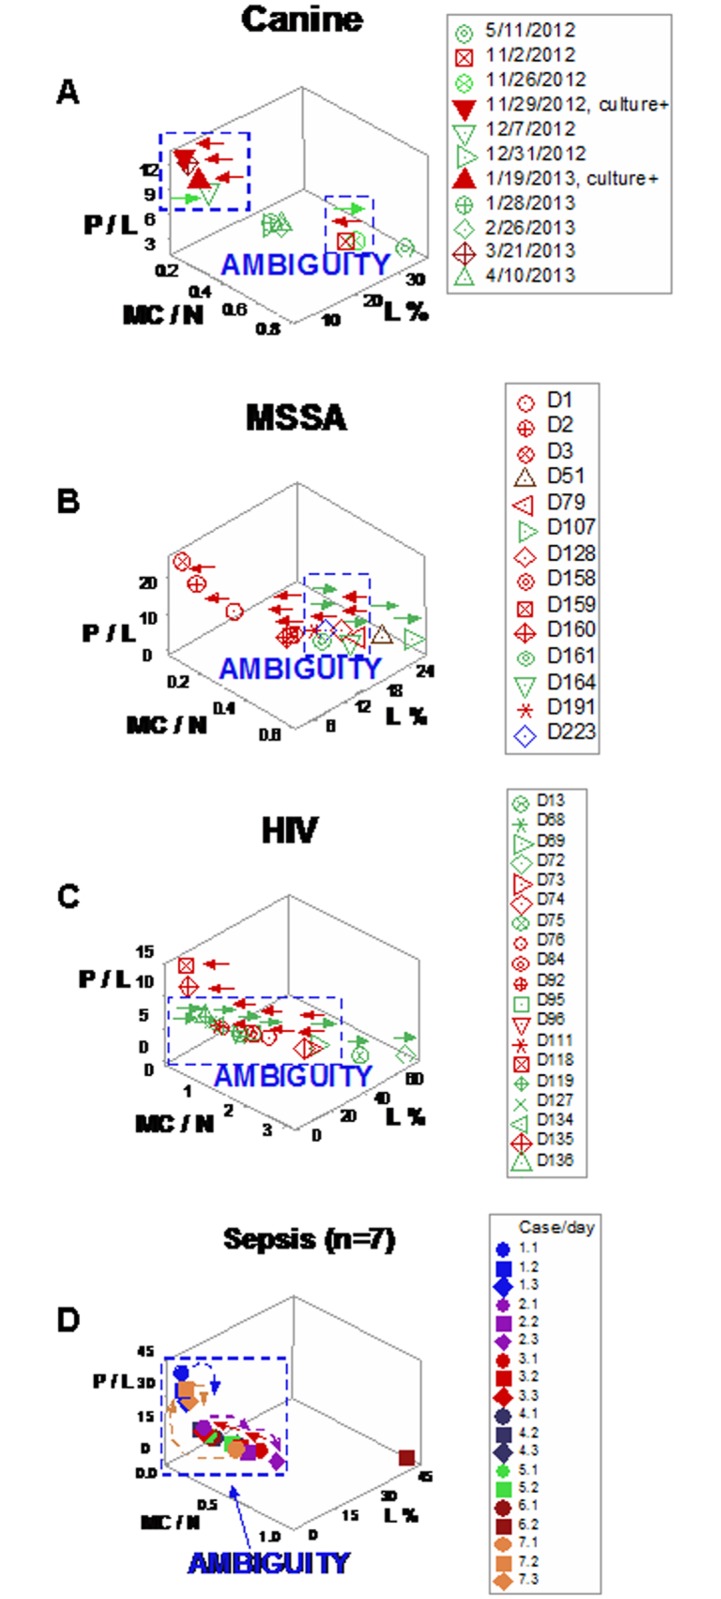
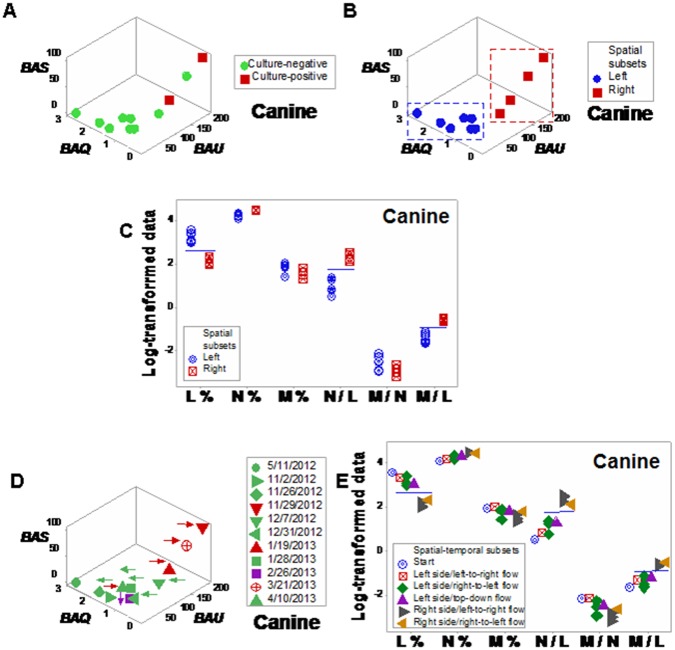
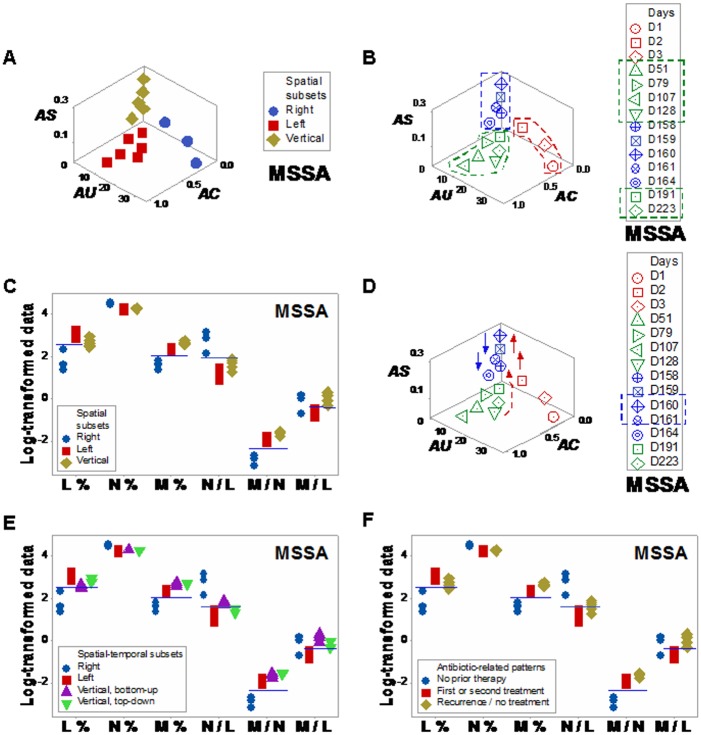
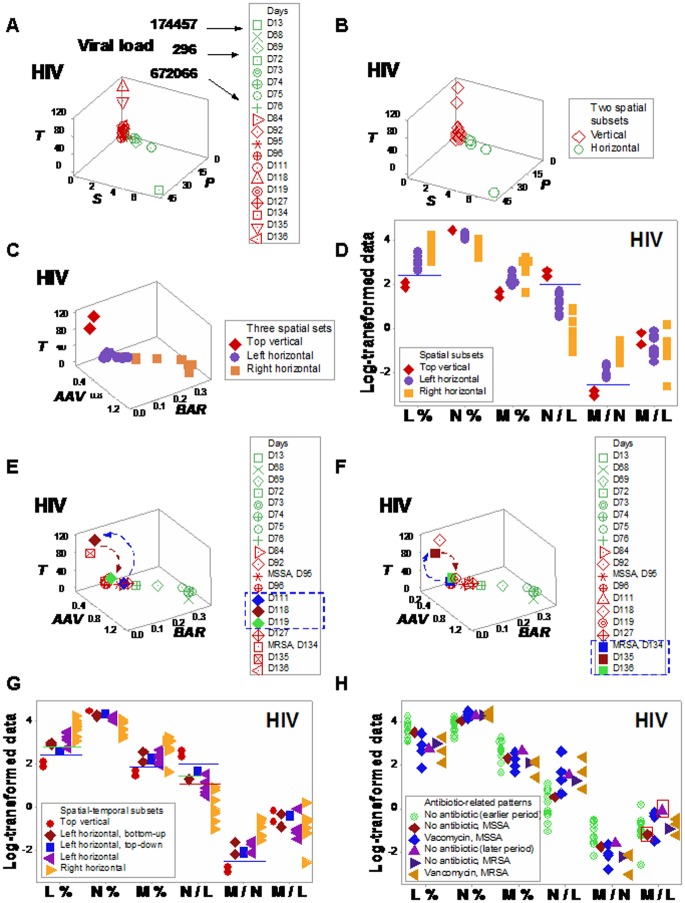
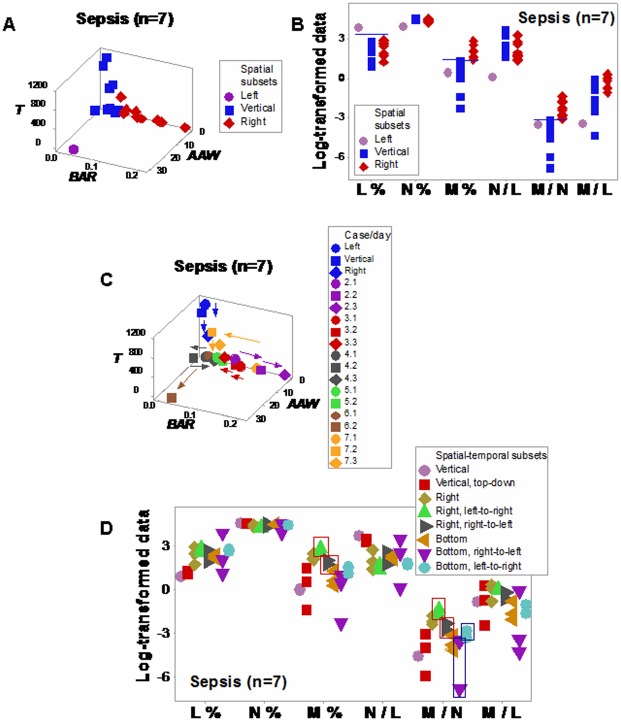
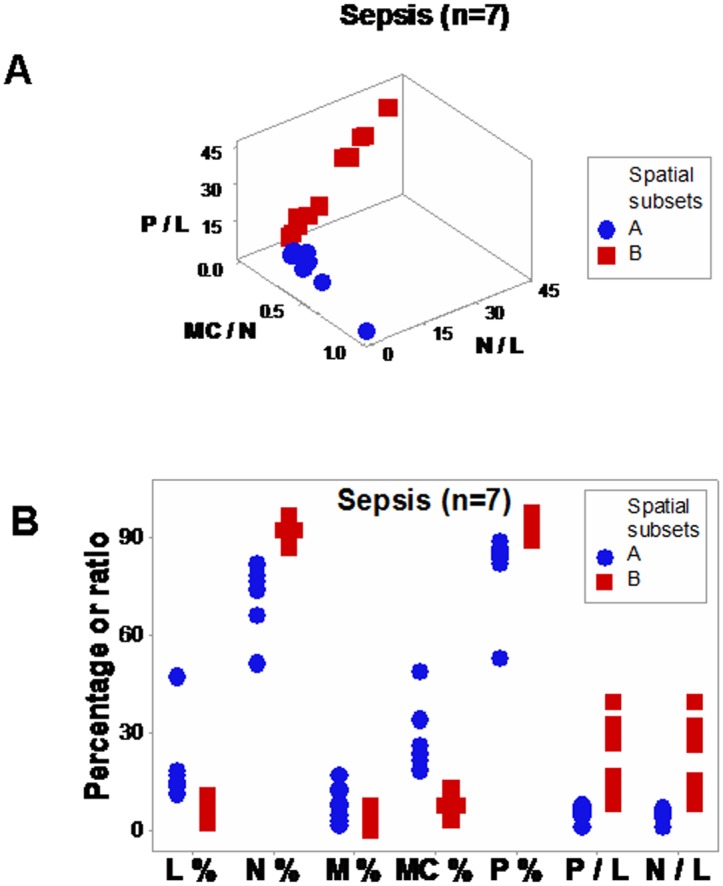
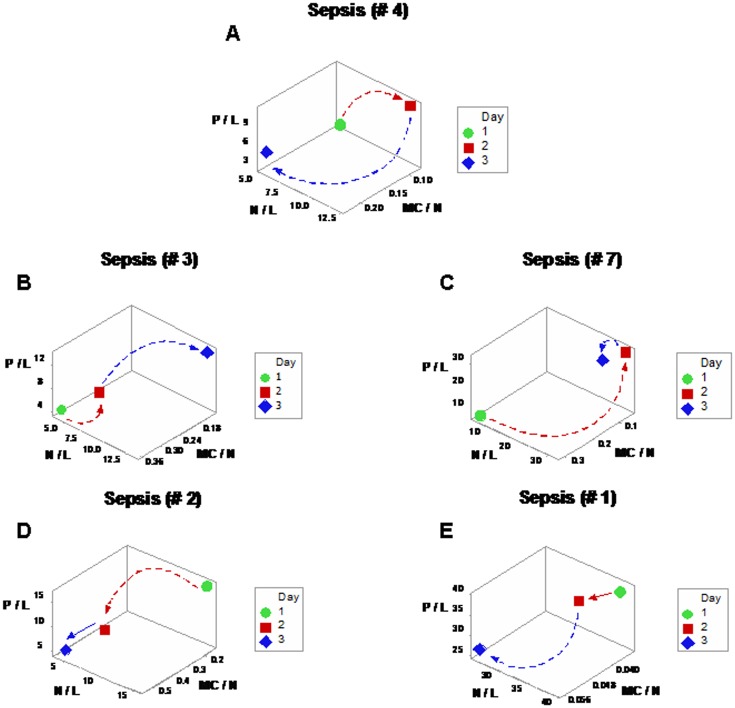
Methods: Leukocyte-microbial-temporal data were explored in canine and human (bacterial and/or viral) infections, with: (i) a non-structured approach, which measures leukocytes or microbes in isolation; and (ii) a structured method that assesses numerous combinations of interacting variables. Four alternatives of the structured method were tested: (i) a noise-reduction oriented version, which generates a single (one data point-wide) line of observations; (ii) a version that measures complex, three-dimensional (3D) data interactions; (iii) a non-numerical version that displays temporal data directionality (arrows that connect pairs of consecutive observations); and (iv) a full 4D (single line-, complexity-, directionality-based) version.

Results: In all studies, the non-structured approach revealed non-interpretable (ambiguous) data: observations numerically similar expressed different biological conditions, such as recovery and lack of recovery from infections. Ambiguity was also found when the data were structured as single lines. In contrast, two or more data subsets were distinguished and ambiguity was avoided when the data were structured as complex, 3D, single lines and, in addition, temporal data directionality was determined. The 4D method detected, even within one day, changes in immune profiles that occurred after antibiotics were prescribed.

Conclusions: Infectious disease data may be ambiguous. Four-dimensional methods may prevent ambiguity, providing earlier, in vivo, dynamic, complex, and personalized information that facilitates both diagnostics and selection or evaluation of anti-microbial therapies.


Conflict of interest statement

Competing Interests: The authors have read the journal’s policy and want to declare that a patent application was filed on behalf of two co-authors (AL Rivas, AL Hoogesteyn; 'Method for Identifying Altered Leukocyte Profiles', application number 2014/017181, filed on February 19, 2014), which is not granted at the present time. There are no further patents, products in development, or marketed products to declare. This does not alter the authors’ adherence to all the PLOS ONE policies on sharing data and materials.

Figures

Fig 1
Fig 1. Classic analysis of immuno-microbial data.
The classic method did not discriminate: leukocyte data distributions overlapped among different biological conditions, such as fever-positive and fever-negative individuals or individuals that recovered or did not recover from infections (blue boxes, a-d). The analysis of temporal data did not improve discrimination (e-h). Four studies were evaluated, including: (i) one dog [a, e], (ii) one human infected by MSSA [b, f]; (iii) one human HIV case, with a secondary MRSA infection [c, g]), and (iv) seven humans presenting with sepsis [d, h]).
Fig 2
Fig 2. Spatial-temporal data ambiguity.
Ambiguity (numerically similar observations that expressed different biological conditions) was also documented when three-dimensional (3D) relationships were explored and single (one data point-wide) lines of observations were utilized to explore longitudinal data. Ambiguity exhibited spatial-temporal relativity: data points that corresponded to recent infections occupied more space and/or exhibited broader data ranges than observations not associated with recent infections and/or recorded over longer periods (a-d). For instance, observations recorded within three days (red arrow, a) displayed a broader data range than observations collected over the following four months (blue oval, a). Consequently, no numerical value of leukocyte data, per se, could distinguish recent from older or protracted responses.
Fig 3
Fig 3. Multi-directional data ambiguity.
Ambiguity was also expressed when temporal data directionality was evaluated: arrows that connected pairs of consecutive observations displayed different temporal directionality even when they exhibited similar numerical information (boxes, a-d). Such pattern indicated that some dynamic changes took place at temporal scales smaller than the one utilized. Therefore, the 3D, single line of data points defined by the L%, the phagocyte/lymphocyte (P/L) and the mononuclear cell/neutrophil (MC/N) ratios failed to discriminate dynamics: some observations with similar numerical values, which expressed different biological conditions, were not distinguished.
Fig 4
Fig 4. Canine leukocyte spatial-temporal relationships.
When dimensionless indicators (DIs) were utilized and three-dimensional (3D) patterns were considered, canine data revealed two (‘left’ and ‘right’) subsets (a, b). Spatial data subsets exhibited non-overlapping lymphocyte percentages and N/L and M/L ratios (c). When temporal data directionality was considered, arrows expressing different directionality (d) increased discrimination: 4D (spatial-temporal) patterns distinguished five subsets (in addition to the first observation) and non-overlapping N% differentiated the ‘right side/left-to-right flow’ observations from the first one (horizontal lines indicate non-overlapping data subsets, e).
Fig 5
Fig 5. Human leukocyte spatial-temporal (MSSA/hip implant-related) relationships.
Three data subsets were identified when the MSSA/hip implant human case was explored with dimensionless indicators (a). All data points associated with antibiotic therapy were clustered within one subset (green polygon, b), even though antibiotics were administered in two non-consecutive periods (green boxes, b). The ‘vertical’ subset exhibited statistically significantly higher M/L values than the ‘bottom, left’ subset (c). When arrows that connected pairs of consecutive observations were assessed, three ‘bottom-up’ and two ‘top-down’ observations were detected (red and blue arrows, respectively, d). Changes in directionality were detected within one day: at days 159/160, one ‘bottom-up’ data point was followed by one ‘top-down’ observation (d). Spatial-temporal patterns (temporal data flows) differentiated four data subsets (e). The use of arrows distinguished ‘vertical, bottom-up’ from ‘vertical, top-down’ observations (horizontal line, e).
Fig 6
Fig 6. Human leukocyte spatial-temporal (HIV/MRSA-related) relationships.
Viral load values of the HIV+ patient were not informative: they exhibited more than 1000-fold changes among clinically stable observations (arrows indicating green symbols, a). In contrast, dimensionless indicators (DIs) differentiated two spatial (‘vertical’ and ‘horizontal’) subsets, which included two MRSA isolations within the vertical subset (set I, b), while all bacteria-negative data points were horizontally located (set II, b). A second set of DIs separated the ‘vertical’ data points into two sub-subsets: (i) the ‘top vertical’ and (ii) the ‘left horizontal’ groups, which did not overlap with the remaining (‘right horizontal’) data points (c). At least the L% and the M/N ratio distinguished the three spatial data subsets (d). More information was extracted when arrows that connected pairs of consecutive observations were measured (e, f). The assessment of spatial-temporal data directionality differentiated, twice, changes that took place within one day (days 118–119; and 135–136; arrows, e, f). While the spatial (3D) analysis detected only two or three data subsets (b, c), the spatial-temporal (4D) assessment distinguished five data subsets (g). For instance, the L%, M%, N/L, and M/N ratios differentiated ‘top vertical’ from the remaining observations (blue horizontal lines, g). The L% and N/L ratio also distinguished the ‘left/top-down’ observation from the ‘left/bottom-up’ observations (green horizontal lines, g). Furthermore, the N/L ratio discriminated the ‘right horizontal’ from the remaining subsets (red horizontal line, g). Some leukocyte profiles were associated with antibiotic therapy, for instance, higher M/L values were observed after antibiotics were prescribed, even after antibiotic therapy was discontinued (h).
Fig 7
Fig 7. Longitudinal relationships in septic humans.
Spatial patterns differentiated three data subsets among 7 septic patients analyzed with dimensionless indicators: (i) a vertical subset, (ii) a right subset, and (iii) the remaining observation, or ‘left’ subset (a). Higher M% and M/N ratio values distinguished the ‘right’ subset from the remaining data points, while higher L% and lower N/L ratio values differentiated the ‘left’ data point from the remaining observations (horizontal lines, b). Discrimination further improved when temporal and multidirectional data flows were assessed: several numerically similar observations displayed different directionalities (c). While not all observations could be analyzed statistically because some patterns included only one or two data point(s), the spatial-temporal analysis detected non-overlapping M% and M/N ratio distributions that differentiated by the ‘right’ subset with a left-to-right directional flow from the ‘right’ subset with a right-to-left flow (boxes, d). Non-numerical information (arrows) also distinguished ‘bottom/right-to-left’ from ‘bottom/left-to-right’ observations (boxes, d).
Fig 8
Fig 8. Spatial analysis of low-complexity indicators.
Even in its simplest version–which did not utilize dimensionless indicators–, the 4D method was more informative than the non-structured analysis reported in Fig 1. When low-complexity indicators that measured interactions involving two or more cell types were spatially analyzed (the phagocyte/lymphocyte [P/L], the mononuclear cell/neutrophil [MC/N], and the neutrophil/lymphocyte [N/L] ratios), two subsets of septic patients-related data, perpendicular to one another, were detected (a). The spatial analysis exhibited a single (one data point-wide) line of observations (a). When leukocyte data were partitioned according to the spatial patterns, several comparisons reached statistical significance ((b) and Table J in S1 File).
Fig 9
Fig 9. Spatial-temporal and personalized data analysis.
When the leukocyte data of five septic patients tested daily over three days were analyzed on personalized bases, several temporal patterns were observed (the data of the two remaining septic patients were not analyzed because they were tested only two days). At least two directionalities were differentiated: (i) data flows that came from the center or left and, over time, moved to the right (‘from left-to-right’, a, b); and (ii) responses that followed the opposite directionality (c-e). These responses were induced by: A. baumannii (a), E. faecalis (b), S. liquefaciens (c), and E. coli (d, e).

References

    1. Bork P, Serrano L (2005) Towards cellular systems in 4D. Cell 121: 507–509. 10.1016/j.cell.2005.05.001 - DOI - PubMed
    1. de Haan J (2006) How emergence arises. Ecol Complex 3:293–301. 10.1016/j.ecocom.2007.02.003 - DOI
    1. Casadevall A, Fang FC, Pirofski LA (2011) Microbial virulence as an emergent property: consequences and opportunities. PLoS Pathog 7(7): e1002136 10.1371/journal.ppat.1002136 - DOI - PMC - PubMed
    1. Yip D, Cho CH (2013) A multicellular 3D heterospheroid model of liver tumor and stromal cells in collagen gel for anti-cancer drug testing. Biochem Biophys Res Commun 433: 327–332. 10.1016/j.bbrc.2013.03.008 - DOI - PubMed
    1. Stephan A (2006) The dual role of ‘emergence’ in the philosophy of mind and in cognitive science. Synthese 151:485–498. 10.1007/s11229-006-9019-y - DOI