. 2016 Jul 11;30(1):147-160.
doi: 10.1016/j.ccell.2016.05.016.

Caloric Restriction Mimetics Enhance Anticancer Immunosurveillance

Affiliations

Caloric Restriction Mimetics Enhance Anticancer Immunosurveillance

Federico Pietrocola et al. Cancer Cell. .

Abstract

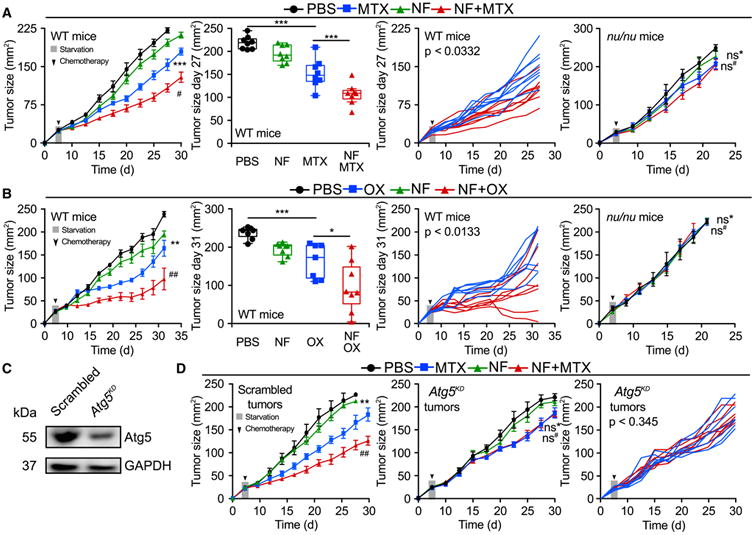
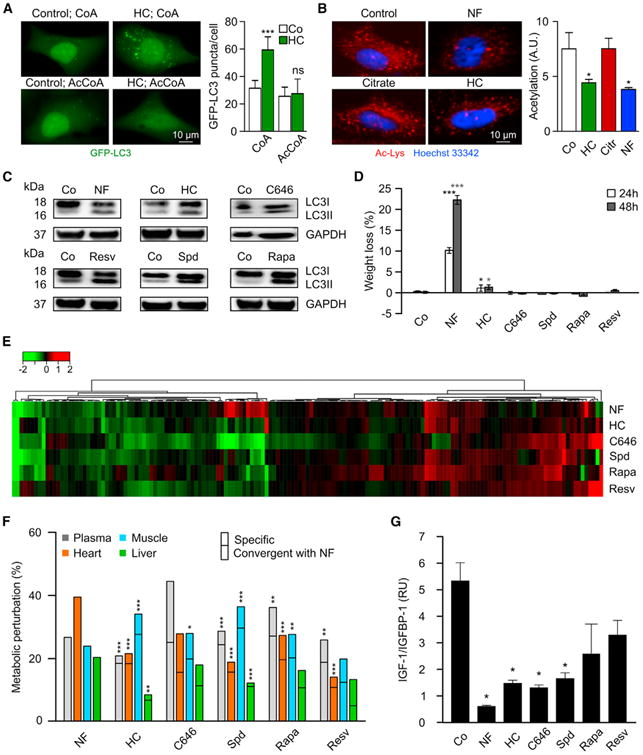
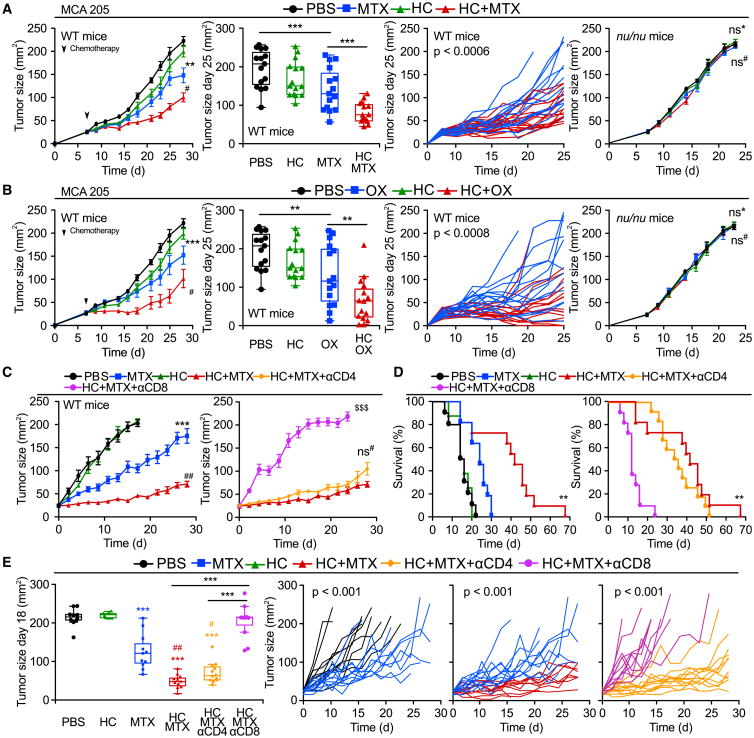
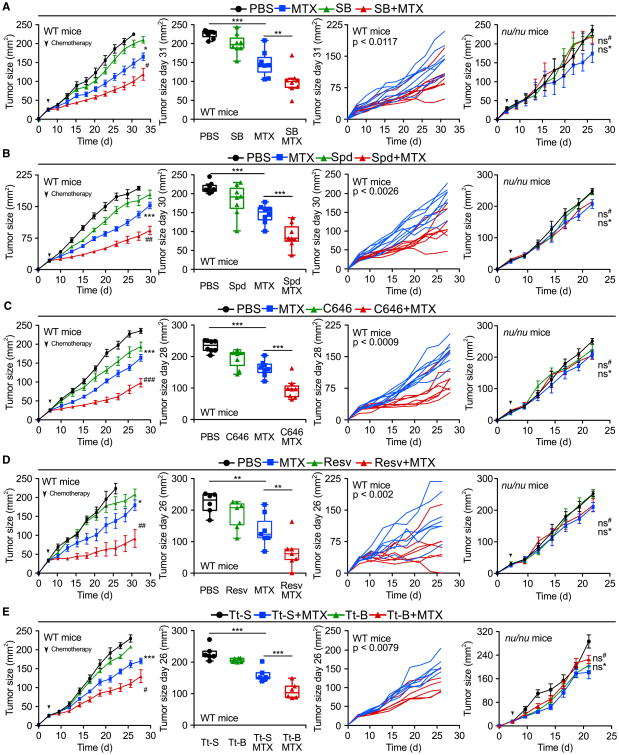
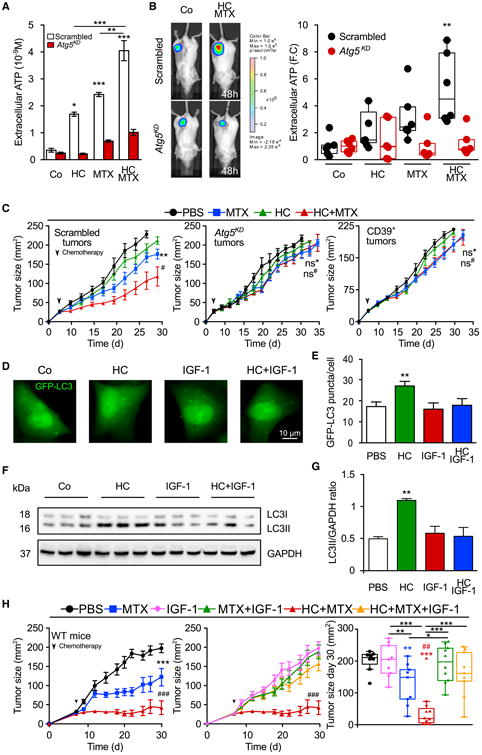
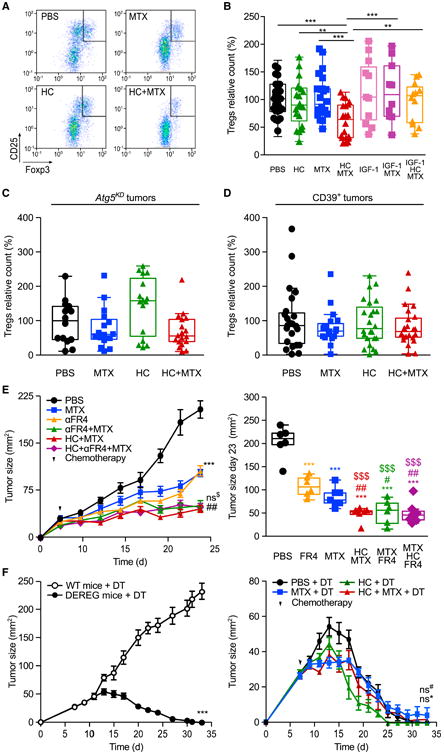
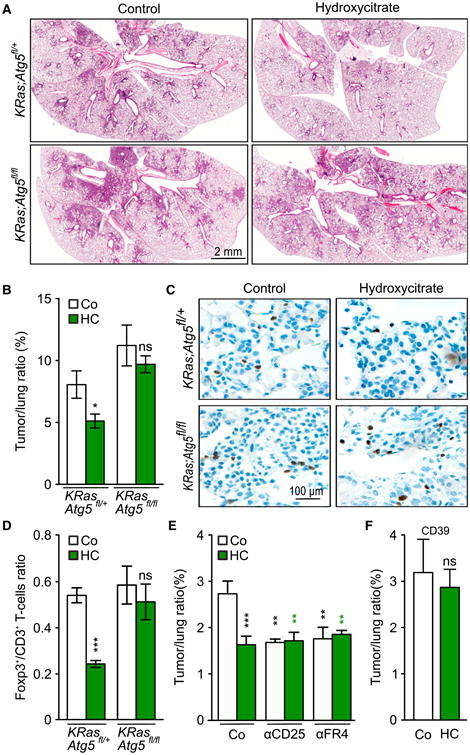
Caloric restriction mimetics (CRMs) mimic the biochemical effects of nutrient deprivation by reducing lysine acetylation of cellular proteins, thus triggering autophagy. Treatment with the CRM hydroxycitrate, an inhibitor of ATP citrate lyase, induced the depletion of regulatory T cells (which dampen anticancer immunity) from autophagy-competent, but not autophagy-deficient, mutant KRAS-induced lung cancers in mice, thereby improving anticancer immunosurveillance and reducing tumor mass. Short-term fasting or treatment with several chemically unrelated autophagy-inducing CRMs, including hydroxycitrate and spermidine, improved the inhibition of tumor growth by chemotherapy in vivo. This effect was only observed for autophagy-competent tumors, depended on the presence of T lymphocytes, and was accompanied by the depletion of regulatory T cells from the tumor bed.

Keywords: cancer; chemotherapy; immunosurveillance; regulatory T cell.


Figures

Figure 1
Figure 1. Fasting Improves the Efficacy of Chemotherapy in an Immune System- and Autophagy-Dependent Fashion
(A and B) Immune system-dependent effects of starvation. Wild-type (WT) immunocompetent C57BL/6 and athymic mice (nu/nu) mice were inoculated subcutaneously with murine fibrosarcoma MCA205 cells. When tumors became palpable, mice were fed ad libitum or underwent 48 hr fasting (NF, nutrient free) and received intraperitoneal chemotherapy with mitoxantrone (MTX) (A) or oxaliplatin (OX) (B), or an equivalent volume of PBS (PBS). From left to right: (1) average (±SEM) tumor growth curves of WT mice subjected to 48 hr starvation alone or in combination with MTX or OX from one representative experiment of two with at least seven mice per group; (2) tumor size distribution at day 27 (MTX) or day 31 (OX) of data shown in (1); (3) individual growth curves from mice treated with MTX or OX alone or combined with fasting of data shown in (1); (4) averaged (±SEM) tumor growth curves from immunodeficient nu/nu mice subjected to 48 hr starvation alone or in combination with MTX or OX from one representative experiment of two with at least five mice per group. For nu/nu mice, PBS and MTX groups are shared with experiments depicted in Figures 4B–4D. (C and D) Autophagy deficiency impairs starvation-mediated improvement in anthracycline-based therapy. (C) Immunoblot showing effective knockdown of Atg5 in murine MCA205 fibrosarcoma cells. (D) WT immunocompetent C57BL/6 mice were inoculated subcutaneously with autophagy-competent control cells expressing a scrambled control shRNA (left panel) or Atg5KD MCA205 cells (middle and right panels). When tumor became palpable, they were treated as in (A). Data are shown as averaged (±SEM) tumor growth curves of at least five mice per group from one representative experiment of two (left/middle panels) or as individual curves from mice treated with MTX alone or combined with fasting (right panel). Statistical analysis was performed by linear mixed-effect modeling (over the whole time course) and linear modeling (at a single time point). ***p < 0.001, **p < 0.01, *p < 0.05 (PBS versus MTX or OX); ##p < 0.01, #p < 0.05 (MTX versus MTX + NF or OX versus NF + OX); ns, not significant. For a comprehensive account of all comparisons, see also Tables S1 and S2.
Figure 2
Figure 2. Autophagy Induction and Metabolic Effects of Hydroxycitrate and Other Caloric Restriction Mimetics
(A) Inhibition of hydroxycitrate (HC)-induced autophagy by microinjection of acetyl coenzyme A (AcCoA) but not coenzyme A (CoA). U2OS cells stably expressing the autophagic marker GFP-LC3 were treated with HC for 6 hr and injected with 10 μM AcCoA or CoA. Representative pictures (left panel) and quantification (right panel, mean ± SD, n = 3). (B) Deacetylation of cytoplasmic proteins in response to 20 mM HC or cultured in a nutrient-free condition (NF). Representative pictures (left panel) and quantification (right panel, mean ± SEM, n = 3). (C) LC3I to LC3II conversion induced by starvation (48 hr) or short-term intraperitoneal injection of HC, C646, resveratrol (Resv), spermidine (Spd), or rapamycin (Rapa) in liver. For the characterization of the mode of action of HC, see Figure S1. (D) Weight loss (mean ± SD, n = 5) induced by 24 and 48 hr starvation or administration of the indicated agents in C57BL/6 mice. (E) Heatmap depicting log2 fold changes to the control of metabolite signals found significantly altered in the plasma of mice after 48 hr starvation or after two injections of corresponding caloric restriction mimetics (CRMs). For other organs, see Figure S2. For the complete list of metabolites, see Table S3. (F) Summary of significant (p < 0.05) metabolic alterations elicited by 48 hr of starvation or CRMs in different mouse tissues and plasma of data shown in (E).CRMs-induced alterations were considered as convergent with starvation when they had the same sign. (G) Effect of starvation and CRMs on plasma levels of insulin growth factor 1 (IGF-1) and IGF binding protein 1 (IGFBP1). Results are depicted as mean ± SEM (n = 3, two experiments). Statistical analysis was performed by Student's t test in comparison with the control condition (B, D, and G) and by Fisher's exact test to compare convergence incidences with those in NF (F). ***p < 0.001, **p < 0.01, *p < 0.05; ns, not significant.
Figure 3
Figure 3. Hydroxycitrate Improves Antitumor Immunity in an Immune System-Dependent Manner
(A and B) Immune-dependent effects of hydroxycitrate (HC) on transplanted tumors. Wild-type (WT) immunocompetent C57Bl/6 and athymic mice (nu/nu) mice were inoculated subcutaneously with murine fibrosarcoma MCA205 cells. When tumors became palpable, mice were treated with HC in drinking water and received one intraperitoneal injection of chemotherapy with mitoxantrone (MTX) (A), oxaliplatin (OX) (B) on the second day, or PBS (PBS)as a vehicle control. From left to right: (1) averaged (± SEM, pool of two independent experiments, at least seven mice per group sharing PBS and HC groups) growth curves from WT mice subjected to HC administration alone or in combination with MTX or OX; (2) tumor size distributions at day 25 (MTX and OX) of data shown in(1); (3) individual tumor growth curves of mice treated with MTX or OX alone or in combination with HC of data shown in(1); (4) averaged (±SEM, one representative experiment of two with at least five mice per group) growth curves from immunodeficient nu/nu mice subjected to HC treatment in drinking water alone or in combination with MTX or OX. (C–E) Immune system-dependent effects of HC on hormone-induced breast cancers. Immunocompetent BALB/c mice bearing palpable hormone-induced mammary cancers received intraperitoneal chemotherapy with MTX and/or 100 mg/kg HC, alone or together with antibodies depleting CD8+ or CD4+ T cells. Data are shown as: (C) averaged (± SEM, two independent experiments, at least eight mice per group); (D) Kaplan-Meier curves with death or tumor size exceeding 200 mm2 as endpoint; (E) distributions across treatment groups at day 18 and explicitly graphing up to 28 days post intraperitoneal treatment. Note that PBS curve in (C) ends at day 18 since averaged (but not single mice) tumor size of the group reached ethical limits. Statistical analyses were conducted by linear mixed-effect modeling (over the whole time course), linear modeling (at a single time point) and log-rank test (survival curves). ***p < 0.001, **p < 0.01 (comparisons with PBS or explicitly denoted by a segment); ##p < 0.01, #p < 0.05 (comparisons with chemotherapy alone); $$$p < 0.001 (HC + MTX versus HC + MTX + αCD8); ns, not significant. For a detailed account of all comparisons, see Tables S1 and S2. For HC effects on autophagy in tumors and additional models of transplantable cancers, see Figures S3 and S4.
Figure 4
Figure 4. Multiple Autophagy Inducers Reduce Tumor Growth via an Immunological Mechanism
(A–E) Wild-type (WT) immunocompetent C57BL/6 and athymic mice (nu/nu) mice were inoculated subcutaneously with murine fibrosarcoma MCA205 cells. When tumors became palpable, mice received systemic intraperitoneal injection of the ATP citrate lyase inhibitor SB204990 (SB) (A), the natural EP300 acetyltransferase inhibitor spermidine (Spd) (B), the EP300 inhibitor C646 (C), Resveratrol (Resv) (D), and the autophagy-inducing peptide Tt-B or its mutant control Tt-S (E), alone or together with mitoxantrone (MTX). Results (averaged ±SEM tumor growth curves) are plotted and statistical calculations performed as previously described. **p < 0.01, ***p < 0.001; *ns, not significant (PBS versus chemotherapy); #p < 0.05, ##p < 0.01, ###p <0.001 (chemotherapy versus CRMs + chemotherapy). For other statistical comparisons, see Tables S1 and S2. For additional evidence of immune mechanisms involved in the anticancer effects of CRMs, see Figure S4. For the characterization of the pro-autophagic effects of peptide Tt-B, see Figure S5.
Figure 5
Figure 5. Autophagy and ATP-Dependent Improvement of Anticancer Chemotherapy by Hydroxycitrate
(A) Autophagy-dependent release of ATP in vitro. ATP concentration (mean ± SEM, n = 7, pooled from two experiments) was measured in the supernatants of autophagy-competent or Atg5KD CT26 cells treated with 20 mM hydroxycitrate (HC) and/or 2 μM mitoxantrone (MTX). (B) Autophagy-dependent release of ATP in vivo. Autophagy-competent or Atg5KD CT26 colorectal cancers expressing a luciferase variant detecting extracellular ATP were treated with MTX and/or HC, and ATP release was monitored until 48 hr post chemotherapy. Representative images (left panel) and corresponding box plots of quantification (right panel) expressed as fold change of photon flux ratio. (C) Requirement of autophagy and extracellular ATP for the anti cancer effects of the MTX/HC combination. Tumor growth curves (mean ± SEM) from C57BL/6 mice bearing autophagy-competent or autophagy-deficient (Atg5KD) MCA205 tumors or MCA205 tumors or over expressing a CD39 transgene (CD39+) received MTX and/or HC. (D) Inhibition of HC-induced autophagy by IGF-1. U2OS cells stably expressing the autophagic marker GFP-LC3 were treated with HC alone or in combination with 10 mM insulin growth factor 1 (IGF-1). (E–G) (E) Autophagy was measured by assessing the abundance of GFP-LC3 puncta per cell (in the presence of BafA1) and quantified in (F, mean ± SEM, n = 3). WT immunocompetent C57BL/6 mice bearing MCA205-derived tumors were treated with HC alone or in combination with recombinant IGF-1. Autophagy was assessed by immunoblotting in the tumor (F) and quantified in (G, mean ± SEM, n = 3). (H) Reversal of the therapeutic effect of HC by IGF-1. WT immunocompetent C57BL/6 mice were inoculated subcutaneously with murine fibrosarcoma MCA205 cells and tumors were treated withHCand/or MTX, aloneor combined with intraperitoneal injectionsof recombinant IGF-1 protein (averaged ±SEM tumor growth curves). Data were analyzed by ANOVA for multiple comparisons (A and B), unpaired Student's t test (E and G), linear mixed-effect modeling (C and H), and linear modeling (H). Levels of significance: ***p < 0.001, **p < 0.01, *p < 0.05 (comparisons with Co/PBS unless indicated by a segment); ###p < 0.001, #p < 0.05 (comparisons between chemotherapy and chemotherapy + CRM); ns, not significant. For the indication of all statistical comparisons of (C) and (H), see Tables S1 and S2.
Figure 6
Figure 6. Autophagy and ATP-Dependent Depletion of Intratumoral Tregs by Hydroxycitrate
(A) Representative fluorescence-activated cell sorting profiles and quantification of CD4+CD25+Foxp3+ cells in the tumor infiltrate from cancers treated with mitoxantrone (MTX) and/or hydroxycitrate (HC) 11 days post chemotherapy. (B) Effects of MTX, HC, and insulin growth factor 1 (IGF-1) on the frequency of tumor-infiltrating CD4+CD25+Foxp3+ cells. (C and D) Effects of MTX and HC on the frequency of CD4+CD25+Foxp3+ Tregs infiltrating autophagy-deficient Atg5KD (C) or CD39-overexpressing (D) tumors. In (B–D), data are relative to the control (PBS) group of each experiment each dot represents a distinct tumor. (E and F) Regulatory T cell (Treg) depletion and HC administration similarly improve the effect of MTX. (E) Wild-type (WT) immunocompetent C57BL/6 mice were inoculated subcutaneously with MCA205 cells. When the tumor became palpable, mice received MTX, 100 mg/kg intraperitoneal HC, and/or anti-FR4 antibody. Averaged (±SEM, one experiment involving six mice per group) tumor sizes are reported for the entire duration of the experiment (left panel) together with the tumor size distributions at day 23 (right panel). (F) C57BL/6-Tg (Foxp3-DTR/EGFP) DEREG (DEpletion of REGulatory T cells) transgenic mice and their WT lit-termates were inoculated subcutaneously with MCA205 cells. When tumors became palpable, mice were injected intraperitoneally daily with 1 μg/kg diphtheria toxin (DT) for 15 days. DEREG mice were administered with HC in drinking water. At day 2 post DT and HC administration, DEREG mice received chemotherapy with MTX or PBS. Results are shown as means ± SEM (at least eight mice per group). Data were analyzed by ANOVA for multiple comparisons (B–D), linear mixed-effect modeling (E, left panel, and F), and linear modeling (E, right panel). Levels of significance: ***p < 0.001, **p < 0.01, *p < 0.05 (comparisons with PBS); ##p < 0.01, (comparisons between MTX and MTX combinations); $$$p < 0.001 (comparisons with anti-FR4 antibody); ns, not significant. For all comparisons in (B–F), see Tables S1 and S2. For additional evidence for the involvement of extracellular ATP metabolism and Treg depletion in the anticancer effects of HC, see Figure S6.
Figure 7
Figure 7. Hydroxycitrate Improves Antitumor Immunity in an Autophagy-Dependent Manner
(A and B) Hydroxycitrate (HC) reduces tumor size and lesions in KRas-induced lung cancer in KRas;Atg5fl/+ mice but not in KRas;Atg5fl/fl littermates. (A) H&E staining of representative histological sections after Cre recombinase-encoding adenovirus (Ad-Cre) inhalation and after 5 weeks HC administration in drinking water. (B) Quantification of data depicted in (A). Results are expressed as means ± SEM from three different experiments. (C and D) HC reduces CD3+Foxp3+ Tregs in tumor beds of KRas;Atg5fl/+ mice but not KRas;Atg5fl/fl littermates. Representative histological sections of Foxp3+ stained T cells after 5 weeks of HC administration (C) and corresponding quantification (D) (mean ± SEM, three independent experiments). (E) Epistatic analysis demonstrating that depletion of Tregs by administration of aFR4 or aCD25 antibodies reproduces the antitumor effect of HC.Results are illustrated as means ± SEM from threeexperiments. (F) Antitumor effects of HC in KRas-driven lungcancer is abrogated upon Cre-recombinase-induced expression of a CD39 transgene. 6- to 8-week-old CD39; KRas; Atg5fl/+ mice were treated byinhalation of Cre recombinase-encoding adenovirus(Ad-Cre). One week after recovery, mice were administered HC for 5 weeks. Results are shown asmeans ± SEM. Comparisons with the control group or untreated tumors were done by Student's t test. ***p < 0.001, **p < 0.01, *p < 0.05; ns, not significant. For additional immunohistochemical characterization of HC effects on KRas-induced tumors, see Figure S7.

Comment in

References

    1. Bindea G, Mlecnik B, Tosolini M, Kirilovsky A, Waldner M, Obenauf AC, Angell H, Fredriksen T, Lafontaine L, Berger A, et al. Spatiotemporal dynamics of intratumoral immune cells reveal the immune landscape in human cancer. Immunity. 2013;39:782–795. - PubMed
    1. Casagrande DS, Rosa DD, Umpierre D, Sarmento RA, Rodrigues CG, Schaan BD. Incidence of cancer following bariatric surgery: systematic review and meta-analysis. Obes Surg. 2014;24:1499–1509. - PubMed
    1. Cheng CW, Adams GB, Perin L, Wei M, Zhou X, Lam BS, Da Sacco S, Mirisola M, Quinn DI, Dorff TB, et al. Prolonged fasting reduces IGF-1/PKA to promote hematopoietic-stem-cell-based regeneration and reverse immunosuppression. Cell Stem Cell. 2014;14:810–823. - PMC - PubMed
    1. Chuah LO, Yeap SK, Ho WY, Beh BK, Alitheen NB. In vitro and in vivo toxicity of garcinia or hydroxycitric acid: a review. Evid Based Complement Alternat Med. 2012;2012:197920. - PMC - PubMed
    1. Demidenko E. The assessment of tumour response to treatment. J R Stat Soc Ser C. 2006;55:365–377.

Publication types

MeSH terms