. 2016 Jul 13;16(1):158.
doi: 10.1186/s12870-016-0845-x.

The sucrose non-fermenting 1-related kinase 2 gene SAPK9 improves drought tolerance and grain yield in rice by modulating cellular osmotic potential, stomatal closure and stress-responsive gene expression

Affiliations

The sucrose non-fermenting 1-related kinase 2 gene SAPK9 improves drought tolerance and grain yield in rice by modulating cellular osmotic potential, stomatal closure and stress-responsive gene expression

Avishek Dey et al. BMC Plant Biol. .

Abstract

Background: Family members of sucrose non-fermenting 1-related kinase 2 (SnRK2), being plant-specific serine/threonine protein kinases, constitute the central core of abscisic acid (ABA)-dependent and ABA-independent signaling pathways, and are key regulators of abiotic stress adaptation in plants. We report here the functional characterization of SAPK9 gene, one of the 10 SnRK2s of rice, through developing gain-of-function and loss-of-function phenotypes by transgenesis.

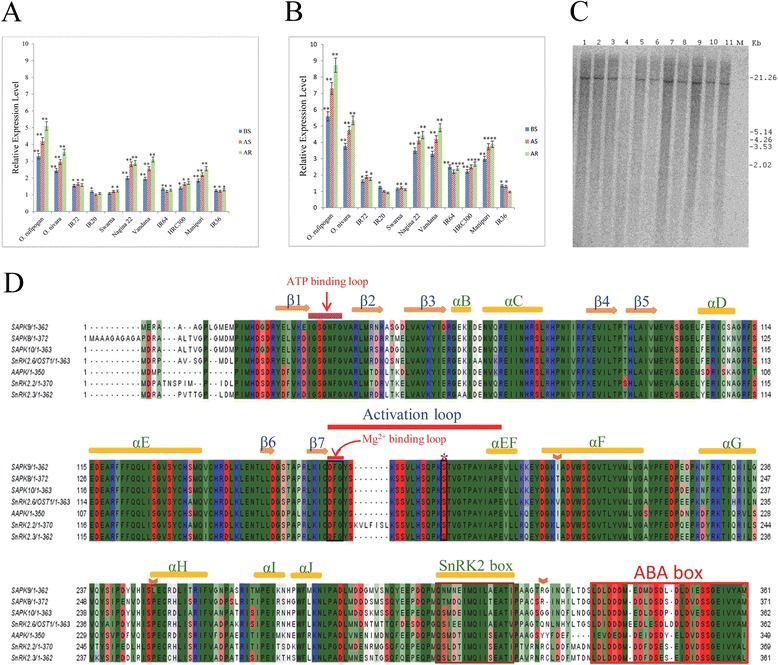
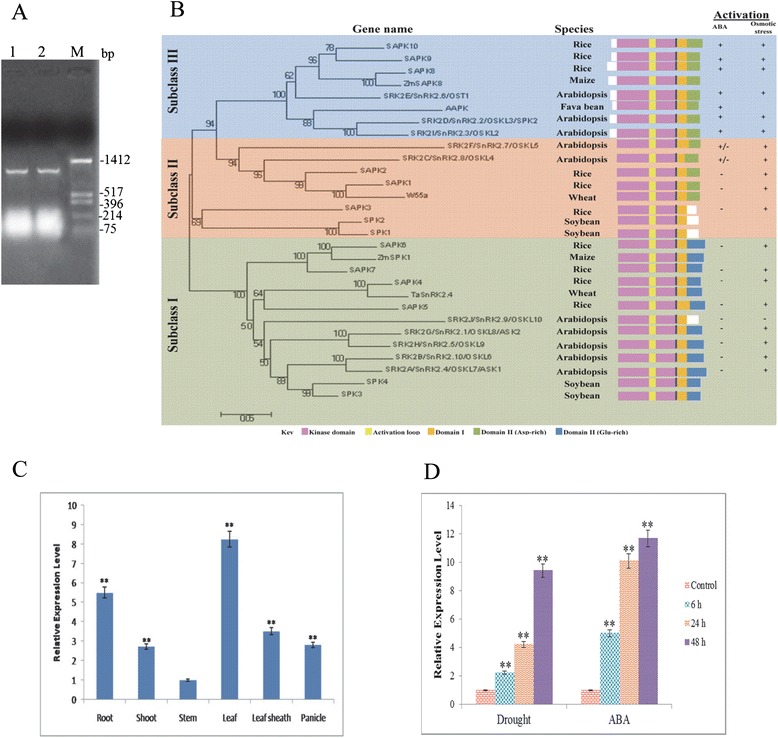
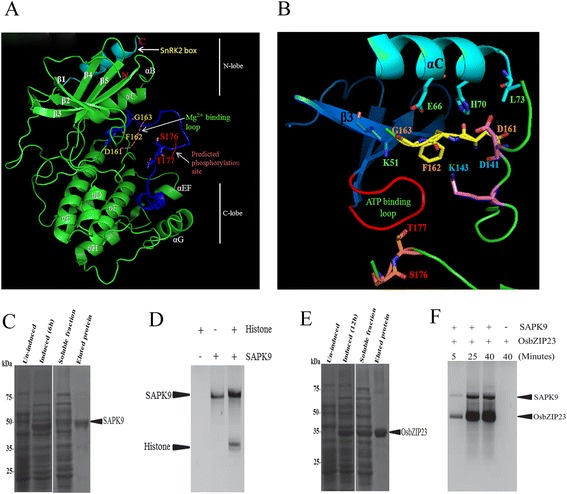
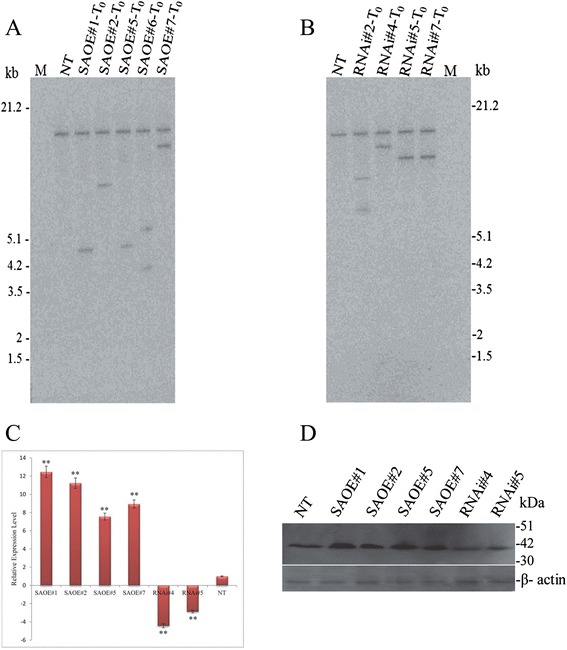
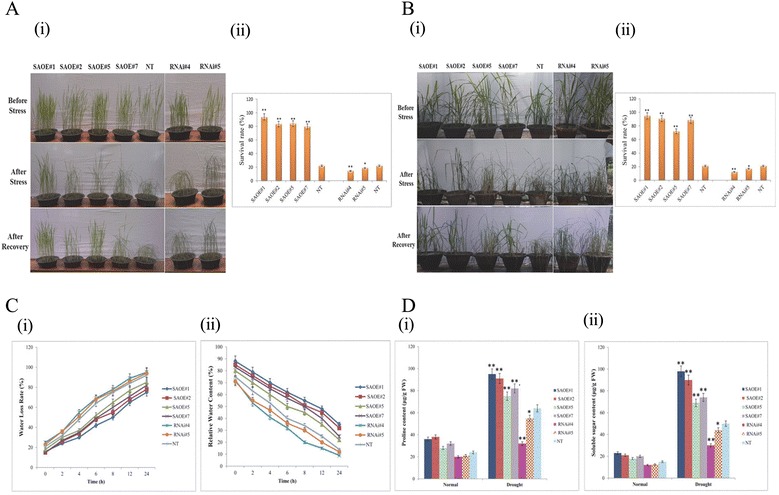
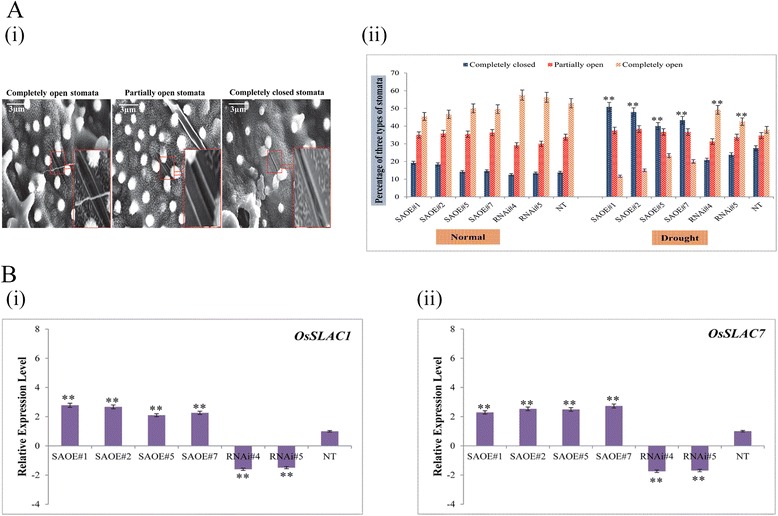
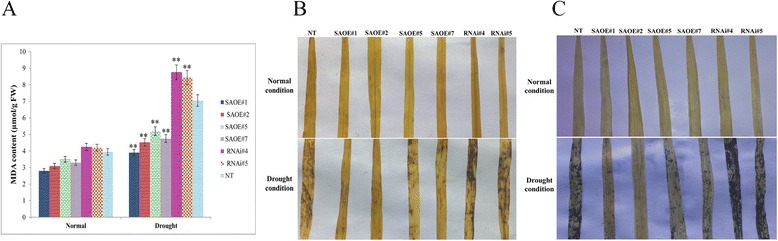
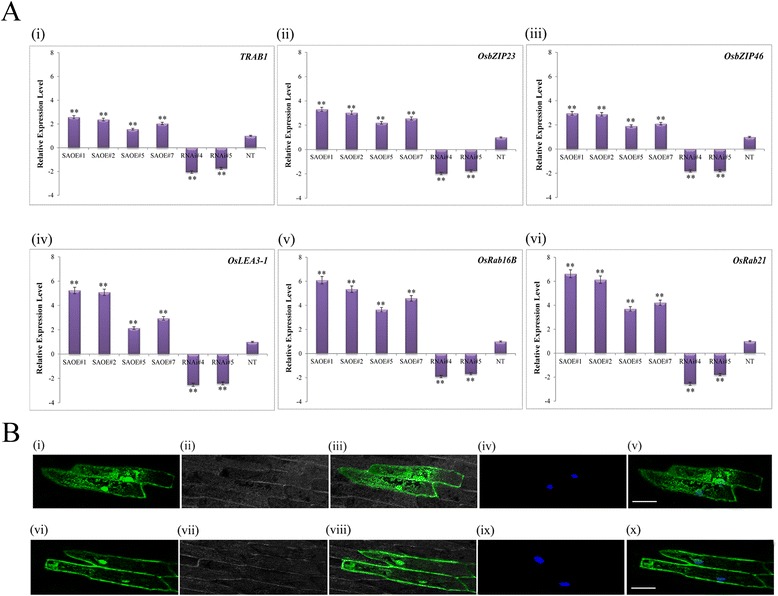
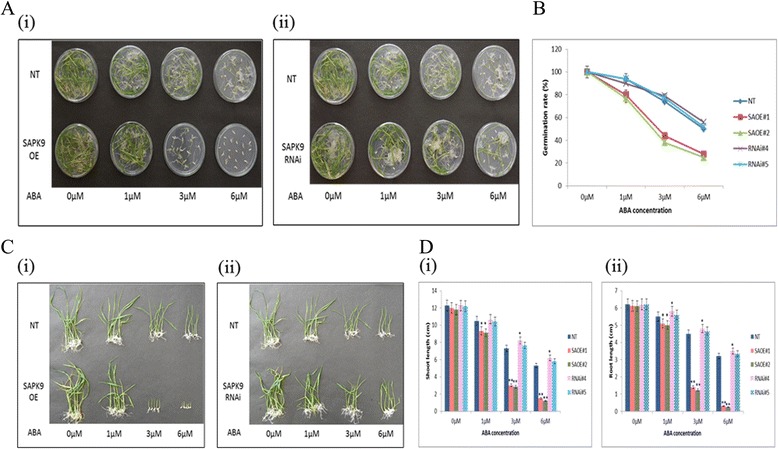
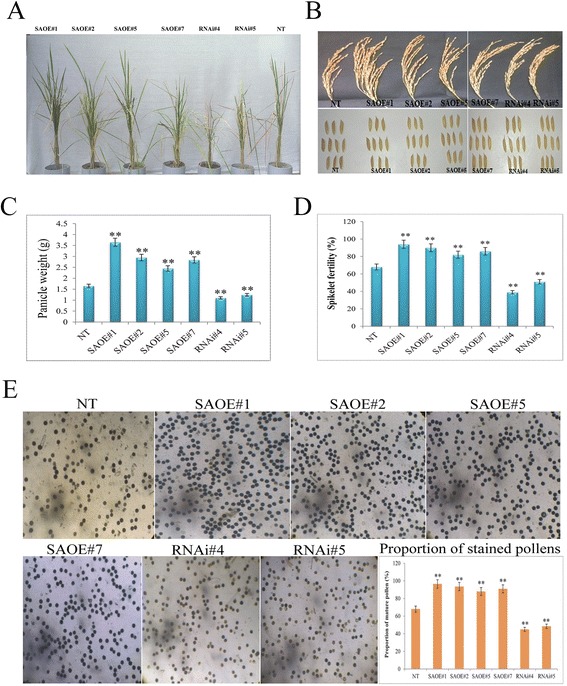
Results: The gene expression profiling revealed that the abundance of single gene-derived SAPK9 transcript was significantly higher in drought-tolerant rice genotypes than the drought-sensitive ones, and its expression was comparatively greater in reproductive stage than the vegetative stage. The highest expression of SAPK9 gene in drought-tolerant Oryza rufipogon prompted us to clone and characterise the CDS of this allele in details. The SAPK9 transcript expression was found to be highest in leaf and upregulated during drought stress and ABA treatment. In silico homology modelling of SAPK9 with Arabidopsis OST1 protein showed the bilobal kinase fold structure of SAPK9, which upon bacterial expression was able to phosphorylate itself, histone III and OsbZIP23 as substrates in vitro. Transgenic overexpression (OE) of SAPK9 CDS from O. rufipogon in a drought-sensitive indica rice genotype exhibited significantly improved drought tolerance in comparison to transgenic silencing (RNAi) lines and non-transgenic (NT) plants. In contrast to RNAi and NT plants, the enhanced drought tolerance of OE lines was concurrently supported by the upgraded physiological indices with respect to water retention capacity, soluble sugar and proline content, stomatal closure, membrane stability, and cellular detoxification. Upregulated transcript expressions of six ABA-dependent stress-responsive genes and increased sensitivity to exogenous ABA of OE lines indicate that the SAPK9 is a positive regulator of ABA-mediated stress signaling pathways in rice. The yield-related traits of OE lines were augmented significantly, which resulted from the highest percentage of fertile pollens in OE lines when compared with RNAi and NT plants.

Conclusion: The present study establishes the functional role of SAPK9 as transactivating kinase and potential transcriptional activator in drought stress adaptation of rice plant. The SAPK9 gene has potential usefulness in transgenic breeding for improving drought tolerance and grain yield in crop plants.

Keywords: Abscisic acid (ABA); Drought tolerance; Gene silencing; Grain yield; Osmotic potential; Overexpression; Rice crop; SAPK9; Stomatal closure; Stress-responsive gene; Sucrose non-fermenting 1-related kinase 2 (SnRK2).


Figures

Fig. 1
Fig. 1
Expression profiling and copy number determination of the endogenous SAPK9 gene in 11 selected rice genotypes. Real-time PCR analysis showing SAPK9 gene expression in (a) vegetative stage and (b) reproductive stage (grain filling) in rice plants growing under the condition of before stress (BS), after stress (AS) and after recovery (AR). For internal reference, rice polyubiquitin1 (OsUbi1) gene was used. Error bars represent the mean ± SD of triplicate measurements. Student’s t-test was performed to find out statistically significant differences (* P < 0.05, **P < 0.01). c Southern hybridization blot depicting the presence of one copy of the endogenous SAPK9 gene in all the rice genotypes examined. Lanes 1-11 represents O. rufipogon, O. nivara, Nagina22, Manipuri, Vandana, Swarna, IR20, IR36, IR64, IR72 and HRC300 genotypes, respectively. d Multiple amino acid sequence alignment of subclass III SnRK2 family members including SAPK9 protein for the prediction of secondary structures following the PROSITE ExPASy bioinformatics tool
Fig. 2
Fig. 2
Analyses of phylogenetic relationship and tissue-specific expression of SAPK9 gene cloned from the wild rice O. rufipogon. a Agarose gel showing the RT-PCR amplification of SAPK9 coding DNA sequence (CDS) from drought-tolerant O. rufipogon. Lane 1-2 PCR product, Lane M- molecular marker. b Phylogenetic tree of SnRK2 family proteins from selected plant species. The phylogenetic tree was constructed in MEGA6.0 software with the neighbor-joining method. The numbers indicate the bootstrap values (1000 replications). c Analysis of real-time PCR depicting SAPK9 transcript expression in root, shoot, leaf, leaf sheath and panicle in O. Rufipogon. d Real-time PCR analysis of the SAPK9 transcript in leaf samples of O. rufipogon under dehydration and exogenous ABA (100 μM) treatment at 6, 24 and 48 h. Untreated 0 h sample in each cases were used as control. For internal reference, rice OsUbi1 gene was used. Error bars represent the mean ± SD of triplicate measurements. Student’s t-test was performed to find out statistically significant differences (**P < 0.01)
Fig. 3
Fig. 3
In silico homology model of SAPK9 protein and kinase activity of the recombinant SAPK9 on different substrates. a The model of SAPK9 was constructed by Modeller9.15 (https://salilab.org/modeller/9.15) using Arabidopsis SnRK2.6 (PDB ID: 3UC4) as a template. The SnRK2 box and the activation loop segment are highlighted in cyan and blue, respectively. Predicted phosphorylation sites in activation loop are marked in red (S176, T177) and the Mg2+ binding loop is indicated. b Close view of the catalytic domain, ATP binding loop and phosphorylation site of SAPK9 activation loop. c Coomassie blue stained SDS-PAGE showing E. coli expressed recombinant His-tagged SAPK9 protein purified through Ni-NTA chromatography under native condition. d Autoradiography showing in vitro phosphorylation of histone III substrate with recombinant SAPK9. e Coomassie blue stained SDS-PAGE showing E.coli expressed recombinant His-tagged OsbZIP23 protein purified through Ni-NTA chromatography under native condition. f Autoradiography showing in vitro phosphorylation of OsbZIP23 substrate with recombinant SAPK9
Fig. 4
Fig. 4
Molecular analyses of the transgenic rice lines developed for SAPK9 overexpression (OE) and RNAi-mediated endogenous gene silencing (RNAi). a Southern hybridization blot of T0 transformants of OE plants (designated as SAOE#1, 2, 5, 6 and 7). b Southern hybridization blot of T0 transformants of RNAi plants (designated as RNAi#2, 4, 5 and 7). For both (a) and (b), the HindIII-digested genomic DNA samples were used to probe with the 470 bp fragment of SAPK9 CDS. Lane NT- non-transgenic control, Lane M- molecular weight marker. c The relative expression level of SAPK9 gene was analysed in leaf tissues of OE, RNAi, and NT plants in vegetative stage through real-time PCR. For internal reference, the OsUbi1 gene was used. Error bars represent the mean ± SD of triplicate measurements. Student’s t-test was performed to find out statistically significant differences (**P < 0.01). d Western blot illustrating the expression level of SAPK9 protein (upper panel) in leaf tissues of OE, RNAi and NT plants, where β-actin protein (lower panel) showing equal loading in each lane
Fig. 5
Fig. 5
Evaluating drought stress tolerance of SAPK9 overexpressed (OE) and gene silenced (RNAi) transgenic rice plants. a-i Pictures showing three sets of plants, i.e. OE, RNAi and NT in the vegetative stage under the conditions of before drought stress, after drought stress and subsequent recovery after drought stress. a-ii Survival rates (%) of OE, RNAi, and NT plants in the vegetative stage. b-i Pictures showing OE, RNAi, and NT plants in early reproductive (panicle initiation) stage under the conditions of before drought stress, after drought stress and subsequent recovery after drought stress. b-ii Survival rates (%) of OE, RNAi and NT plants in the early reproductive stage. c-i Comparison of water loss rate (WLR) and (c-ii) relative water content (RWC) of the detached leaves from transgenic lines and NT plants at the five-leaf stage. Estimation of the contents of (d-i) proline and (d-ii) soluble sugar in leaf tissues of transgenic lines and NT plants before and after drought stress
Fig. 6
Fig. 6
Monitoring stomatal closure and relative expression level of stomatal genes in SAPK9 overexpressed (OE) and gene silenced (RNAi) transgenic rice plants. a-i Representative photographs showing stomatal status in rice leaves. a-ii Number of completely open, partially open and completely closed stomata were calculated before (Normal) and after stress (Drought) in three sets of plants, i.e. OE, RNAi and NT plants (n = 80). All the results were compiled from three independent experimental sets. Error bars represent the mean ± SD of triplicate measurements. Student’s t-test was performed to find out statistically significant differences (**P < 0.01). b Real-time PCR analysis showing transcript level of stomatal genes- (i) OsSLAC1 and (ii) OsSLAC7 in transgenic and NT plants during drought stress. For internal reference, the OsUbi1 gene was used. Error bars represent the mean ± SD of triplicate measurements. Student’s t-test was performed to find out statistically significant differences (**P < 0.01)
Fig. 7
Fig. 7
Analysis of malondialdehyde (MDA) content and reactive oxygen species (ROS) activity in SAPK9 OE and RNAi plants. a Estimation of MDA content in leaf tissues of transgenic and NT plants before (Normal) and after drought stress (Drought). Error bars represent the mean ± SD of triplicate measurements. Student’s t-test was performed to find out statistically significant differences (**P < 0.01). b Monitoring ROS activity, as revealed by evaluation of H2O2 content in leaf tissues of transgenic and NT plants through visualization upon staining with DAB under normal and drought conditions. c Accumulation of O2- ions in leaf tissues was visualized by staining with NBT in transgenic and NT plants under normal and drought stress conditions. Results were recorded from three independent experimental sets, and the result from one set is documented here
Fig. 8
Fig. 8
Expression profiling of a few drought stress inducible genes working hierarchically downstream of the ABA-signaling pathway and analysis of subcellular localization of SAPK9 protein in onion epidermal cells. a-i-vi Analysis of real-time PCR depicting transcript level of TRAB1, OsbZIP23, OsbZIP46, OsLEA3-1, OsRab16B and OsRab21 in leaf tissues of transgenic and NT plants during drought stress. For internal reference, the OsUbi1 gene was used. Error bars represent the mean ± SD of triplicate measurements. Student’s t-test was performed which indicated statistically significant differences (**P < 0.01). b SAPK9–GFP fusion protein and control GFP were transiently expressed in onion epidermal cells and observed with a laser-scanning confocal microscope. Upper panel (i-v): SAPK9–GFP fusion; lower panel (vi-x): only GFP. Images were taken (i, vi) in the dark field for green fluorescence, (ii, vii) in the bright field, (iii, viii) dark field green fluorescence merged with bright field image and (iv, ix) DAPI stained nucleus (5 μg/mL) (v, x) DAPI stained nucleus merged with dark field green fluorescence. Scale bar- 100 μm
Fig. 9
Fig. 9
Assessment of ABA sensitivity of SAPK9 OE and RNAi plants at seed germination and post-germination stages. a-i, ii Germination performance of seeds grown on MS agar media supplemented with 0, 1, 3 and 6 μM ABA from two OE lines (SAOE#1, SAOE#2), and two RNAi lines (RNAi#4, RNAi#5) compared to NT plants at 10th day. b Germination rate (%) of seeds grown on media supplemented with 0, 1, 3 and 6 μM ABA from OE, RNAi and NT plants at 10th day. c-i, ii The performance of transgenic and NT seedlings grown in ½ MS liquid media supplemented with 0, 1, 3 and 6 μM of ABA after 14 days. d Comparison of (i) shoot length and (ii) root length of transgenic and NT seedlings grown in media supplemented with 0, 1, 3 and 6 μM ABA after 14 days. For representation and better comparison amongst OE, RNAi and NT plants, the NT panel is duplicated in A (i and ii) and C (i and ii). Error bars represent the mean ± SD of triplicate measurements. Student’s t-test was performed to find out statistically significant differences (*P < 0.05, ** P < 0.01). Results were compiled from three independent experimental sets
Fig. 10
Fig. 10
Evaluating grain yield of SAPK9 overexpressed (OE) and gene silenced (RNAi) transgenic rice plants. a Drought stress treatment of three sets of plants, i.e. OE, RNAi and NT plants at flowering stage in PVC pipes and subsequent irrigation till seed maturation stage. b Mature panicles and grains of three sets of plants. c Comparison of panicle weight in three sets of plants. d Comparison of spikelet fertility (%) in three sets of plants. e Proportion (%) of viable pollens (after staining with 1 % I2-KI solution) in three sets of plants. Error bars represent the mean ± SD of triplicate measurements. Student’s t-test was performed to find out statistically significant differences (** P < 0.01). Results were compiled from three independent experimental sets

Similar articles

Cited by

References

    1. Cutler SR, Rodriguez PL, Finkelstein RR, Abrams SR. Abscisic acid: emergence of a core signaling network. Annu Rev Plant Biol. 2010;61:651–79. doi: 10.1146/annurev-arplant-042809-112122. - DOI - PubMed
    1. Hong SW, Jon JH, Kwak JM, Nam HG. Identification of a receptor-like protein kinase gene rapidly induced by abscisic acid, dehydration, high salt, and cold treatments in Arabidopsis thaliana. Plant Physiol. 1997;113(4):1203–12. doi: 10.1104/pp.113.4.1203. - DOI - PMC - PubMed
    1. Fujii H, Verslues PE, Zhu JK. Arabidopsis decuple mutant reveals the importance of SnRK2 kinases in osmotic stress responses in vivo. Proc Natl Acad Sci. 2011;108(4):1717–22. doi: 10.1073/pnas.1018367108. - DOI - PMC - PubMed
    1. Kulik A, Wawer I, Krzywińska E, Bucholc M, Dobrowolska G. SnRK2 protein kinases—key regulators of plant response to abiotic stresses. OMICS. 2011;15(12):859–72. doi: 10.1089/omi.2011.0091. - DOI - PMC - PubMed
    1. Li J, Wang XQ, Watson MB, Assmann SM. Regulation of abscisic acid-induced stomatal closure and anion channels by guard cell AAPK kinase. Science. 2000;287(5451):300–3. doi: 10.1126/science.287.5451.300. - DOI - PubMed

Publication types