

MEMHDX: an interactive tool to expedite the statistical validation and visualization of large HDX-MS datasets
- PMID: 27412089
- PMCID: PMC5181559
- DOI: 10.1093/bioinformatics/btw420
MEMHDX: an interactive tool to expedite the statistical validation and visualization of large HDX-MS datasets
Abstract
Motivation: With the continued improvement of requisite mass spectrometers and UHPLC systems, Hydrogen/Deuterium eXchange Mass Spectrometry (HDX-MS) workflows are rapidly evolving towards the investigation of more challenging biological systems, including large protein complexes and membrane proteins. The analysis of such extensive systems results in very large HDX-MS datasets for which specific analysis tools are required to speed up data validation and interpretation.
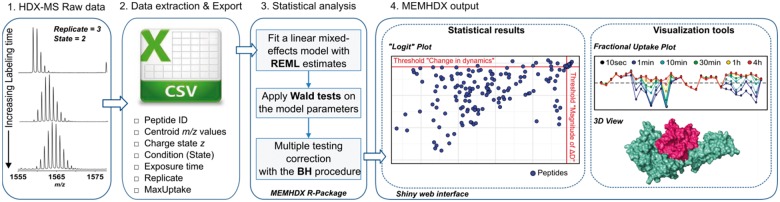
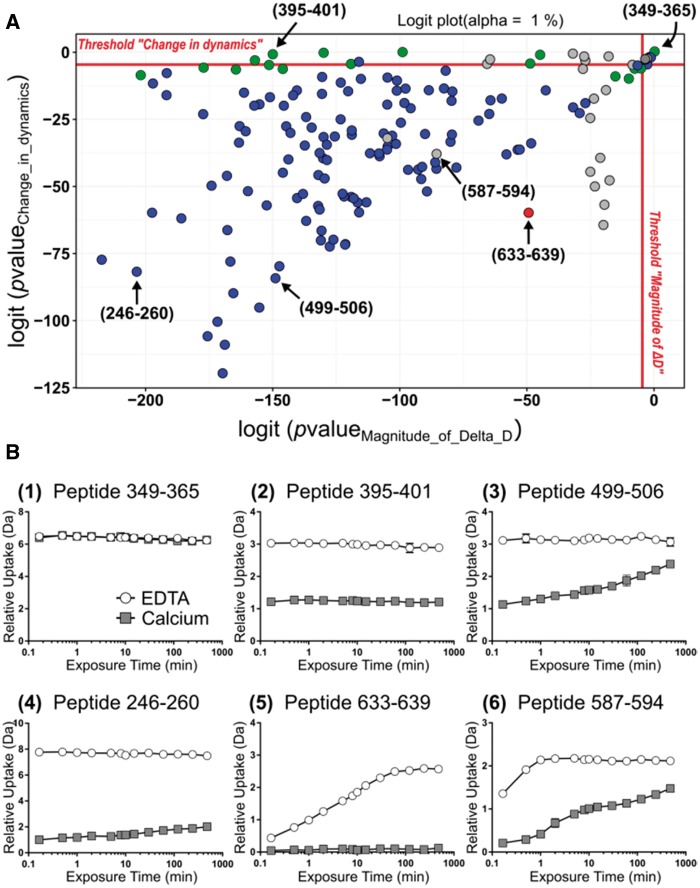
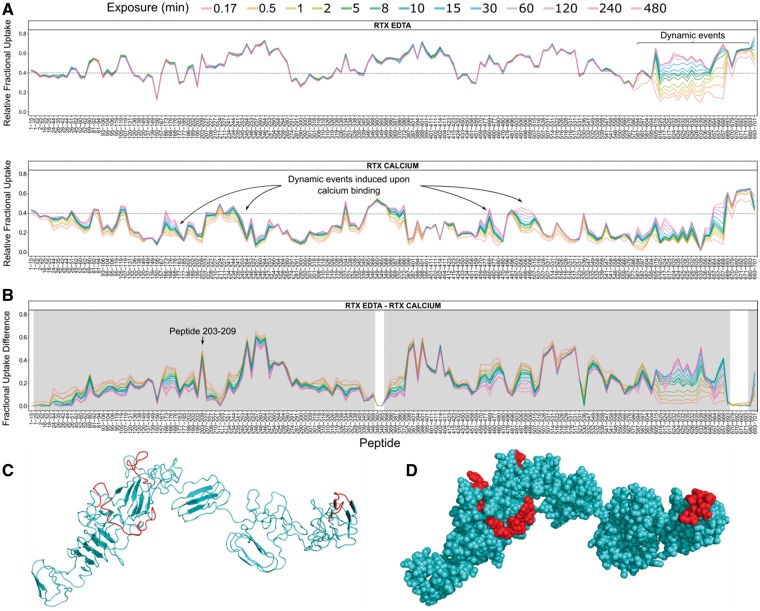
Results: We introduce a web application and a new R-package named 'MEMHDX' to help users analyze, validate and visualize large HDX-MS datasets. MEMHDX is composed of two elements. A statistical tool aids in the validation of the results by applying a mixed-effects model for each peptide, in each experimental condition, and at each time point, taking into account the time dependency of the HDX reaction and number of independent replicates. Two adjusted P-values are generated per peptide, one for the 'Change in dynamics' and one for the 'Magnitude of ΔD', and are used to classify the data by means of a 'Logit' representation. A user-friendly interface developed with Shiny by RStudio facilitates the use of the package. This interactive tool allows the user to easily and rapidly validate, visualize and compare the relative deuterium incorporation on the amino acid sequence and 3D structure, providing both spatial and temporal information.
Availability and implementation: MEMHDX is freely available as a web tool at the project home page http://memhdx.c3bi.pasteur.fr CONTACT: marie-agnes.dillies@pasteur.fr or sebastien.brier@pasteur.frSupplementary information: Supplementary data is available at Bioinformatics online.
© The Author 2016. Published by Oxford University Press.
Figures
References
-
- Benjamini Y., Hochberg Y. (1995) Controlling the false discovery rate: s practical and powerful approach to multiple testing. J. R. Stat. Soc. Ser. B (Methodol.), 57, 289–300.
-
- Bertoldi I. et al. (2016) Exploiting chimeric human antibodies to characterize a protective epitope of Neisseria adhesin A, one of the Bexsero vaccine components. FASEB J., 30, 93–101. - PubMed
-
- Campobasso N., Huddler D. (2015) Hydrogen deuterium mass spectrometry in drug discovery. Bioorg. Med. Chem. Lett., 25, 3771–3776. - PubMed
-
- Englander S.W., Kallenbach N.R. (1983) Hydrogen exchange and structural dynamics of proteins and nucleic acids. Q. Rev. Biophys., 16, 521–655. - PubMed
MeSH terms
Substances
LinkOut - more resources
Full Text Sources
Other Literature Sources
Molecular Biology Databases
