. 2016 Jul 13:16:469.
doi: 10.1186/s12885-016-2538-0.

Differential cytotoxicity induced by the Titanium(IV)Salan complex Tc52 in G2-phase independent of DNA damage

Affiliations

Differential cytotoxicity induced by the Titanium(IV)Salan complex Tc52 in G2-phase independent of DNA damage

Theresa Pesch et al. BMC Cancer. .

Abstract

Background: Chemotherapy is one of the major treatment modalities for cancer. Metal-based compounds such as derivatives of cisplatin are in the front line of therapy against a subset of cancers, but their use is restricted by severe side-effects and the induction of resistance in treated tumors. Subsequent research focused on development of cytotoxic metal-complexes without cross-resistance to cisplatin and reduced side-effects. This led to the discovery of first-generation titanium(IV)salan complexes, which reached clinical trials but lacked efficacy. New-generation titanium (IV)salan-complexes show promising anti-tumor activity in mice, but their molecular mechanism of cytotoxicity is completely unknown.

Methods: Four different human cell lines were analyzed in their responses to a toxic (Tc52) and a structurally highly related but non-toxic (Tc53) titanium(IV)salan complex. Viability assays were used to reveal a suitable treatment range, flow-cytometry analysis was performed to monitor the impact of dosage and treatment time on cell-cycle distribution and cell death. Potential DNA strand break induction and crosslinking was investigated by immunostaining of damage markers as well as automated fluorometric analysis of DNA unwinding. Changes in nuclear morphology were analyzed by DAPI staining. Acidic beta-galactosidase activity together with morphological changes was monitored to detect cellular senescence. Western blotting was used to analyze induction of pro-apoptotic markers such as activated caspase7 and cleavage of PARP1, and general stress kinase p38.

Results: Here we show that the titanium(IV)salan Tc52 is effective in inducing cell death in the lower micromolar range. Surprisingly, Tc52 does not target DNA contrary to expectations deduced from the reported activity of other titanium complexes. Instead, Tc52 application interferes with progression from G2-phase into mitosis and induces apoptotic cell death in tested tumor cells. Contrarily, human fibroblasts undergo senescence in a time and dose-dependent manner. As deduced from fluorescence studies, the potential cellular target seems to be the cytoskeleton.

Conclusions: In summary, we could demonstrate in four different human cell lines that tumor cells were specifically killed without induction of major cytotoxicity in non-tumorigenic cells. Absence of DNA damaging activity and the cell-cycle block in G2 instead of mitosis makes Tc52 an attractive compound for further investigations in cancer treatment.

Keywords: Apoptosis; Cell-cycle; Senescence; Titanium(IV)salan complex; Tumorigenicity.


Figures
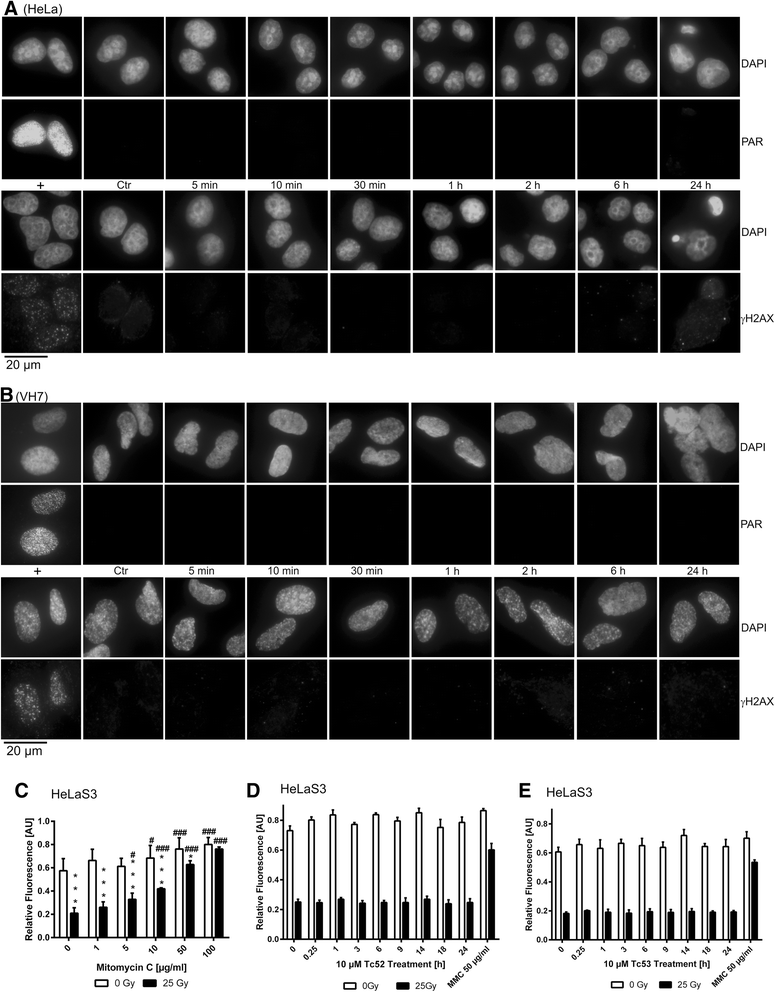
Fig. 1
Fig. 1
Tc52 does not induce DNA damage. a: Detection of PAR (upper panel) and γH2AX (lower panel) by immunofluorescence after application of 10 μM Tc52 in HeLa cells. For positive controls (+), cells were incubated with 500 μM H2O2 for 10 min (PAR detection) and for 6 h (γH2AX detection). Respective upper rows show staining of nuclei (DAPI), lower rows detection of either PAR or γH2AX. Incubation time is depicted between both panels. γH2AX is only evident in apoptotic cells after 24 h. For each independent experiment, at least 100 cells were analyzed in technical duplicates. b Detection of PAR (upper panel) and γH2AX (lower panel) by immunofluorescence after application of 10 μM Tc52 in VH7 normal fibroblasts. For positive controls (+), cells were incubated with 500 μM H2O2 for 30 min (PAR detection) and for 1 h (γH2AX detection). Respective upper rows show staining of nuclei (DAPI), lower rows detection of either PAR or γH2AX. Incubation time is depicted between both panels. For each independent experiment, at least 100 cells were analyzed in technical duplicates. Complete time course of H2O2 treatment is depicted in Additional Fig. 3a for HeLa cells and Additional Fig. 3b for VH7 fibroblasts. c: Dose–response curve for mitomycin C-dependent crosslinking in HeLa. Bars indicate fluorescence signals with (filled bars) or without (open bars) 25 Gy irradiation as detected by FADU. Irradiation reduces, application of mitomycin C increases signals. Asterisks (*) indicate significant difference between irradiated and non-irradiated samples; hashtags (#) describe significance compared to the respective controls (0). p < 0.05 = #/*, p < 0.01 = ##/**; p < 0.001 = ###/***, (two-way ANOVA, Sidak's Multiple Comparison Test). At 100 μM mitomycin C, strong crosslinking prevents drop in signal intensity by irradiation. d: Time course of DNA breaks and crosslink detection by FADU after application of 10 μM Tc52 to HeLa cells for the indicated time points. Bars indicate fluorescence signals with (filled bars) or without (open bars) 25 Gy irradiation as detected by FADU. No change in signal intensity over time can be observed. 50 μg/ml mitomycinC (MMC) was applied as positive control. e: Time course of DNA breaks and crosslink detection by FADU after application of 10 μM Tc53 to HeLa cells for the indicated time points. Bars indicate fluorescence signals with (filled bars) or without (open bars) 25 Gy irradiation as detected by FADU. No change in signal intensity over time can be observed. 50 μg/ml mitomycinC (MMC) was applied as positive control
Fig. 2
Fig. 2
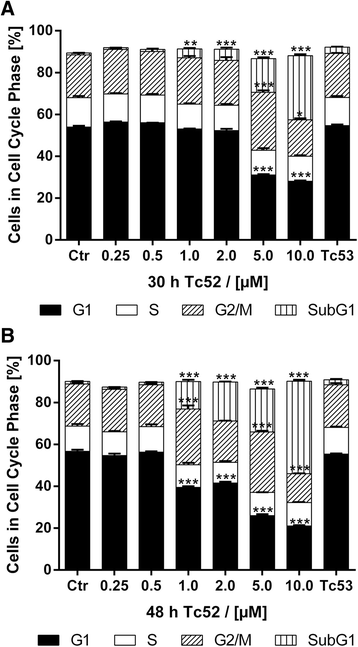
Dose-dependent changes in cell-cycle profile by Tc52. a: Cell-cycle distribution of HeLa cells after 30 h incubation with increasing concentrations of Tc52. Filled bars: G1; open bars: S; hatched bars: G2/M; vertical line bars: subG1. Dose-dependent increase (30-fold) in subG1 from 1 μM to 10 μM with significant decrease in G1 starting at 5 μM (2-fold), the latter accompanied by accumulation in G2/M (1.5-fold). Tc53 has no impact on cell-cycle distribution. b: Cell-cycle distribution of HeLa cells after 48 h incubation with increasing concentrations of Tc52. Filled bars: G1; Pointed bars: S; Hatched bars: G2/M; Open bars: subG1. Dose-dependent increase (44-fold) in subG1 from 1 μM to 10 μM concomitant with significant decrease in G1 (2.7-fold), accompanied by fluctual accumulation in G2/M. Tc53 has no impact on cell-cycle distribution. Treatments were compared to controls and significance was calculated by two-way ANOVA with Dunnett's Multiple Comparison Test. p < 0.05 = *, p < 0.01 = **, p < 0.001 = ***
Fig. 3
Fig. 3
Tc52 blocks cells in G2 and alters tubulin network. Treatment of HeLa tumor cells with toxins targeting different steps in M-phase in combination with Tc52. M-phase drugs were administered in increasing concentrations either alone or together with 6 μM Tc52 (EC50) for 24 h. a: Viability assays from treatments with cytochalasin B (CytB), colcemid (Col) or docetaxel (Doc) alone and in combination with 6 μM Tc52. Tc52 itself reduced viability to 77.1 % +/− 1.78 SEM. Tc52 together with CytB displays additive toxicity to CytB alone (parallel curves), whereas Tc52 acts protective in combination with high doses of Col or Doc, as evident from the Combination Index calculated by the algorithm of Chou and Talalay [38] (last panel, Col +/− 0.023 SEM, Doc +/− 0.032 SEM, compared to hypothetical value 1). b: Cell-cycle analysis of single and combinatory treatments after 24 h application of 4 μM cytochalasin B (CytB), 27 nM colcemid (Col) and 50 nM docetaxel (Doc) alone or in combination with 6 μM Tc52. Single treatments were compared to control or to the respective combination. Significance was calculated by two-way ANOVA with Dunnett's Multiple Comparison Test p < 0.05 = *, p < 0.01 = **, p < 0.001 = *** for comparison of treatments to control, and with two-tailed T-test between single and double treatments. Tc52 has no impact on cell-cycle profile, Col increases number of cells in G2/M (1.5-fold), accompanied by a drop in G1 (1.5-fold). This is more pronounced with CytB (1.8-fold and 28.8-fold, respectively) or Doc (2.3-fold and 23.3-fold, respectively). Cells in S-phase are significantly reduced, 6-fold with CytB and 3.6-fold with Doc. SubG1 is increased for Col (12.4-fold), CytB (6.8-fold) and Doc (17-fold). Tc52 addition does not change cell-cycle profile of Col treatment, but reduces number of cells with >4 N content in CytB and Doc treated samples 1.8-fold and 1.3-fold compared to single treatments, respectively. G2/M content and SubG1 are increased only compared to CytB treatment 1.4-fold and 1.3-fold, respectively. Filled bars: G1; Open bars: S; Hatched bars: G2/M; Pointed bars >4 N; Vertical line bars: subG1. c: Cells were treated for 24 h with toxins as in 3b, fixed with formaldehyde and analyzed by DAPI staining for the presence of mitotic figures. 100 cells/experiment were evaluated (in docetaxel-treated samples only 50 cells/experiment) in independent triplicates. The percentage of mitotic cells (Mitotic Index, MI) was calculated and values compared to control (*). In addition, double treated samples were compared to single treatments (+). Significance was calculated by two-tailed T-test, p < 0.01 = **/++, p < 0.001 = ***/+++. CytB reduced MI 3.6-fold, Col and Doc enhanced MI 2.1-fold and 11.4-fold, respectively. Tc52 severely reduces MI in all cases. d: Immunofluorescence analysis of actin and tubulin in drug-treated HeLa cells. Cells were treated and fixed as described in 3c. Tubulin was detected by indirect immunofluorescence whereas f-actin was directly detected by Atto488-coupled phalloidin. Control cells (Ctr) show normal mitosis (filled arrow) and proper actin and tubulin network. Tc52-treated samples display changes in cell morphology such as tubulin bundles at the cell periphery (open arrow) and alterations of f-actin pattern. Cytochalasin B (CytB) changes actin distribution, inducing either aggregation or dim f-actin staining as well as binuclear cells (asterisk). Tubulin is unaffected. Double treated samples (Tc52/CytB) show a combination of changes in f-actin as well as tubulin networks (open arrow), but lack bi-nuclear cells. Colcemid-treated cells (Col) display improper mitotic spindle formation and cells blocked in metaphase (filled arrow). Double treated samples (Tc52/Col) are free of mitotic figures and display altered tubulin network (open arrow). Docetaxel (Doc) induces high levels of mitotic cells (filled arrow) and lobed nuclei, accompanied by strong staining of short tubulin fibers and mitotic spindles. As cells are blocked in mitosis, it was not possible to evaluated changes in the actin network. Double treated samples (Tc52/Doc) completely lack mitoses, and arrangement of tubulin fibers is improved and cells display proper actin network
Fig. 4
Fig. 4
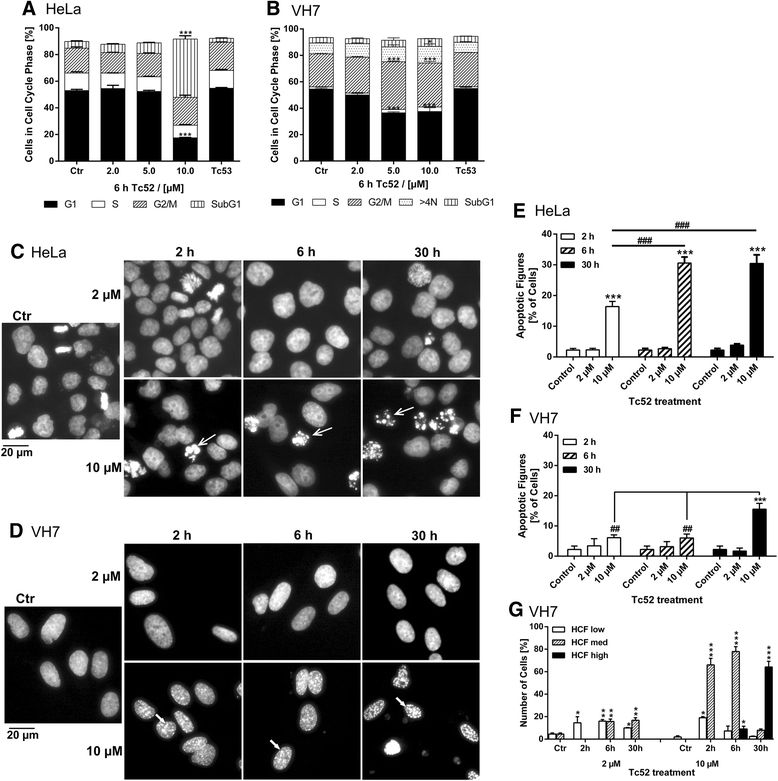
Tc52 induces apoptosis in HeLa but not in VH7 fibroblasts. HeLa and VH7 cells were exposed to three different Tc52 concentrations (2 μM, 5 μM, 10 μM) and 10 μM Tc53 for indicated time points, followed by incubation in toxin-free medium. Treatments were compared to controls and significance was calculated by two-way ANOVA with Dunnett's Multiple Comparison Test, p < 0.05 = *, p < 0.01 = **; p < 0.001 = ***. Significance between different time-points was calculated by one-way ANOVA with Tukey-Kramer Multiple Comparisons Test, p < 0.01 = ##; p < 0.001 = ###. a: Cell-cycle distribution of HeLa cells after 6 h Tc52 treatment and 24 h release reveals major increase in the subG1 fraction at 10 μM Tc52 (8.7-fold, accompanied by a loss of cells in G1 (3-fold). Tc53 has no effect. b: Cell-cycle distribution of VH7 after 6 h Tc52 treatment and 24 h release reveals accumulation in G2/M and increased >4 N-fraction accompanied by loss from G1 without increase in subG1 at 5 μM (1.5-fold G2/M, 1.4-fold >4 N, 1.5-fold G1) and 10 μM (1.3-fold G2/M, 1.5-fold >4 N, 1.3-fold G1) Tc52. Tc53 has no effect. c: Representative pictures of HeLa cells displaying dose- and time-dependent appearance of apoptotic figures (open arrows). Cells were treated with 2 μM or 10 μM Tc52 for 2 h, 6 h, or 30 h, washed, fixed with formaldehyde and nuclei were stained with DAPI. d: Representative pictures of normal VH7 fibroblasts displaying a dose- and time-dependent alteration of the nuclear structure, forming DAPI-rich foci (filled arrows). Cells were treated with 2 μM or 10 μM Tc52 for 2 h, 6 h, or 30 h, washed, fixed with formaldehyde and nuclei were stained with DAPI. e: Statistical evaluation of number apoptotic figures in HeLa cells from three independent experiments counting at least 100 cells each. Significant apoptosis induction compared to control (2.3 %) is detected in 10 μM Tc52 samples treated for 2 h (16.4 %) and rate increases with exposure to 6 h (30.6 % at 6 h and 30.5 % at 30 h). Significance of increase compared to control was analyzed by two-way ANOVA and Dunnett’s Multiple Comparison test (*), and differences between 10 μM treatments were calculated by one-way ANOVA and Tukey’s Multiple Comparison Test (#). f: Statistical evaluation of apoptotic figures in VH7 cells from three independent experiments counting at least 100 cells each. Significant increase in apoptotic cells compared to controls (2.2 %) is only detected in cultures exposed to 10 μM Tc52 for the complete 30 h (15.5 %). Significance of increase compared to control was analyzed by two-way ANOVA and Dunnett’s Multiple Comparison test (*), and differences between 10 μM treatment was calculated by one-way ANOVA and Tukey’s Multiple Comparison Test (#). g: Statistical evaluation of VH7 cells nuclei containing DAPI-rich foci. Foci were graded regarding their intensity over the nuclear DAPI background from three independent experiments counting at least 100 cells each. There is a clear dose- and time-dependent increase in the number of cells displaying DAPI-bright foci with a shift from low-grade to high-grade foci. Significance was calculated by two-way ANOVA and Dunnett’s Multiple Comparison Test (*)
Fig. 5
Fig. 5
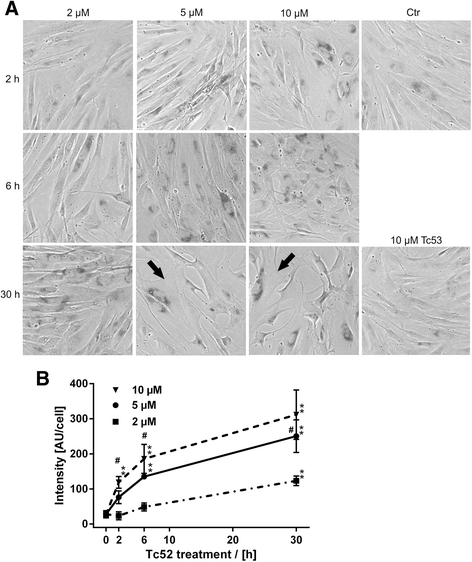
Tc52 induces senescence in VH7 fibroblasts. VH7 fibroblasts were treated as indicated in Fig. 4, including an additional 5 μM Tc52 concentration, for measuring SAβGal-activity. There is a clear increase in cells with active SAβGal as well as changes in cellular morphology, i.e., enlargement and flattening (panel a, black arrows). Lower panel b displays evaluation of SAβGal-activity. There is a significant dose- and time-dependent increase in SAβGal-activity per cell. Different doses at one time-point were compared and significance was calculated by one-way ANOVA with Bonferroni Multiple Comparison Test (#). Significant dose-dependency is detected at all time points except for 30 h, which shows difference between 2 μM and 5 μM or 10 μM, but not between 5 μM and 10 μM Tc52. Individual doses over time were compared to controls and significance was calculated by one-way ANOVA with Dunnett's Multiple Comparison Test, p < 0.01 = **
Fig. 6
Fig. 6
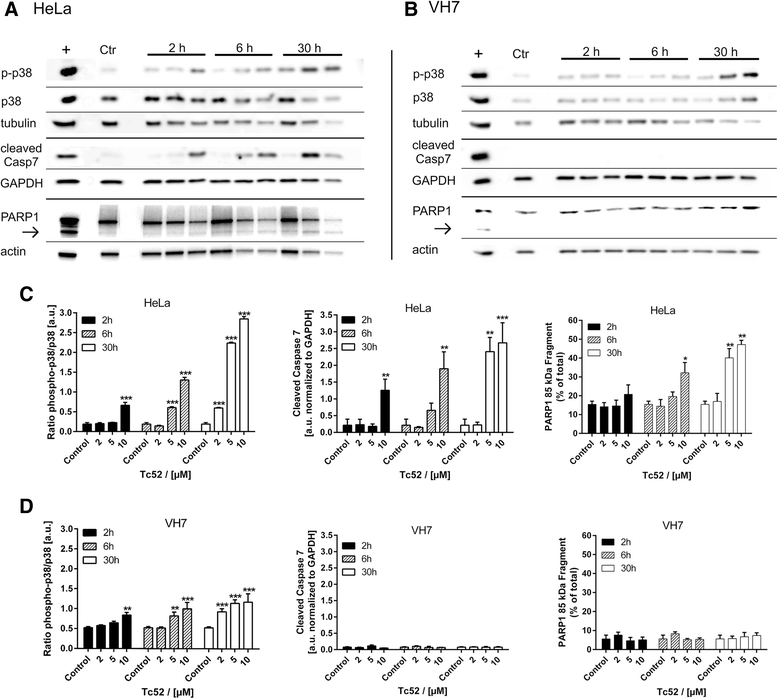
Activation of p38 stress-kinase, caspase7 and PARP1 cleavage by Tc52 in HeLa and VH7 fibroblasts. Treatment regimen was as described for Fig. 4. Ctr: solvent treated samples, +: positive control. Shown below each incubation time (2 h, 6 h, 30 h) are the different Tc52 concentrations used, i.e., 2 μM, 5 μM, and 10 μM. For statistical analysis, ratio of ECL signals of target protein compared to the respective loading control was calculated. Significant changes compared to solvent-control were analyzed by two-way ANOVA with Dunnett's Multiple Comparison Test, p < 0.05 = *; p < 0.01 = **; p < 0.001 = ***. a: Respective western blot panel for HeLa cells, displaying levels of phosphorylated p38 (p-p38) stress kinase, total p38 (p38), α-tubulin, cleaved caspase7, GAPDH, PARP1 and 85-kDa apoptotic fragment (arrow), and β-actin. b: Respective western blot panel for VH7 fibroblasts, displaying levels of phosphorylated p38 (p-p38) stress kinase, total p38 (p38), α-tubulin, cleaved caspase7, GAPDH, PARP1 and 85-kDa apoptotic fragment (arrow), and β-actin. c: Evaluation of stress-response in HeLa cells from at least three independent experiments. Panels display ratios of p-p38/p38, cleaved caspase7/GAPDH and PARP1 85 kDa/total, which all increase significantly in a time- and dose-dependent manner. d: Evaluation of stress-response in VH7 fibroblasts from at least three independent experiments. Panels display ratios of p-p38/p38, cleaved caspase7/GAPDH and PARP1 85 kDa/total. Only p38-dependent stress response increases significantly in a time- and dose-dependent manner without any signs of apoptotic alterations (cleavage of caspase7 or PARP1)
Fig. 7
Fig. 7
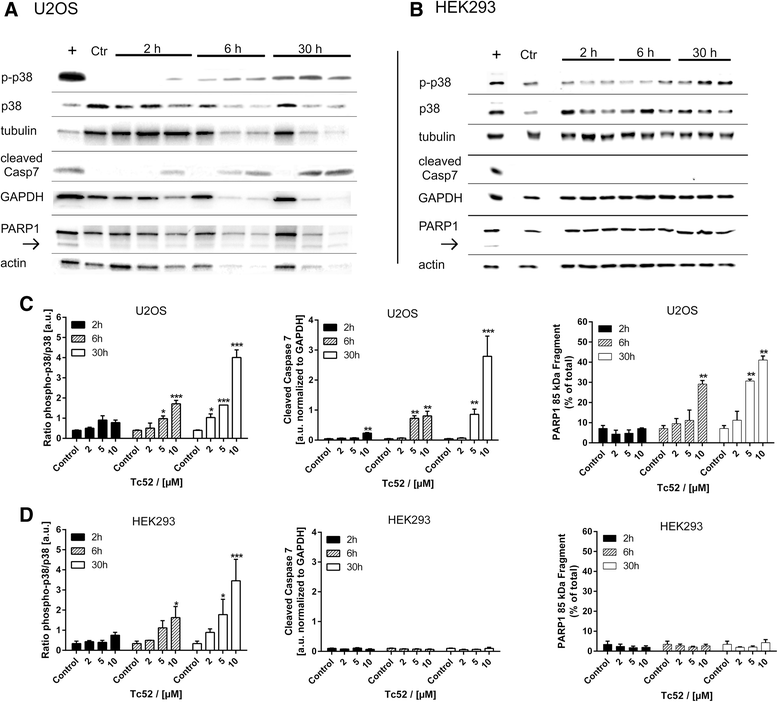
Activation of p38 stress-kinase, caspase7 and PARP1 cleavage by Tc52 in U2OS and HEK293. Treatment regimen was as described for Fig. 4. Ctr: solvent treated samples, +: positive control. Shown below each incubation time (2 h, 6 h, 30 h) are the different Tc52 concentrations used, i.e., 2 μM, 5 μM, and 10 μM. For statistical analysis, ratio of ECL signals of target protein compared to the respective loading control was calculated. Significant changes compared to solvent-control were analyzed by two-way ANOVA with Dunnett's Multiple Comparison Test, p < 0.05 = *; p < 0.01 = **; p < 0.001 = ***. a: Respective western blot panel for U2OS cells, displaying levels of phosphorylated p38 (p-p38) stress kinase, total p38 (p38), α-tubulin, cleaved caspase7, GAPDH, PARP1 and 85-kDa apoptotic fragment (arrow), and β-actin. b: Respective western blot panel for HEK293 cells, displaying levels of phosphorylated p38 (p-p38) stress kinase, total p38 (p38), α-tubulin, cleaved caspase7, GAPDH, PARP1 and 85-kDa apoptotic fragment (arrow), and β-actin. c: Evaluation of stress-response in U2OS cells from at least three independent experiments. Panels display ratios of p-p38/p38, cleaved caspase7/GAPDH and PARP1 85 kDa/total, which all increase significantly in a time- and dose-dependent manner. d: Evaluation of stress-response in HEK293 from at least three independent experiments. Panels display ratios of p-p38/p38, cleaved caspase7/GAPDH and PARP1 85 kDa/total. Only p38-dependent stress response increases significantly in a time- and dose-dependent manner without any signs of apoptotic alterations (cleavage of caspase7 or PARP1)

Similar articles

Cited by

References

    1. Lohia S, Rajapurkar M, Nguyen SA, Sharma AK, Gillespie MB, Day TA. A Comparison of Outcomes Using Intensity-Modulated Radiation Therapy and 3-Dimensional Conformal Radiation Therapy in Treatment of Oropharyngeal Cancer. JAMA Otolaryngol Head Neck Surg. 2014. - PubMed
    1. Durante M. New challenges in high-energy particle radiobiology. Br J Radiol. 2014. - PMC - PubMed
    1. Mima M, Demizu Y, Jin D, Hashimoto N, Takagi M, Terashima K, Fujii O, Niwa Y, Akagi T, Daimon T, et al. Particle therapy using carbon ions or protons as a definitive therapy for patients with primary sacral chordoma. Br J Radiol. 2014;87(1033):20130512. doi: 10.1259/bjr.20130512. - DOI - PMC - PubMed
    1. Puisset F, Schmitt A, Chatelut E. Standardization of chemotherapy and individual dosing of platinum compounds. Anticancer Res. 2014;34(1):465–70. - PubMed
    1. Griffiths TR. Current perspectives in bladder cancer management. Int J Clin Pract. 2013;67(5):435–48. doi: 10.1111/ijcp.12075. - DOI - PubMed

Publication types

MeSH terms