Energetics of muscle contraction: further trials
- PMID: 27412384
- PMCID: PMC10717381
- DOI: 10.1007/s12576-016-0470-3
Energetics of muscle contraction: further trials
Abstract
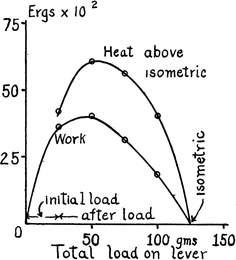
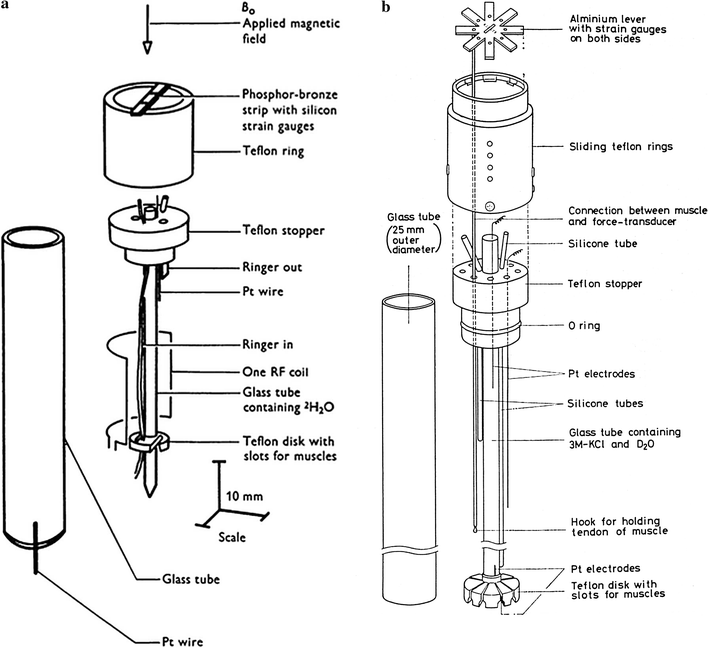
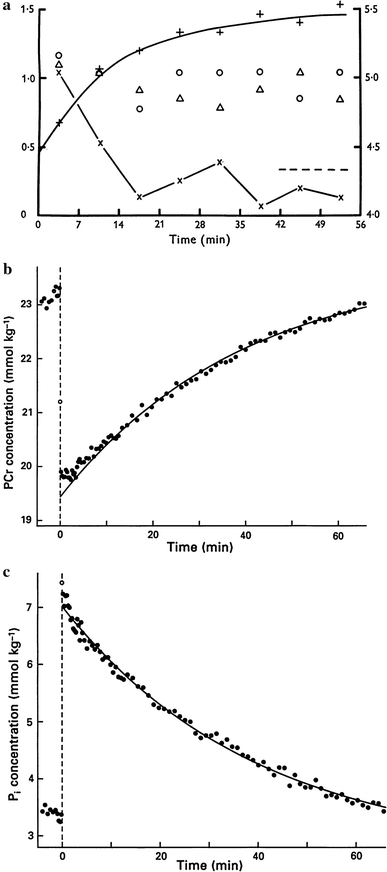
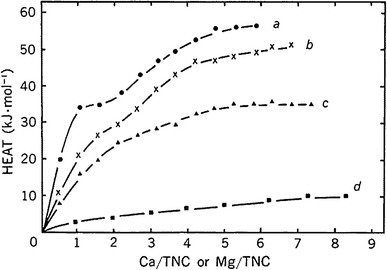
Knowledge accumulated in the field of energetics of muscle contraction has been reviewed in this article. Active muscle converts chemical energy into heat and work. Therefore, measurements of heat production and mechanical work provide the framework for understanding the process of energy conversion in contraction. In the 1970s, precise comparison between energy output and the associated chemical reactions was performed. It has been found that the two do not match in several situations, resulting in an energy balance discrepancy. More recently, efforts in resolving these discrepancies in the energy balance have been made involving chemical analysis, phosphorus nuclear magnetic resonance spectroscopy, and microcalorimetry. Through reviewing the evidence from these studies, the energy balance discrepancy developed early during isometric contraction has become well understood on a quantitative basis. In this situation energy balance is established when we take into account the binding of Ca to sarcoplasmic proteins such as troponin and parvalbumin, and also the shift of cross-bridge states. On the other hand, the energy balance discrepancy observed during rapid shortening still remains to be clarified. The problem may be related to the essential mechanism of cross-bridge action.
Keywords: 31P NMR; Actomyosin; Calcium binding proteins; Calorimetry; Energy balance; MRS; Muscle heat production.
Conflict of interest statement
The author declares that he has no conflict of interest.
Figures




Similar articles
-
Heat, phosphorus NMR and microcalorimetry in relation to the mechanism of filament sliding.Adv Exp Med Biol. 2005;565:193-202; discussion 203, 379-95. doi: 10.1007/0-387-24990-7_15. Adv Exp Med Biol. 2005. PMID: 16106976
-
A distribution-moment model of energetics in skeletal muscle.J Biomech. 1991;24(1):21-35. doi: 10.1016/0021-9290(91)90323-f. J Biomech. 1991. PMID: 2026631
-
Advances in understanding the energetics of muscle contraction.J Biomech. 2023 Jul;156:111669. doi: 10.1016/j.jbiomech.2023.111669. Epub 2023 Jun 5. J Biomech. 2023. PMID: 37302165 Review.
-
Energetics of contraction.Compr Physiol. 2015 Apr;5(2):961-95. doi: 10.1002/cphy.c140038. Compr Physiol. 2015. PMID: 25880520 Review.
-
Hypothesis: Single Actomyosin Properties Account for Ensemble Behavior in Active Muscle Shortening and Isometric Contraction.Int J Mol Sci. 2020 Nov 9;21(21):8399. doi: 10.3390/ijms21218399. Int J Mol Sci. 2020. PMID: 33182367 Free PMC article.
Cited by
-
Biology and bioinspiration of soft robotics: Actuation, sensing, and system integration.iScience. 2021 Sep 1;24(9):103075. doi: 10.1016/j.isci.2021.103075. eCollection 2021 Sep 24. iScience. 2021. PMID: 34568796 Free PMC article. Review.
-
Mechanism of elastic energy storage of honey bee abdominal muscles under stress relaxation.J Insect Sci. 2023 May 1;23(3):2. doi: 10.1093/jisesa/iead026. J Insect Sci. 2023. PMID: 37220090 Free PMC article.
-
Sphingosine-1-phosphate pretreatment amends hypoxia-induced metabolic dysfunction and impairment of myogenic potential in differentiating C2C12 myoblasts by stimulating viability, calcium homeostasis and energy generation.J Physiol Sci. 2018 Mar;68(2):137-151. doi: 10.1007/s12576-016-0518-4. Epub 2017 Jan 9. J Physiol Sci. 2018. PMID: 28070865 Free PMC article.
-
Intramuscular Temperature Changes in the Quadriceps Femoris Muscle After Post-Exercise Cold-Water Immersion (10°C for 10 min): A Systematic Review With Meta-Analysis.Front Sports Act Living. 2021 May 6;3:660092. doi: 10.3389/fspor.2021.660092. eCollection 2021. Front Sports Act Living. 2021. PMID: 34027405 Free PMC article.
-
Insights into muscle metabolic energetics: Modelling muscle-tendon mechanics and metabolic rates during walking across speeds.PLoS Comput Biol. 2024 Sep 13;20(9):e1012411. doi: 10.1371/journal.pcbi.1012411. eCollection 2024 Sep. PLoS Comput Biol. 2024. PMID: 39269982 Free PMC article.
References
-
- Woledge RC, Curtin NA, Homsher E. Energetic aspects of muscle contraction. London: Academic Press; 1985. - PubMed
-
- Woledge RC. Heat production and chemical change in muscle. In: Butler JAV, Noble D, editors. Progress in biophysics and molecular biology. Pergamon: Oxford; 1971.
Publication types
MeSH terms
Substances
LinkOut - more resources
Full Text Sources
Other Literature Sources

