. 2016 Sep;204(1):337-53.
doi: 10.1534/genetics.116.190678. Epub 2016 Jul 13.

Effector-Triggered Immune Response in Arabidopsis thaliana Is a Quantitative Trait

Affiliations

Effector-Triggered Immune Response in Arabidopsis thaliana Is a Quantitative Trait

Michail Iakovidis et al. Genetics. 2016 Sep.

Abstract

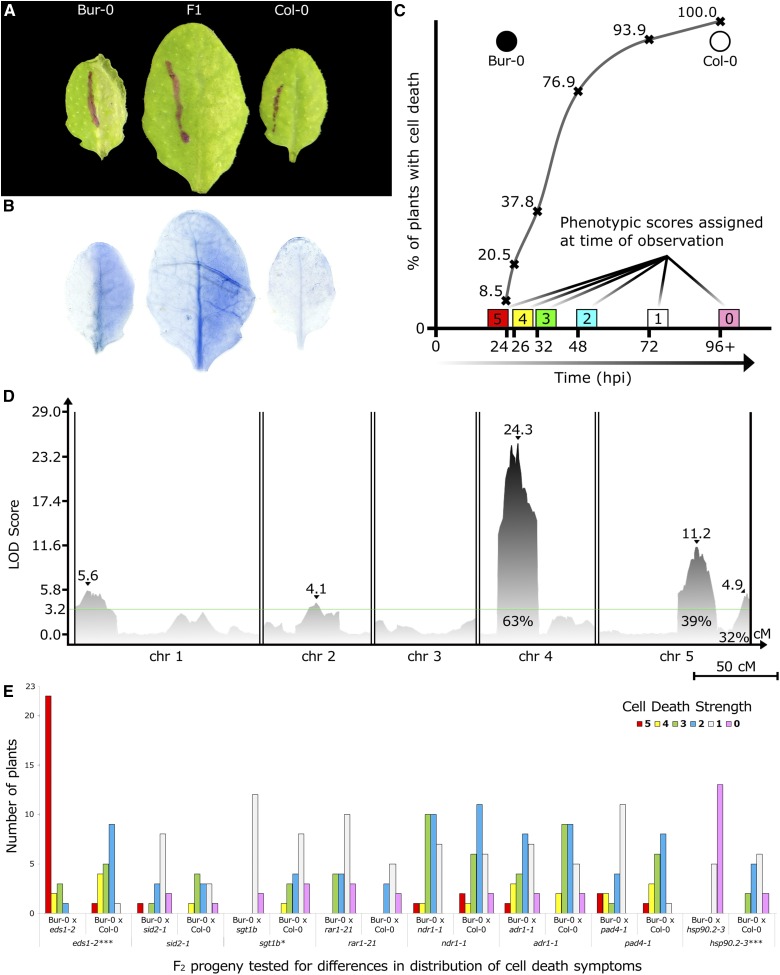
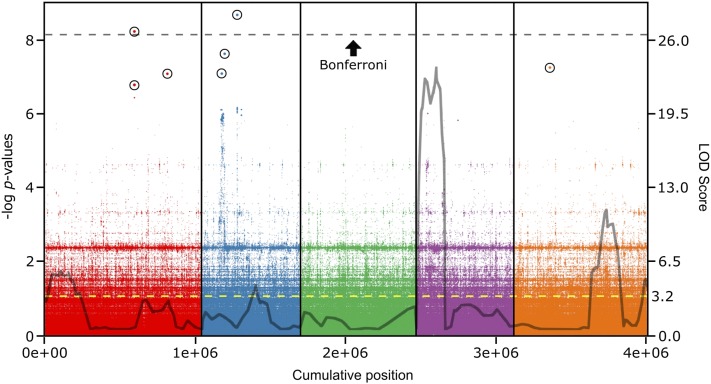
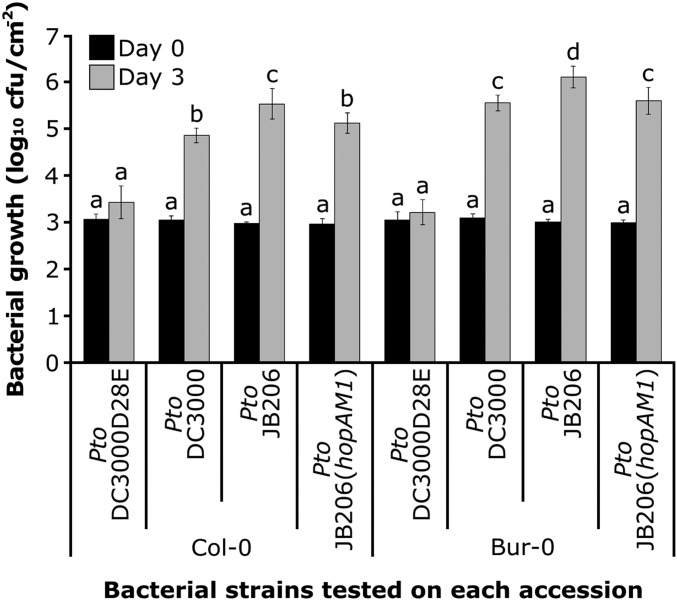
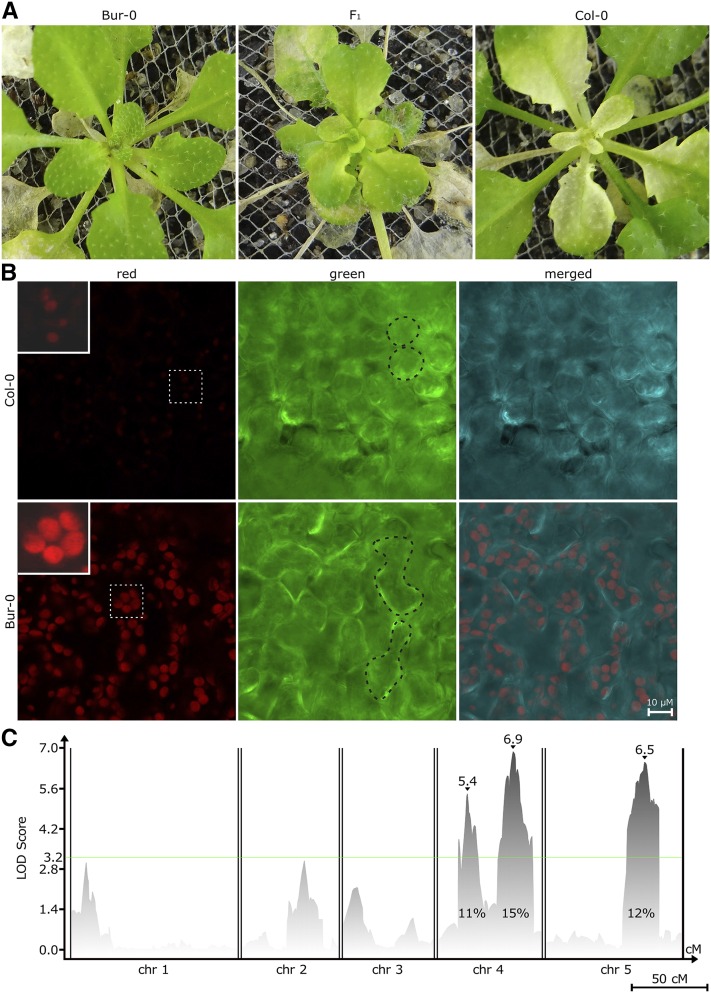
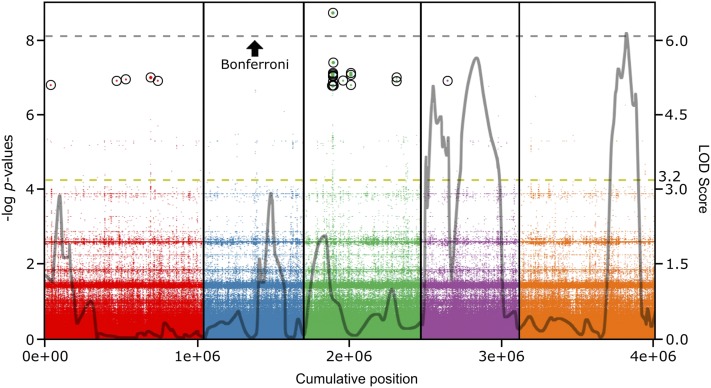
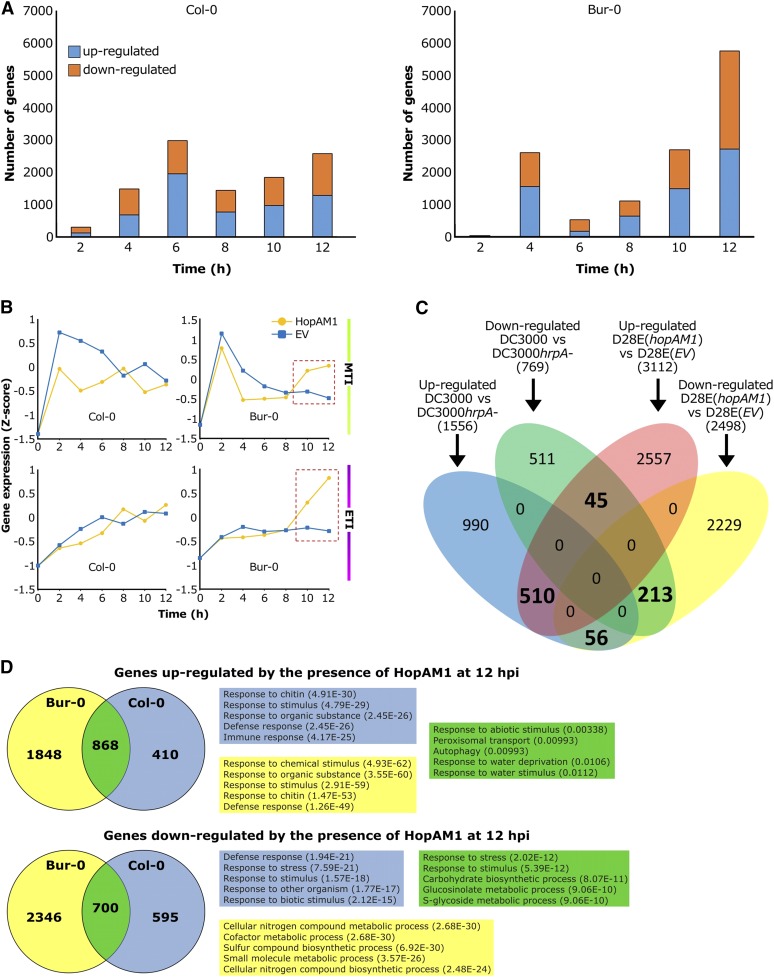
We identified loci responsible for natural variation in Arabidopsis thaliana (Arabidopsis) responses to a bacterial pathogen virulence factor, HopAM1. HopAM1 is a type III effector protein secreted by the virulent Pseudomonas syringae strain Pto DC3000. Delivery of HopAM1 from disarmed Pseudomonas strains leads to local cell death, meristem chlorosis, or both, with varying intensities in different Arabidopsis accessions. These phenotypes are not associated with differences in bacterial growth restriction. We treated the two phenotypes as quantitative traits to identify host loci controlling responses to HopAM1. Genome-wide association (GWA) of 64 Arabidopsis accessions identified independent variants highly correlated with response to each phenotype. Quantitative trait locus (QTL) mapping in a recombinant inbred population between Bur-0 and Col-0 accessions revealed genetic linkage to regions distinct from the top GWA hits. Two major QTL associated with HopAM1-induced cell death were also associated with HopAM1-induced chlorosis. HopAM1-induced changes in Arabidopsis gene expression showed that rapid HopAM1-dependent cell death in Bur-0 is correlated with effector-triggered immune responses. Studies of the effect of mutations in known plant immune system genes showed, surprisingly, that both cell death and chlorosis phenotypes are enhanced by loss of EDS1, a regulatory hub in the plant immune-signaling network. Our results reveal complex genetic architecture for response to this particular type III virulence effector, in contrast to the typical monogenic control of cell death and disease resistance triggered by most type III effectors.

Keywords: Arabidopsis thaliana; HopAM1; Pseudomonas syringae; QTL; genetics of immunity; type III effectors.


Figures

Figure 1
Figure 1
HopAM1 induces variable cell death symptoms of multigenic inheritance in A. thaliana accessions. (A) HopAM1-induced cell death in Bur-0, Col-0, and F1 progeny at 48 hpi after hand inoculation with Pto DC3000D28E(hopAM1). OD600 = 0.1 (∼5 × 10⁷ CFU/ml). Bur-0 exhibits one of the strongest onsets of symptoms as early as 23 hpi, while Col-0 exhibits only chlorosis starting ∼96 hpi. F1 progeny become symptomatic ∼48 hpi. (B) Cell death shown with trypan blue staining on the same leaves as above (48 hpi). (C) Sigmoid distribution of cell death symptoms representative of quantitative traits. The quantification of cell death at specific time points postinoculation is shown. Curve shows the percentage of plants in a Bur-0 × Col-0 RIL population that exhibit cell death symptoms at a given time point. ● = Bur-0; ○ = Col-0. (D) CIM on 342 reannotated RILs from a Col-0 × Bur-0 collection. The x-axis displays chromosomes 1 through 5 with map distances in cM. Peak LOD scores are shown by ▾ along with their values. Effects on phenotype variation are shown as percentages for QTL4 and QTL5A. The global permutation level of significance was set on LOD 3.2. Chr, chromosome. Bar, 50 cM. (E) Distribution of HopAM1-induced cell death scores among different F2 progeny between Bur-0 and mutant lines. The y-axis shows number of plants selected from each population with each phenotype score for HopAM1-induced cell death (5 = Bur-0, 0 = Col-0). Statistical significance between distributions was based on two-way ANOVA tests for each pair (statistical significance: *** P ≤ 0.001, * P ≤ 0.05).
Figure 2
Figure 2
The genetic architecture of HopAM1 cell death response defined by GWA depends on several loci with strong to moderate effects. HopAM1-induced cell death response was scored in a collection of 64 Arabidopsis accessions. EMMAX was used for GWA mapping based on whole-genome sequence data of >4 million SNPs. The Manhattan plot shows the association of each SNP and its P-value across the five Arabidopsis chromosomes (1 through 5 from left to right, separated by vertical lines). The dotted line designates the significance threshold for Bonferroni correction (P ≤ 1.2 × 10⁻⁸). All SNPs over the FDR threshold are highlighted with a circle. Gray outline reprises the QTL regions identified in Figure 1D in the Bur-0 × Col-0 background (cM converted to Mb only for each genetic marker’s coordinates on the genome and shows LOD score at that specific location; not identical, but very similar to peak LOD scores shown in previous QTL analysis in Figure 1D). Right y-axis, LOD score; yellow dotted line, significance threshold for CIM.
Figure 3
Figure 3
HopAM1 causes reduced growth of P. syringae in Col-0 and Bur-0 accessions, independent of cell death symptoms. Bacterial growth in Col-0 and Bur-0 accessions. The experiment is representative of five independent replicates; two times the SE between the means is noted by error bars. A weighted ANOVA test was applied to the difference in growth of the strains carrying hopAM1 (Pto DC3000 and Pto JB206+AM1) compared with the growth of the hopAM1 deleted strain (Pto JB206). Statistical significance is indicated by letters based on the weighted ANOVA test (P < 0.1).
Figure 4
Figure 4
HopAM1 induces rosette chlorosis affecting chloroplast development and cell morphology controlled by three QTL in Col-0 × Bur-0. (A) Meristem chlorosis response following bacterial vacuum infiltration with Pto DC3000D28E(hopAM1). Col-0 exhibits strong chlorosis symptoms, while Bur-0 does not. F1 progeny exhibit mild symptoms. Chlorosis appears in newly emerging leaf and meristem in Col-0 at 10 dpi following vacuum infiltration. Chlorosis can be observed up to 21 dpi. (B) Confocal laser scanning microscopy of Arabidopsis accessions Col-0 and Bur-0 leaf tissue, harvested 14 dpi following vacuum infiltration with Pto DC3000D28E(hopAM1). Chlorophyll autofluorescence (enlarged and brightened insets with white dotted outline shown on the top left corner of respective panel) (red channel), plant cell shape (black dotted outline of cells) (green channel), and merged channels are shown for each accession. Upper and lower panels taken at equal light intensity. Bar, 10 μm. (C) CIM on 342 reannotated RILs from a Col-0 × Bur-0 collection. The x-axis displays chromosomes 1 through 5 with map distances in cM. Peak LOD scores are shown by ▾ along with their values. Effects on phenotype variation are shown as percentages for all three QTL. The global permutation level of significance was set on LOD 3.2. Bar, 50 cM.
Figure 5
Figure 5
The genetic architecture of the HopAM1 chlorosis response defined by GWA is associated with a single locus on chromosome 3. HopAM1-induced chlorosis was scored in a collection of 64 Arabidopsis accessions as for Figure 2. Nearly all top 10 hits were inside genes. Gray outline reprises the QTL regions identified in Figure 4C in the Bur-0 × Col-0 background (cM converted to Mb only for each genetic marker’s coordinates on the genome and shows LOD score at that specific location; not identical, but very similar to peak LOD scores shown in previous QTL analysis in Figure 4C). Right y-axis, LOD score; yellow-dotted line, significance threshold for CIM.
Figure 6
Figure 6
HopAM1 induces intense transcriptional reprogramming for thousands of genes in Col-0 and Bur-0, results in initial suppression of MTI in both ecotypes and later induction of ETI in Bur-0 only. (A) Number of genes (y-axis) differentially expressed as a result of HopAM1 delivery in Col-0 and Bur-0 every 2 hr (x-axis) in the first 12 hr postinfiltration. Orange bar, downregulated; blue bar, upregulated. (B) Upper panel: average expression profile of flg22-induced genes within the same time period in Col-0 and Bur-0. Lower panel: average expression profile of genes upregulated by ETI induced upon recognition of the avrRps4 avirulence factor by the NLR protein Rps4 in Col-0. Gene expression is shown as the median z-scored transformed RPKM values of the 1418 and 718 marker genes for MTI and ETI, respectively. (C) Overlap between genes differentially expressed by Pto DC3000D28E(hopAM1) infection and those specifically misregulated by Pto DC3000 effectors. A total of 5610 genes that were differentially expressed in Col-0 in at least one time point of our experiment were included in the analysis. A set of 517 genes showing ambiguous regulation (i.e., both up- and downregulation at different time points) was discarded. (D) Venn diagrams showing number of genes upregulated and downregulated at 12 hpi for both Bur-0 and Col-0. GOs for the top five sets are shown for each group.

References

    1. 1001 Genomes Project Consortium , 2016. 1,135 genomes reveal the global pattern of polymorphism in Arabidopsis thaliana. Cell 166: 481–491. - PMC - PubMed
    1. Anders S., Pyl P. T., Huber W., 2015. HTSeq—a Python framework to work with high-throughput sequencing data. Bioinformatics 31: 166–169. - PMC - PubMed
    1. Arnold D. L., Jackson R. W., Fillingham A. J., Goss S. C., Taylor J. D., et al. , 2001. Highly conserved sequences flank avirulence genes: isolation of novel avirulence genes from Pseudomonas syringae pv. pisi. Microbiology 147: 1171–1182. - PubMed
    1. Aronsson H., Boij P., Patel R., Wardle A., Töpel M., et al. , 2007. Toc64/OEP64 is not essential for the efficient import of proteins into chloroplasts in Arabidopsis thaliana. Plant J. 52: 53–68. - PubMed
    1. Atwell S., Huang Y. S., Vilhjálmsson B. J., Willems G., Horton M., et al. , 2010. Genome-wide association study of 107 phenotypes in a common set of Arabidopsis thaliana inbred lines. Nature 465: 627–631. - PMC - PubMed

MeSH terms

LinkOut - more resources