

Robust high-performance nanoliter-volume single-cell multiple displacement amplification on planar substrates
- PMID: 27412862
- PMCID: PMC4968760
- DOI: 10.1073/pnas.1520964113
Robust high-performance nanoliter-volume single-cell multiple displacement amplification on planar substrates
Abstract
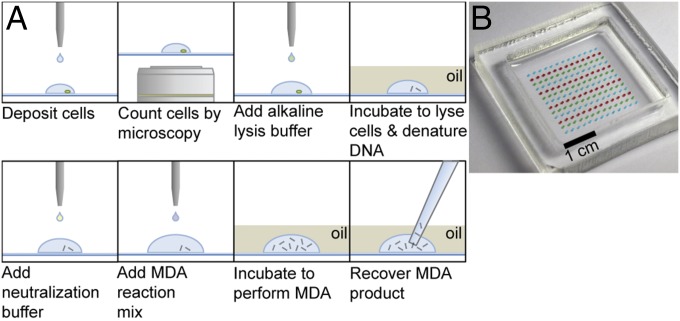
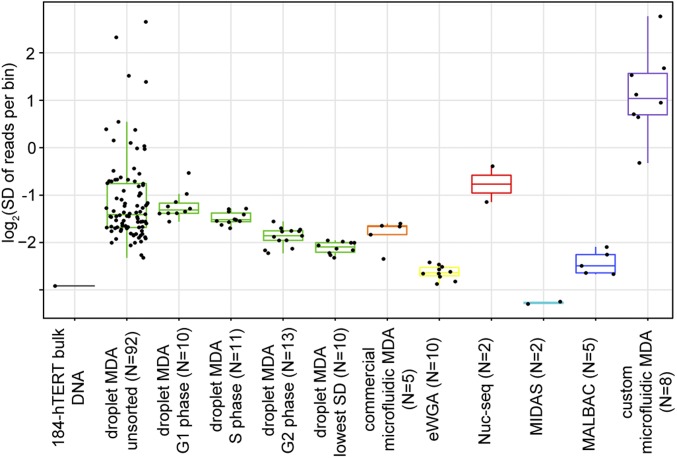
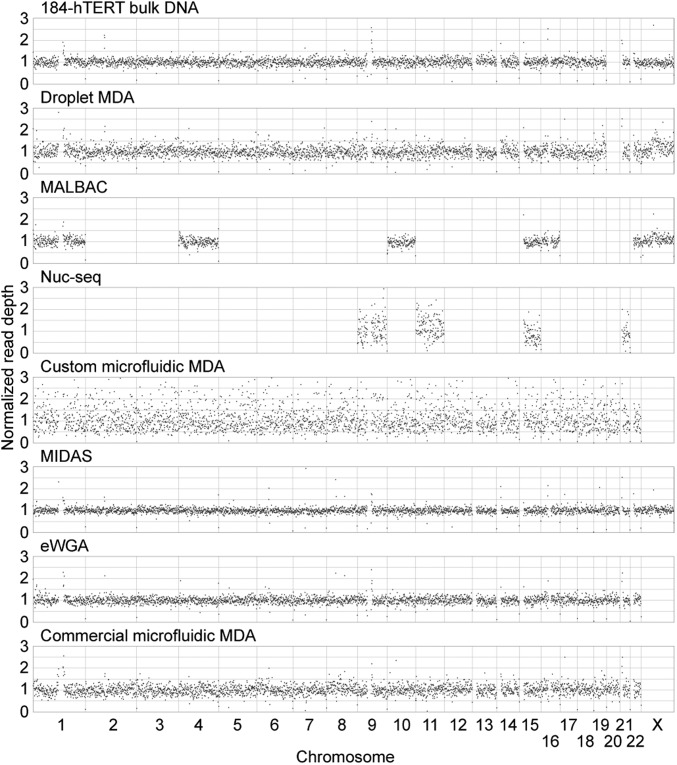
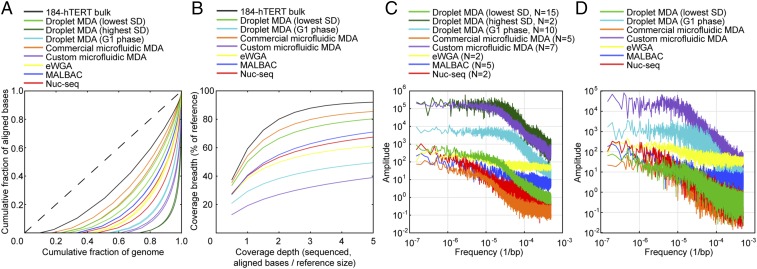
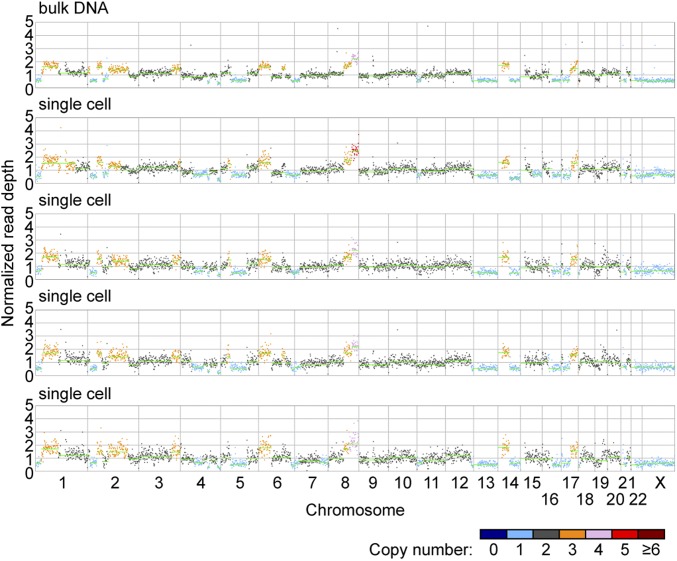
The genomes of large numbers of single cells must be sequenced to further understanding of the biological significance of genomic heterogeneity in complex systems. Whole genome amplification (WGA) of single cells is generally the first step in such studies, but is prone to nonuniformity that can compromise genomic measurement accuracy. Despite recent advances, robust performance in high-throughput single-cell WGA remains elusive. Here, we introduce droplet multiple displacement amplification (MDA), a method that uses commercially available liquid dispensing to perform high-throughput single-cell MDA in nanoliter volumes. The performance of droplet MDA is characterized using a large dataset of 129 normal diploid cells, and is shown to exceed previously reported single-cell WGA methods in amplification uniformity, genome coverage, and/or robustness. We achieve up to 80% coverage of a single-cell genome at 5× sequencing depth, and demonstrate excellent single-nucleotide variant (SNV) detection using targeted sequencing of droplet MDA product to achieve a median allelic dropout of 15%, and using whole genome sequencing to achieve false and true positive rates of 9.66 × 10(-6) and 68.8%, respectively, in a G1-phase cell. We further show that droplet MDA allows for the detection of copy number variants (CNVs) as small as 30 kb in single cells of an ovarian cancer cell line and as small as 9 Mb in two high-grade serous ovarian cancer samples using only 0.02× depth. Droplet MDA provides an accessible and scalable method for performing robust and accurate CNV and SNV measurements on large numbers of single cells.
Keywords: microdroplet; multiple displacement amplification; nanoliter volume; single-cell sequencing; whole genome amplification.
Conflict of interest statement
Conflict of interest statement: K.L., A.K., S.A., S.P.S., and C.L.H. are coinventors on a patent application (PCT/CA2016/000031) that covers the methods and devices described in this paper, and have a potential financial interest in this work through the revenue-sharing policies of the University of British Columbia. Following submission of this manuscript, the aforementioned patent was exclusively licensed to AbCellera (
Figures
References
-
- Hou Y, et al. Single-cell exome sequencing and monoclonal evolution of a JAK2-negative myeloproliferative neoplasm. Cell. 2012;148(5):873–885. - PubMed
Publication types
MeSH terms
LinkOut - more resources
Full Text Sources
Other Literature Sources
Miscellaneous
