. 2016 Aug 9;113(32):8927-32.
doi: 10.1073/pnas.1601472113. Epub 2016 Jul 13.

Thermodynamic control of anvil cloud amount

Affiliations

Thermodynamic control of anvil cloud amount

Sandrine Bony et al. Proc Natl Acad Sci U S A. .

Abstract

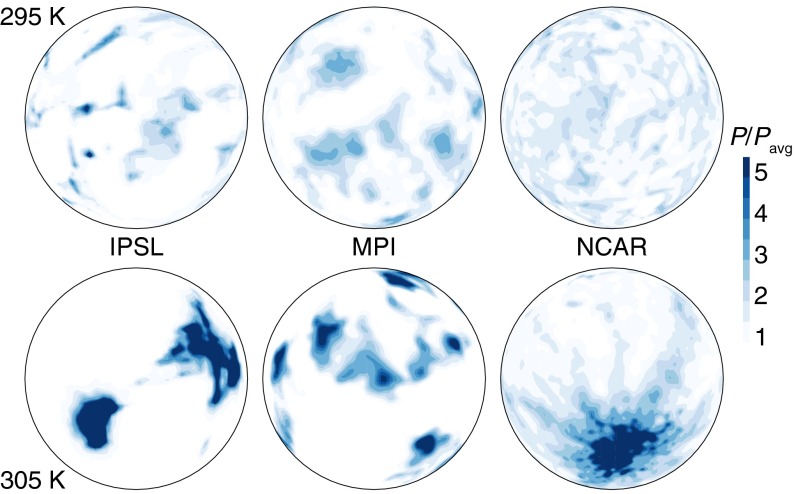
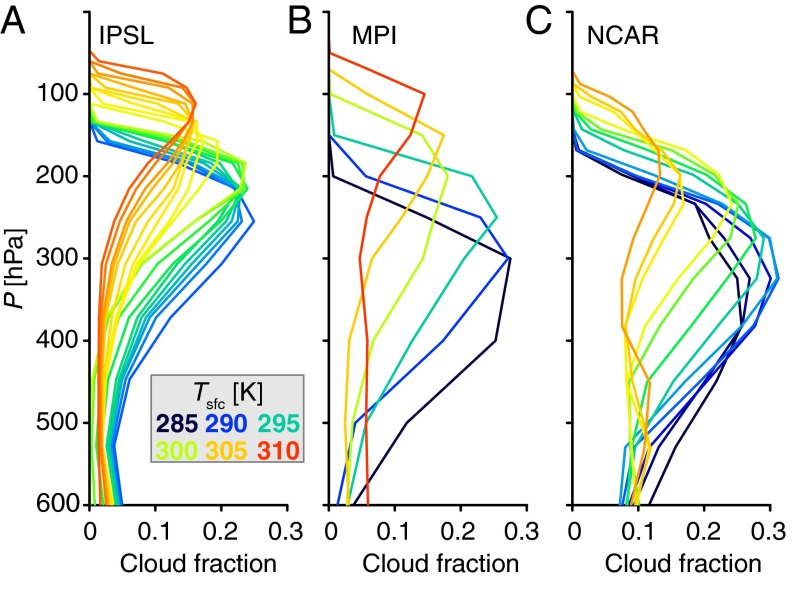
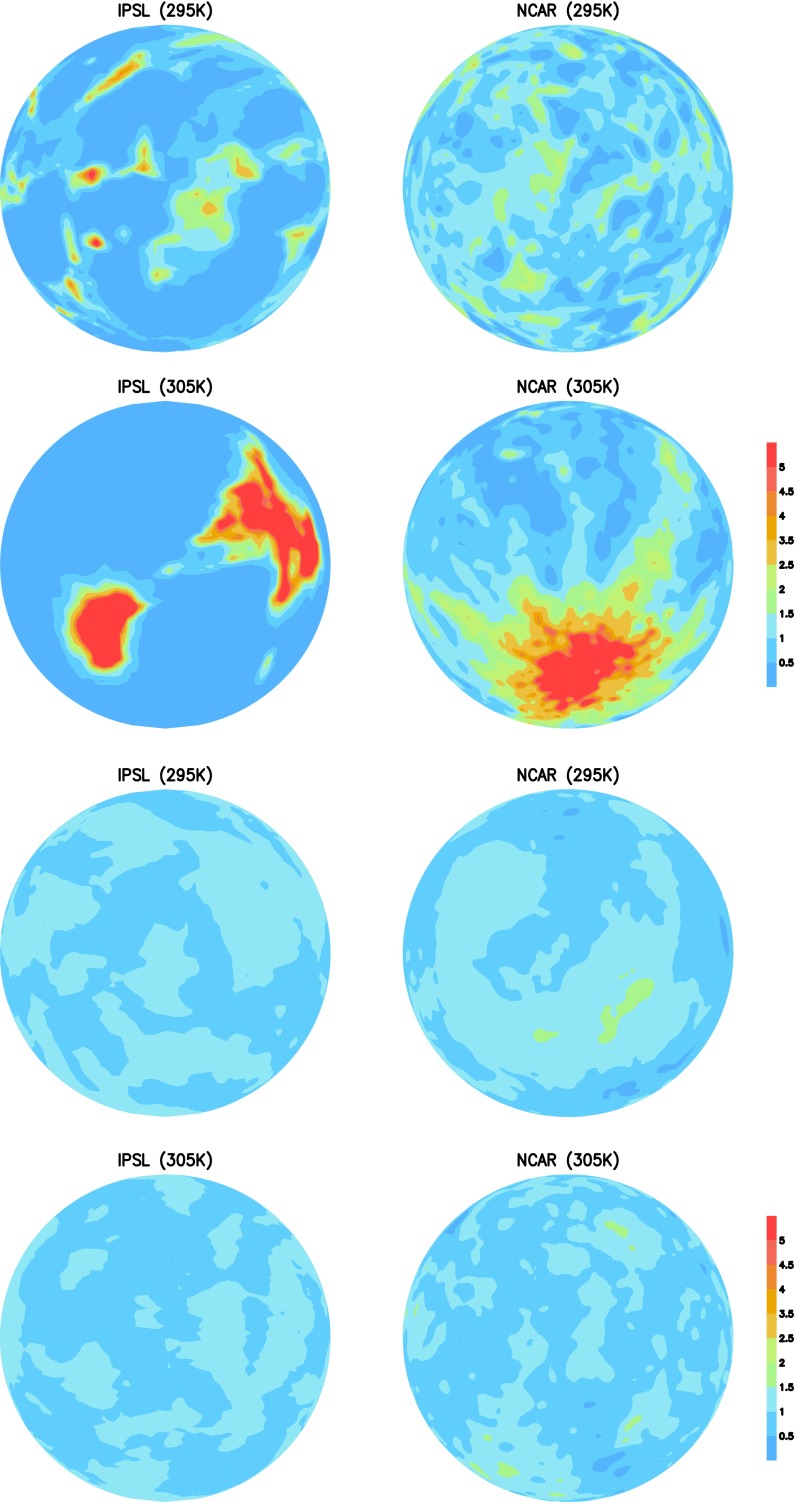
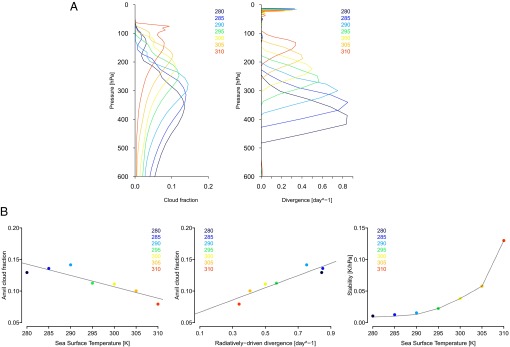
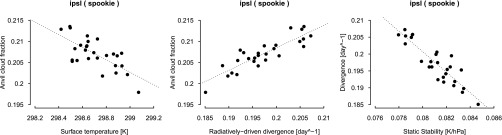
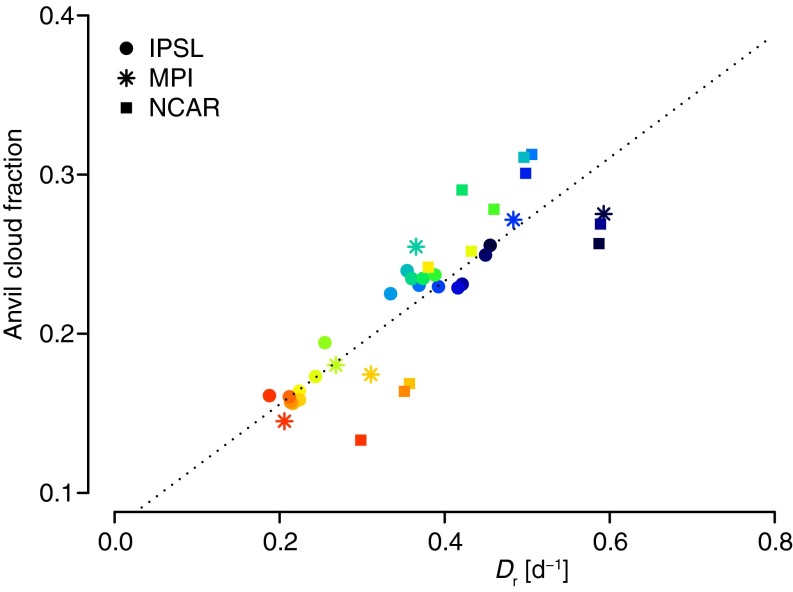
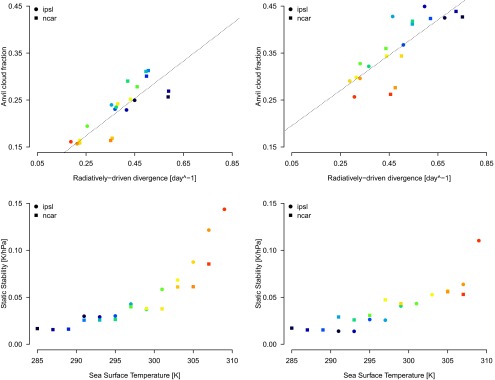
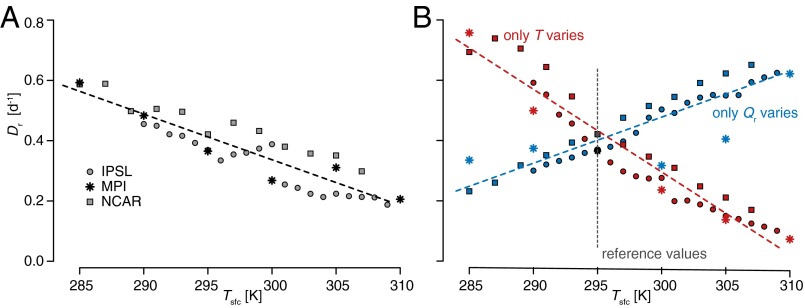
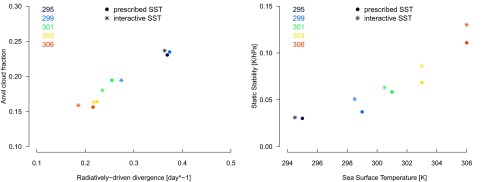
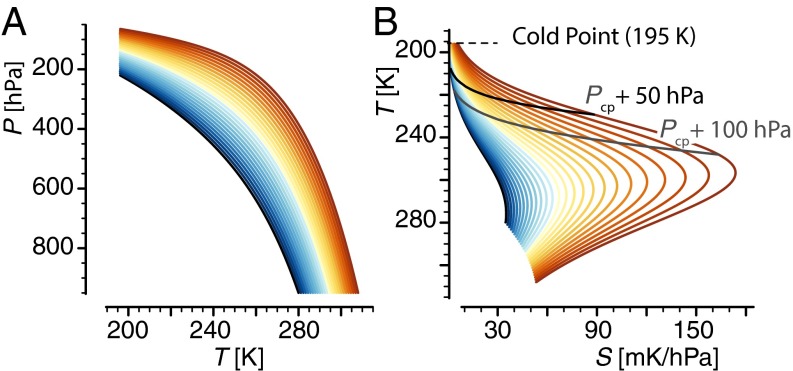
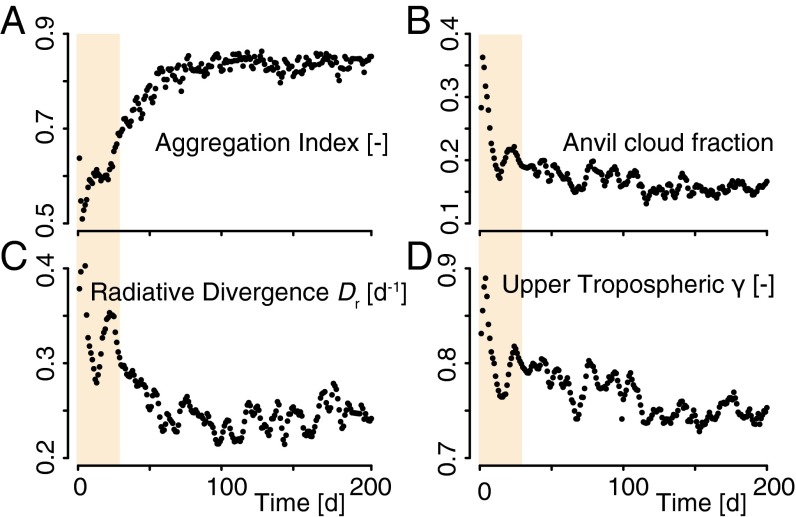
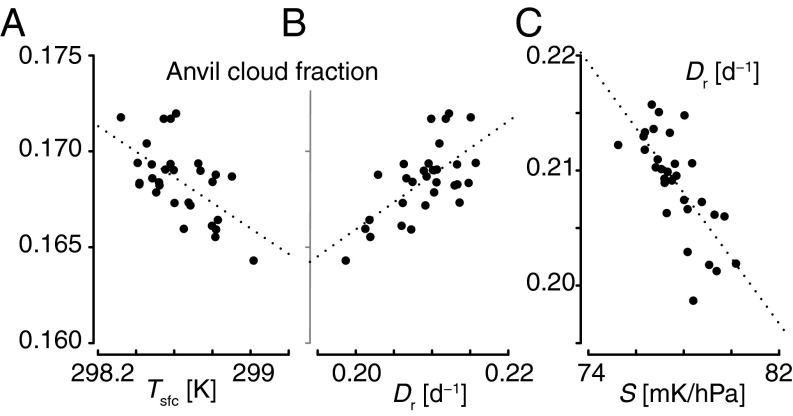
General circulation models show that as the surface temperature increases, the convective anvil clouds shrink. By analyzing radiative-convective equilibrium simulations, we show that this behavior is rooted in basic energetic and thermodynamic properties of the atmosphere: As the climate warms, the clouds rise and remain at nearly the same temperature, but find themselves in a more stable atmosphere; this enhanced stability reduces the convective outflow in the upper troposphere and decreases the anvil cloud fraction. By warming the troposphere and increasing the upper-tropospheric stability, the clustering of deep convection also reduces the convective outflow and the anvil cloud fraction. When clouds are radiatively active, this robust coupling between temperature, high clouds, and circulation exerts a positive feedback on convective aggregation and favors the maintenance of strongly aggregated atmospheric states at high temperatures. This stability iris mechanism likely contributes to the narrowing of rainy areas as the climate warms. Whether or not it influences climate sensitivity requires further investigation.

Keywords: anvil cloud; climate sensitivity; cloud feedback; convective aggregation; large-scale circulation.


Conflict of interest statement

The authors declare no conflict of interest.

Figures

Fig. 1.
Fig. 1.
Monthly precipitation (normalized by its global mean value) predicted by the IPSL, MPI, and NCAR GCMs in RCE simulations forced by an SST of (Top) 295 K and (Bottom) 305 K.
Fig. 2.
Fig. 2.
Vertical profile of the cloud fraction simulated by (A) IPSL, (B) MPI, and (C) NCAR GCMs for different surface temperatures.
Fig. S1.
Fig. S1.
Monthly precipitation (normalized by its global mean value) predicted by the IPSL and NCAR GCMs in RCE simulations forced by an SST of 295 K or 305 K. Top four panels: with cloud-radiative effects. Bottom four panels: without cloud-radiative effects. In the absence of cloud-radiative effects, these GCMs do not predict any large-scale convective aggregation.
Fig. S2.
Fig. S2.
CRM simulations: vertical profiles of (Upper Left) cloud fraction and (Upper Right) radiatively driven divergence associated with different SSTs (ranging from 280 K to 310 K), and relationship (Bottom Left) between the anvil cloud amount and SST, (Bottom Center) between the anvil cloud amount and the radiatively driven divergence, and (Bottom Right) between the static stability at the level of maximum divergence (and along the 220 K isotherm, dashed line) and SST derived from nonrotating RCE CRM simulations from Wing and Cronin (21). All quantities are domain averages computed over days 50–75 of each simulation.
Fig. S3.
Fig. S3.
Interannual variations in full-blown GCMs: relationship between the tropical mean anvil cloud amount and the tropical surface temperature (land + ocean) derived from (Left) IPSL, (Center) MPI, and (Right) NCAR GCMs in AMIP simulations run in a realistic configuration (with rotation, continents, etc.) and forced by observed sea surface temperatures and time-varying radiative forcings (greenhouse gases and aerosols). Each point represents an annual average of tropical mean quantities (30°S–30°N) during 1979–2005.
Fig. S4.
Fig. S4.
Relationships among anvil cloud fraction, Tsfc, Dr, and S. Relationships are plotted at the height of anvil clouds, derived from an AMIP simulation run with the IPSL-CM5A-LR GCM in the absence of convective parameterization [so-called SPOOKIE simulation (43)]. Each point represents an annual average of tropical mean quantities (30°S–30°N) during 1979–2005.
Fig. 3.
Fig. 3.
Relationship between the anvil cloud fraction and the radiatively driven divergence Dr predicted by three GCMs in simulations forced by a range of SSTs (colors ranging from blue to red correspond to increasing SST, and each GCM is associated with a different marker). The dashed line represents the linear regression line across all points.
Fig. S5.
Fig. S5.
Clouds-on vs. clouds-off: comparison of the relationship (Top) between the anvil cloud amount and the radiatively driven divergence and (Bottom) between the static stability at the level of maximum divergence and SST in IPSL and NCAR GCM simulations run (Left) with and (Right) without cloud-radiative effects. (Top Left) R2 = 0.68, f/Dr = 0.40 ± 0.13 d; (Top Right) R2 = 0.65, f/Dr = 0.37 ± 0.14 d.
Fig. 4.
Fig. 4.
Relationship between the radiatively driven convective divergence Dr and sea surface temperature for the three GCMs (Dr/Tsfc= −4.1 ± 0.6%/K). (A) Relationship actually predicted by the models. (B) Relationship diagnosed by assuming that either the temperature profile or the clear-sky radiative cooling profile does not vary with sea surface temperature.
Fig. S6.
Fig. S6.
Sensitivity to ozone and cloud-radiative effects in the IPSL GCM: comparison of (Top) aggregation vs. SST and of (Middle) the relationship between the anvil cloud amount and the radiatively driven divergence and (Bottom) between static stability at the level of maximum divergence and SST in RCE simulations (Left) with cloud-radiative effects (CRE) and ozone, (Center) with cloud-radiative effects but without ozone, and (Right) without cloud-radiative effects and without ozone. Also reported in Bottom panels are the evolutions of static stability along the 225 K isotherm. The aggregation index is defined as the fractional area of the globe covered by large-scale subsidence (31). A value close to 0.5 corresponds to the absence of aggregation.
Fig. S7.
Fig. S7.
Prescribed vs. interactive SST: relationship between (Left) the anvil cloud fraction and the radiatively driven divergence and (Right) the static stability at the level of maximum divergence and SST in IPSL GCM simulations forced by prescribed SSTs or by computing the SST interactively, using an ocean mixed layer of 10 m depth and a CO2 atmospheric concentration set to 0.5, 0.75, 1, 2, or 3 times its present-day value.
Fig. 5.
Fig. 5.
(A) Vertical profile of temperature (plotted as a function of pressure) and (B) static stability (plotted as a function of atmospheric temperature) computed by assuming that the atmosphere follows a moist adiabat starting at 950 hPa and associated with a range of cloud-base temperatures (increasing from blue to red). The dashed lines in B show a constant pressure distance (50 hPa and 100 hPa) from the cold point tropopause. Above these levels, the static stability of the actual atmosphere significantly deviates from a moist adiabatic stratification and increases up to the tropopause, the moist-adiabatic assumption thus representing a lower bound on static stability.
Fig. 6.
Fig. 6.
Daily evolutions of (A) convective self-aggregation, (B) anvil cloud amount, (C) Dr, and (D) upper-tropospheric γ predicted by the IPSL GCM in a RCE simulation forced by an SST of 305 K. Shading denotes the timescale (ca. 30 d) for subsidence to turn over the troposphere.
Fig. 7.
Fig. 7.
Relationship (A) between anvil cloud amount and surface temperature, (B) between anvil cloud amount and Dr, and (C) between Dr and static stability at the height of anvil clouds derived from interannual climate variations simulated by the real-world GCM equivalent of the IPSL model during 1979–2005. All quantities are annual mean tropical averages (30°S–30°N).

Comment in

  • 8897

References

    1. Slingo A, Slingo JM. The response of a general circulation model to cloud longwave radiative forcing. i: Introduction and initial experiments. Q J R Meteorol Soc. 1988;114:1027–1062.
    1. Randall DA, Harshvardhan, Dazlich DA, Corsetti TG. Interactions among radiation, convection, and large-scale dynamics in a general circulation model. J Atmos Sci. 1989;46:1943–1970.
    1. Sherwood SC, Ramanathan V, Barnett TP, Tyree MK, Roeckner E. Response of an atmospheric general circulation model to radiative forcing of tropical clouds. J Geophys Res. 1994;99:20829–20845.
    1. Bony S, et al. Clouds, circulation and climate sensitivity. Nat Geosci. 2015;8:261–268.
    1. Voigt A, Shaw TA. Circulation response to warming shaped by radiative changes of clouds and water vapour. Nat Geosci. 2015;8:102–106.

Publication types

LinkOut - more resources