. 2016 Nov;5(11):1485-1495.
doi: 10.5966/sctm.2015-0272. Epub 2016 Jul 13.

Type 1 Diabetes Mellitus Donor Mesenchymal Stromal Cells Exhibit Comparable Potency to Healthy Controls In Vitro

Affiliations

Type 1 Diabetes Mellitus Donor Mesenchymal Stromal Cells Exhibit Comparable Potency to Healthy Controls In Vitro

Lindsay C Davies et al. Stem Cells Transl Med. 2016 Nov.

Abstract

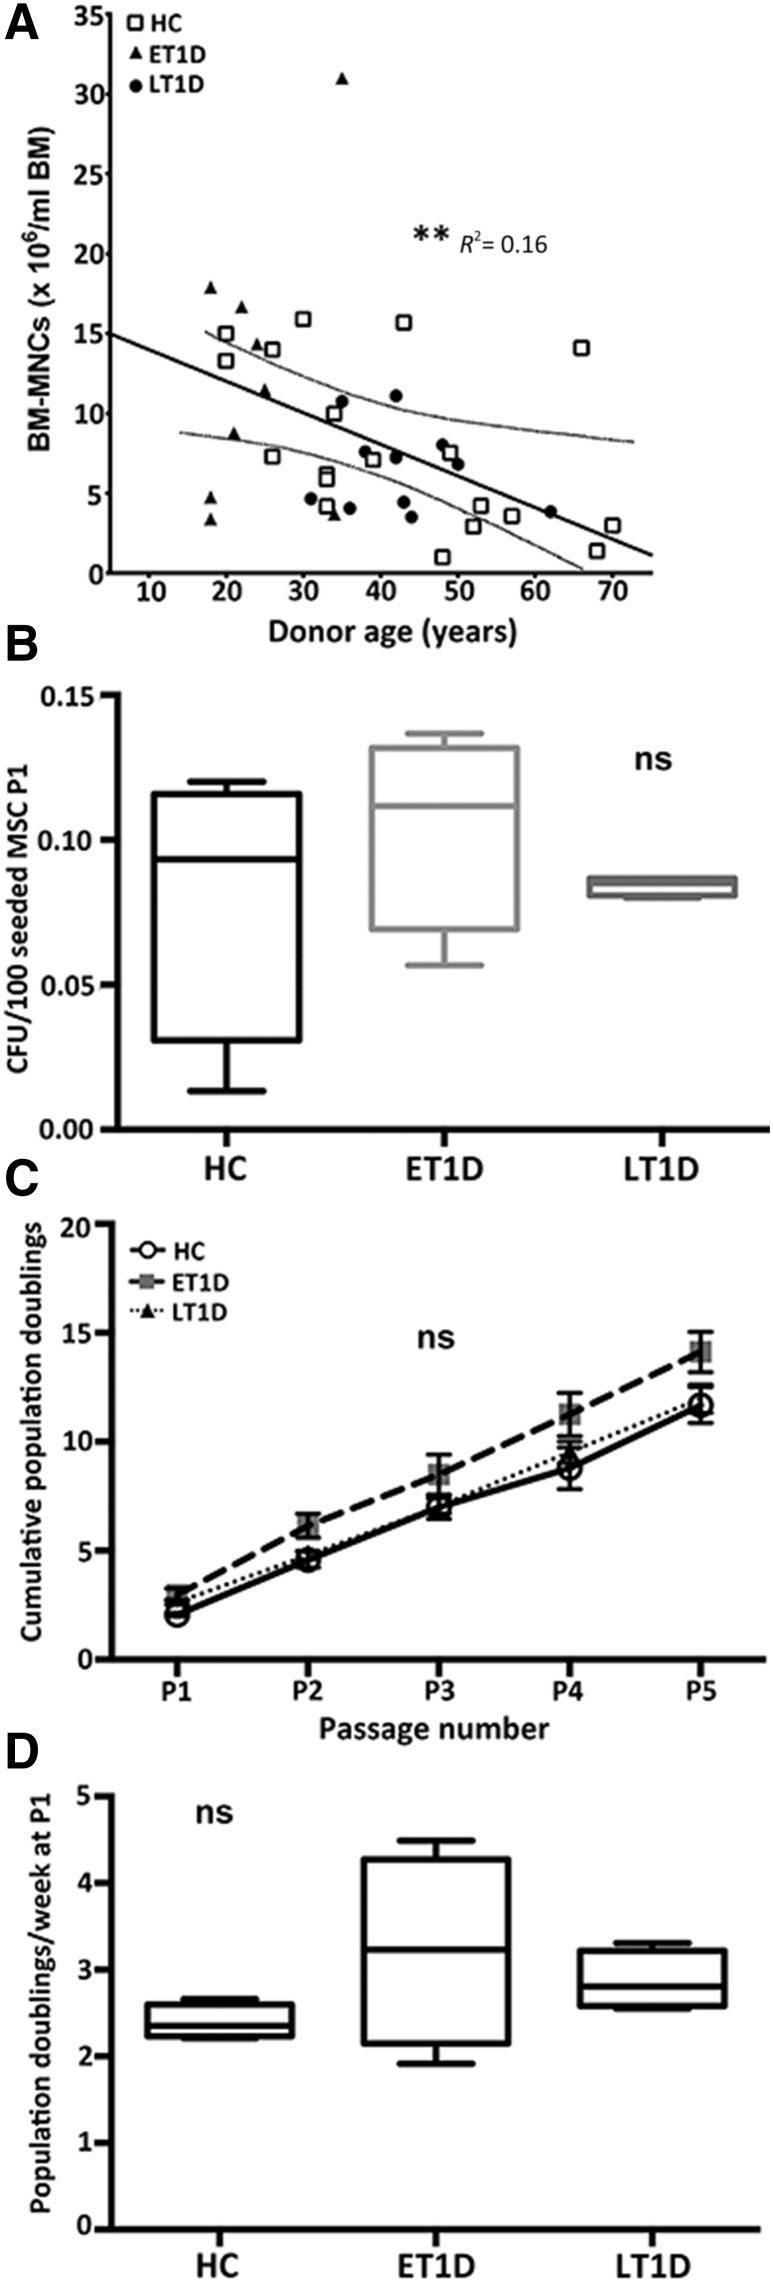
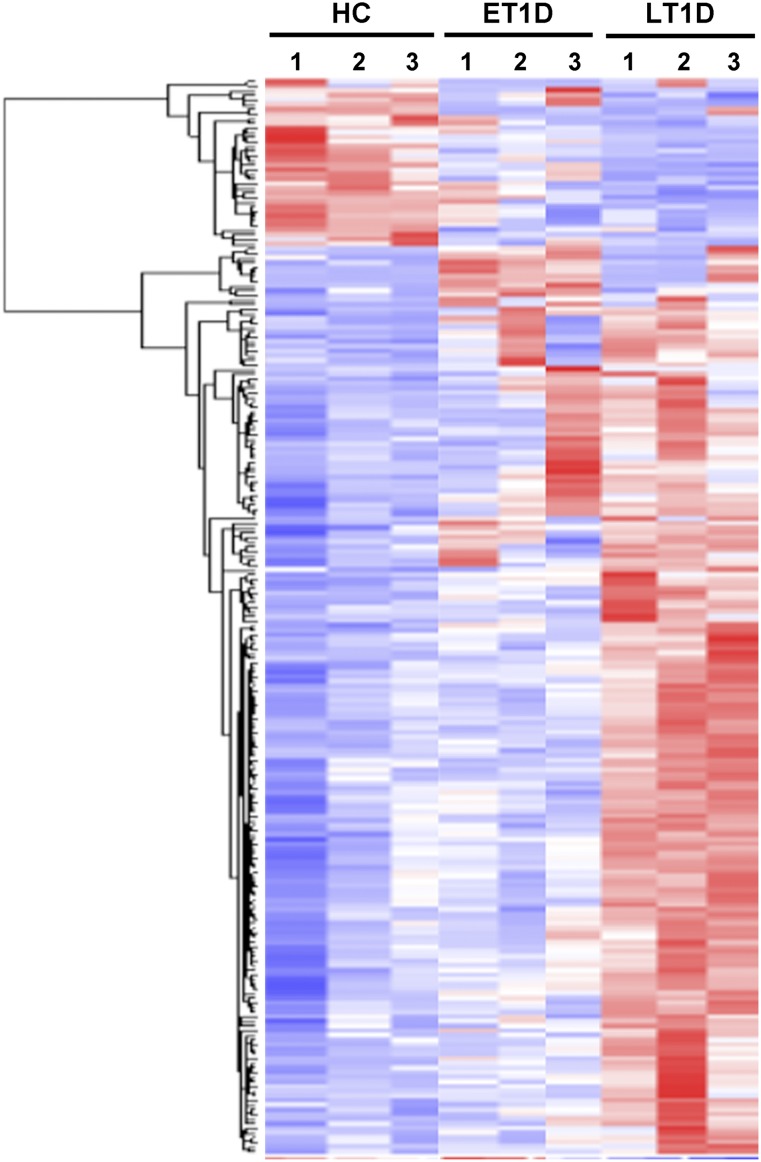
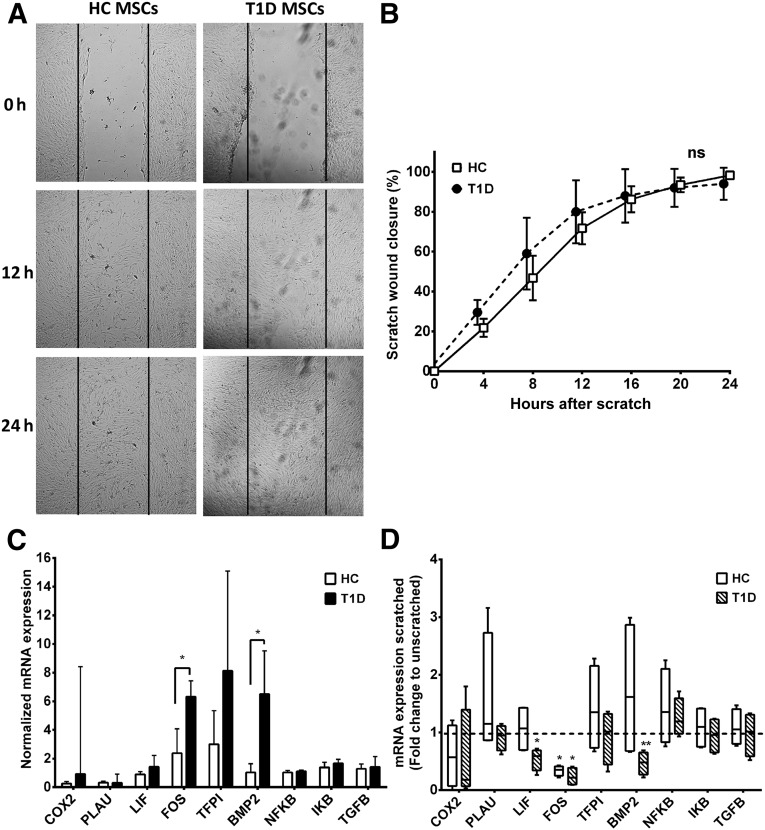
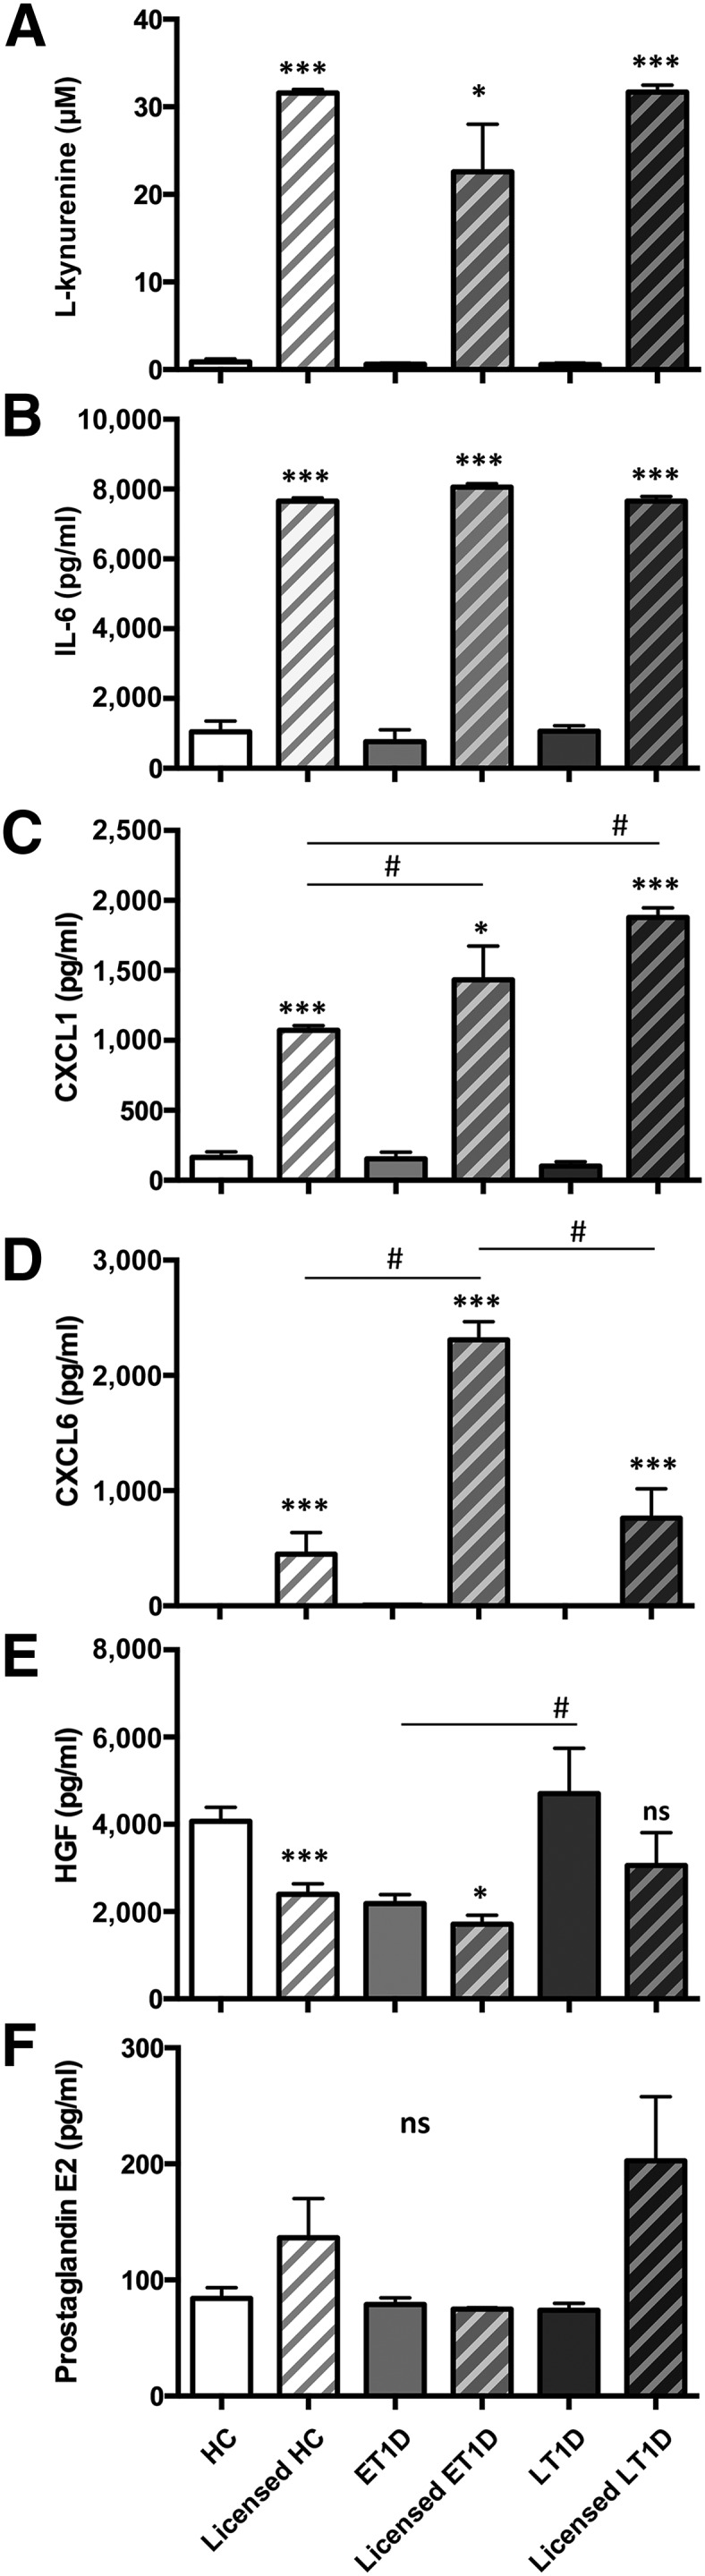
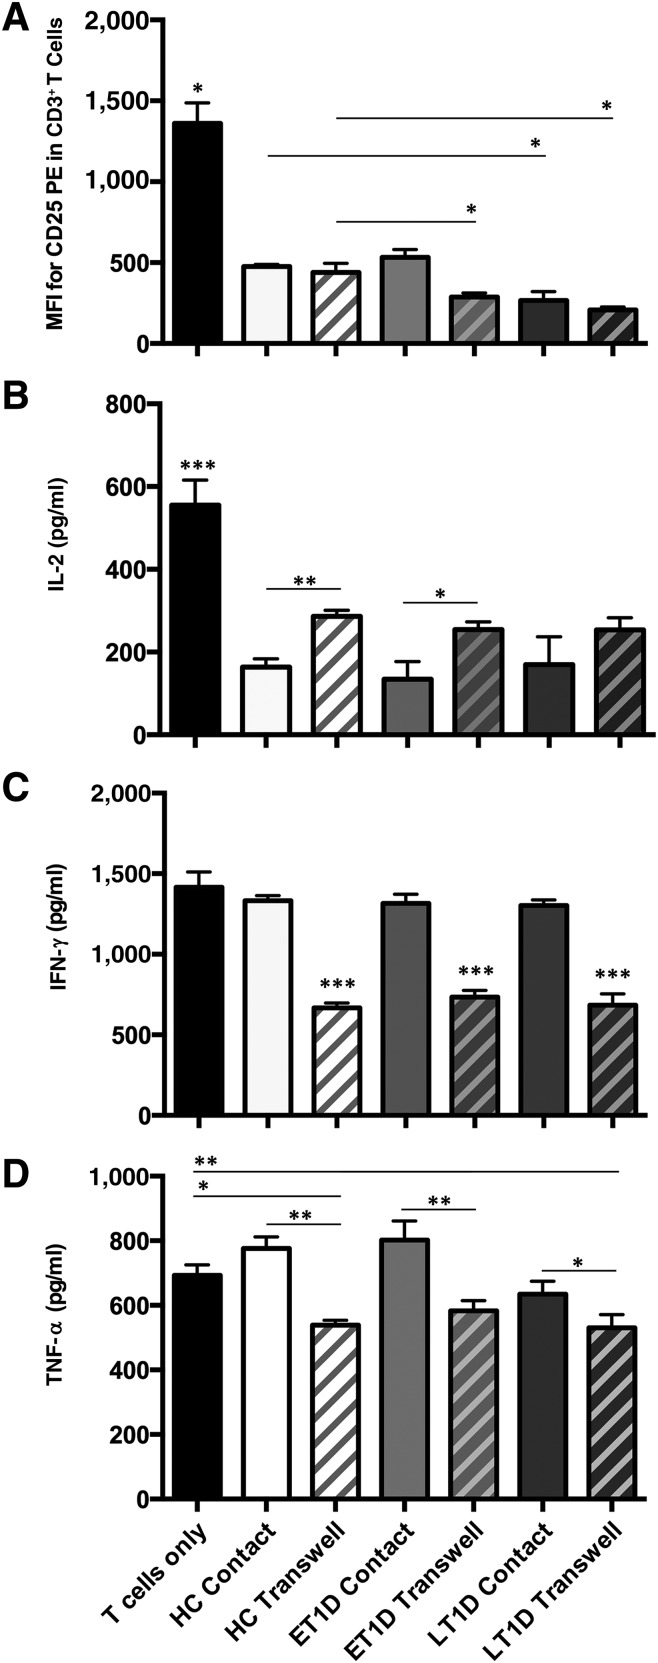
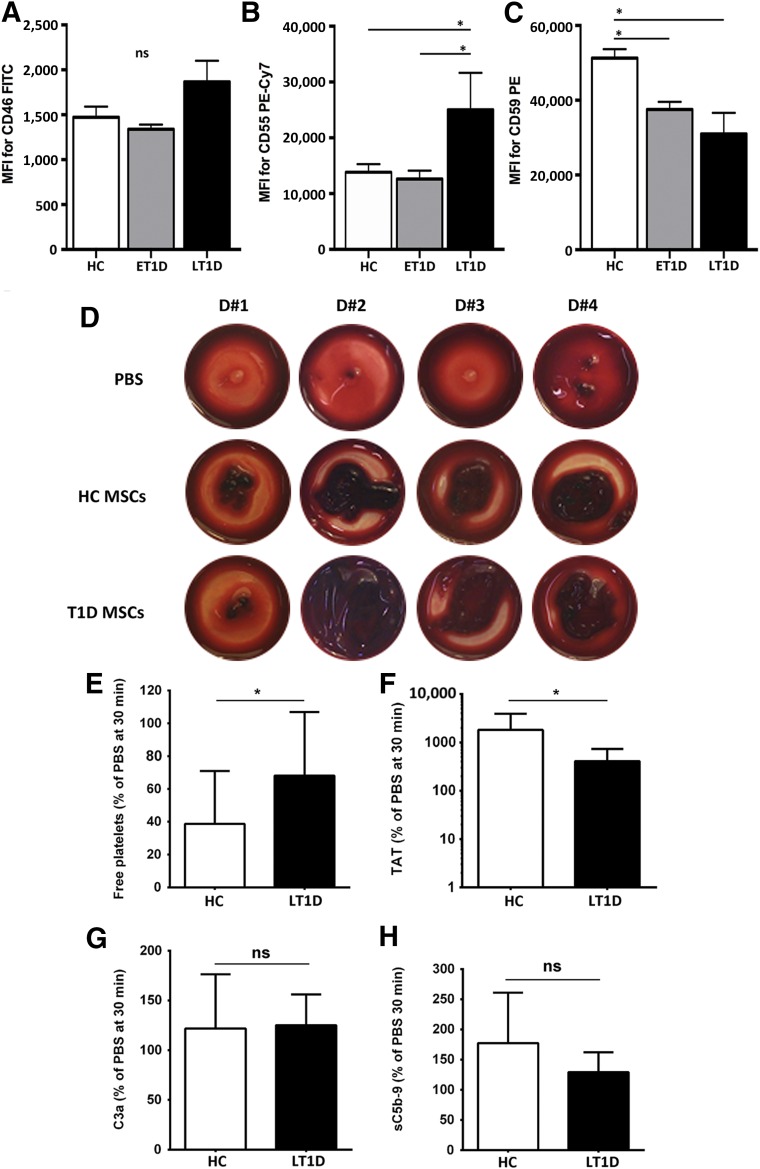
: Bone marrow mesenchymal stromal cells (BM-MSCs) have been characterized and used in many clinical studies based on their immunomodulatory and regenerative properties. We have recently reported the benefit of autologous MSC systemic therapy in the treatment of type 1 diabetes mellitus (T1D). Compared with allogeneic cells, use of autologous products reduces the risk of eliciting undesired complications in the recipient, including rejection, immunization, and transmission of viruses and prions; however, comparable potency of autologous cells is required for this treatment approach to remain feasible. To date, no analysis has been reported that phenotypically and functionally characterizes MSCs derived from newly diagnosed and late-stage T1D donors in vitro with respect to their suitability for systemic immunotherapy. In this study, we used gene array in combination with functional in vitro assays to address these questions. MSCs from T1D donors and healthy controls were expanded from BM aspirates. BM mononuclear cell counts and growth kinetics were comparable between the groups, with equivalent colony-forming unit-fibroblast capacity. Gene microarrays demonstrated differential gene expression between healthy and late-stage T1D donors in relation to cytokine secretion, immunomodulatory activity, and wound healing potential. Despite transcriptional differences, T1D MSCs did not demonstrate a significant difference from healthy controls in immunosuppressive activity, migratory capacity, or hemocompatibility. We conclude that despite differential gene expression, expanded MSCs from T1D donors are phenotypically and functionally similar to healthy control MSCs with regard to their immunomodulatory and migratory potential, indicating their suitability for use in autologous systemic therapy.

Significance: The potential for mesenchymal stromal cells (MSCs) as a cell-based therapy in the treatment of immunologic disorders has been well established. Recent studies reported the clinical potential for autologous MSCs as a systemic therapy in the treatment of type I diabetes mellitus (T1D). The current study compared the genotypic and phenotypic profiles of bone marrow-derived MSCs from T1D and healthy donors as autologous (compared with allogeneic) therapy provides distinct advantages, such as reduced risk of immune reaction and transmission of infectious agents. The findings of the current study demonstrate that despite moderate differences in T1D MSCs at the gene level, these cells can be expanded in culture to an extent corresponding to that of MSCs derived from healthy donors. No functional difference in terms of immunosuppressive activity, blood compatibility, or migratory capacity was evident between the groups. The study findings also show that autologous MSC therapy holds promise as a T1D treatment and should be evaluated further in clinical trials.

Keywords: Adult human bone marrow; Cellular therapy; Diabetes; Immunosuppression; Mesenchymal stem cells.


Figures

Figure 1.
Figure 1.
Growth characteristics of MSCs from HC and T1D donors. (A): Age-dependent decline in BM-MNCs per milliliter of BM aspirated from HCs (n = 19), ET1D donors (n = 10), and LT1D donors (n = 12). (B): CFU-F per 100 MSCs at P1 for HC (n = 4), ET1D (n = 4), and T1D donors (n = 4). (C): Growth kinetics (mean ± SD) for MSCs isolated from healthy and T1D donors P1–5 (n = 4 each). (D): Population doubling rate per week for cells from HC (n = 4), ET1D (n = 4), and LT1D (n = 4) donors at P1. Box plot whiskers indicate minimum to maximum. ∗∗, p < .01. Abbreviations: BM-MNC, bone marrow mononuclear cell; CFU-F, colony-forming unit fibroblast; ET1D, early-stage T1D; HC, healthy control; LT1D, late-stage T1D; MSC, mesenchymal stromal cell; ns, not significant; P, passage; T1D, type 1 diabetes.
Figure 2.
Figure 2.
Microarray analysis on global gene expression pattern of MSCs. Heatmap of gene expression in MSCs from ET1D donors (n = 3), LT1D donors (n = 3), and HCs (n = 3). Clustering shows 1.5-fold up- and down-regulated genes (using lower bound of 90% CI) of MSCs from T1D donors compared with HC MSCs. Red represents upregulated and blue downregulated expression. See supplemental online Tables 1 and 2 for complete lists of differentially expressed genes in MSCs from ET1D and LT1D donors, respectively. Abbreviations: CI, confidence interval; ET1D, early-stage T1D; HC, healthy control; LT1D, late-stage T1D; MSC, mesenchymal stromal cell; T1D, type 1 diabetes.
Figure 3.
Figure 3.
In vitro scratch wound healing. (A): Confluent cultures of MSCs from HC or LT1D (n = 4 per group) donors were subjected to scratch wounding, and wound closure was monitored by 24-hour live cell imaging. (B): Migration in response to scratch wounding was assessed by quantifying reduction in wound width every 4 hours after initial scratching (mean ± SD). Time-dependent differences in wound closure between MSCs from HC and LT1D donors were analyzed by repeated-measures analysis of variance. (C): Basic expression levels (mean ± SD) of genes related to wounding were studied with qRT-PCR analysis in unscratched control cultures of MSCs from HC and LT1D donors. (D): Fold change in expression levels of wound response genes in scratched MSC cultures compared with unscratched control cultures of the same donors at the 24-hour end point. Box plot whiskers indicate minimum to maximum; asterisks indicate significant difference in gene expression compared with unscratched cultures. ∗, p < .05; ∗∗, p < .01. Abbreviations: HC, healthy control; LT1D, late-stage T1D; MSC, mesenchymal stromal cell; ns, not significant; qRT-PCR, quantitative real-time polymerase chain reaction; T1D, type 1 diabetes.
Figure 4.
Figure 4.
Trophic properties of HC and T1D MSCs in response to licensing. P2 MSCs from HC, ET1D, and T1D donors (n = 4 per group) were evaluated for trophic properties at baseline and after exposure to proinflammatory cytokines IFN-γ and TNF-α (licensed MSCs). (A) IDO activity was assessed by measurement of l-kynurenine (µM). Detection of representative secreted trophic and immunomodulatory factors (pg/ml), IL-6 (B), CXCL1 (C), CXCL6 (D), HGF (E), and PGE2 (F) (mean ± SEM). The effect of licensing in each donor group was analyzed using paired t-test (B, D–F) or Wilcoxon signed rank test (A, C); ∗, p < .05; ∗∗∗, p < .001. Differences between donor groups were analyzed with one-way analysis of variance with Tukey’s post hoc test; #, p < .05. Abbreviations: CXCL, chemokine (C-X-C motif) ligand; ET1D, early-stage T1D; HC, healthy control; HGF, hepatocyte growth factor; IL, interleukin; LT1D, late-stage T1D; MSC, mesenchymal stromal cell; ns, not significant; P, passage; T1D, type 1 diabetes.
Figure 5.
Figure 5.
Suppression of T-cell activation and effector function with exposure to HC and T1D MSCs. MSCs from HC, ET1D, or LT1D donors (n = 4 per group) were cocultured with antibody-activated T cells in direct contact and separated by Transwell membrane inserts. (A): MSCs suppress T-cell activation as assessed by decreased CD25 expression in contact and Transwell cultures (MFI). Secretion of T-cell effector function molecules IL-2 (B), IFN-γ (C), and TNF-α (D) was suppressed in MSC coculture; most evidently by MSC produced soluble factors (mean ± SEM). All MSCs were compared with T cells only using one-way analysis of variance with Dunnett’s post hoc test; comparisons between MSC donor groups were analyzed using one-way analysis of variance with Tukey’s post hoc test; ∗, p < .05; ∗∗, p < .01; ∗∗∗, p < .001. Abbreviations: BM-MNC, bone marrow mononuclear cell; ET1D, early-stage T1D; HC, healthy control; IFN, interferon; IL, interleukin; LT1D, late-stage T1D; MFI, median fluorescence intensity; MSC, mesenchymal stromal cell; P, passage; T1D, type 1 diabetes; TNF, tumor necrosis factor.
Figure 6.
Figure 6.
Hemocompatibility profiling of MSCs from HC and T1D donors. Cell surface expression of complement inhibitors CD46 (A), CD55 (B), and CD59 (C) was assessed by flow cytometry on HC, ET1D, and LT1D MSCs (n = 4 donors per group) at P2. Data are expressed as median fluorescence intensity (MFI) ± SEM and analyzed using Mann-Whitney U test; ∗, p < .05. Early passage MSCs (P2–3) from HC or T1D donors were tested for triggering of the instant blood mediated inflammatory reaction (IBMIR) after exposure to nonanticoagulated whole blood in the Chandler blood loop model (n = 10 per group). (D): Representative photographs of clot formation from 4 donors from each group after a 60-min incubation of blood with HC or T1D MSCs (15,000 cells per milliliter) or PBS buffer as negative control. (E): Detection of coagulation and complement activation markers after treatment of blood with MSCs (mean ± SD): free platelets (% relative to PBS, 30 minutes time point), and ELISA quantification of TAT, complement C3 activation fragment a (C3a), and soluble C5b-9 complex (sC5b-9). Significance was analyzed with paired t test (same blood donor exposed to different MSCs); ∗, p < .05. Abbreviations: BM-MNC, bone marrow mononuclear cell; C3a, complement C3 activation fragment a; CFU-F, colony-forming unit fibroblast; Cy7, cyanine 7; ET1D, early-stage T1D; FITC, fluorescein isothiocyanate; HC, healthy control; LT1D, late-stage T1D; MFI, median fluorescence intensity; MSC, mesenchymal stromal cell; P, passage; PBS, phosphate-buffered saline; PE, phycoerythrin; T1D, type 1 diabetes; TAT, thrombin-antithrombin complex.

References

    1. Atkinson MA. The pathogenesis and natural history of type 1 diabetes. Cold Spring Harb Perspect Med. 2012;2:2. - PMC - PubMed
    1. Eizirik DL, Colli ML, Ortis F. The role of inflammation in insulitis and beta-cell loss in type 1 diabetes. Nat Rev Endocrinol. 2009;5:219–226. - PubMed
    1. Mangialardi G, Oikawa A, Reni C, et al. Bone marrow microenvironment: A newly recognized target for diabetes-induced cellular damage. Endocr Metab Immune Disord Drug Targets. 2012;12:159–167. - PubMed
    1. Chhabra P, Brayman KL. Stem cell therapy to cure type 1 diabetes: From hype to hope. Stem Cells Translational Medicine. 2013;2:328–336. - PMC - PubMed
    1. Hematti P, Kim J, Stein AP, et al. Potential role of mesenchymal stromal cells in pancreatic islet transplantation. Transplant Rev (Orlando) 2013;27:21–29. - PubMed