Salmonella Serogroup C: Current Status of Vaccines and Why They Are Needed
- PMID: 27413069
- PMCID: PMC5014923
- DOI: 10.1128/CVI.00243-16
Salmonella Serogroup C: Current Status of Vaccines and Why They Are Needed
Abstract
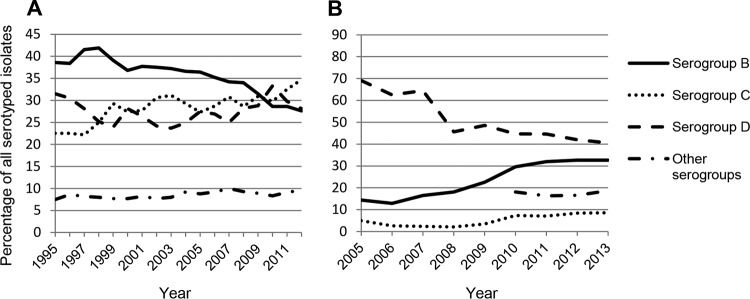
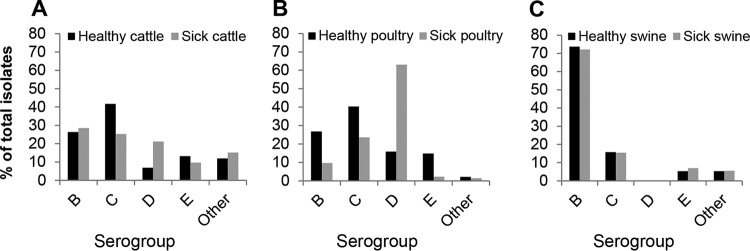
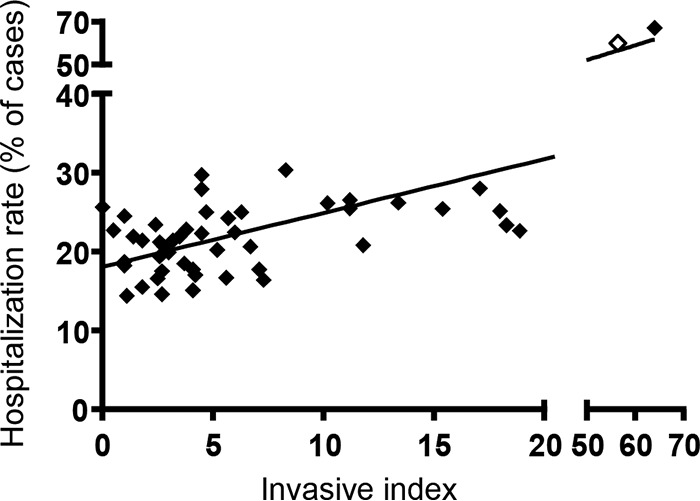
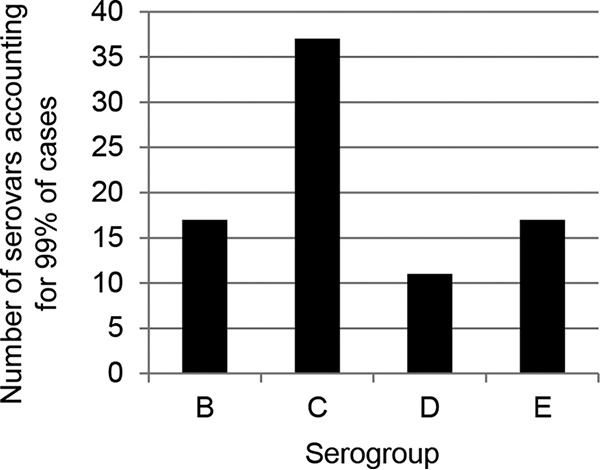
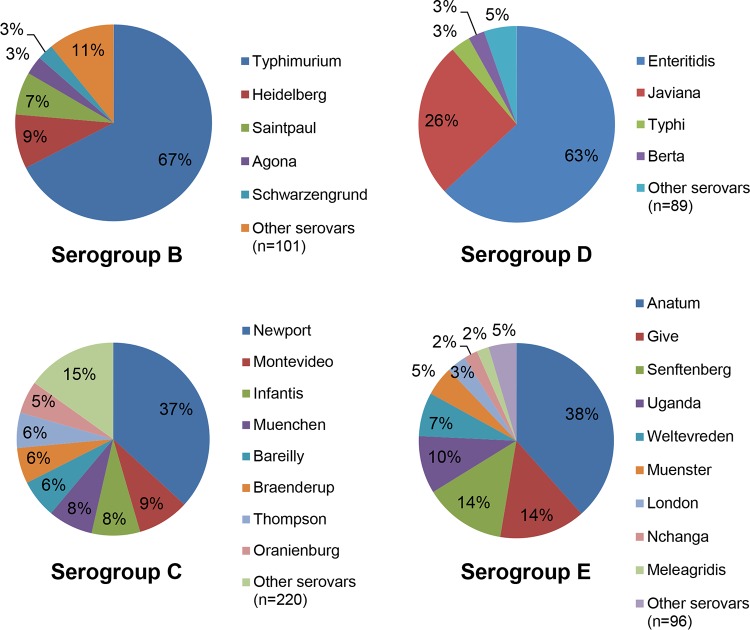
Nontyphoidal Salmonella (NTS; i.e., Salmonella enterica organisms that do not cause typhoid or paratyphoid) are responsible for 94 million infections and 155,000 deaths worldwide annually, 86% of which are estimated to be foodborne. Although more than 50 serogroups and 2,600 serovars have been described, not all Salmonella serovars cause disease in humans and animals. Efforts are being made to develop NTS vaccines, with most approaches eliciting protection against serovars Typhimurium and Enteritidis (serogroups B [O:4] and D [O:9], respectively), as they are widely considered the most prevalent. Here, we show that serogroup C (O:6,7, O:6,8, or O:8 epitopes) is the most common serogroup in the United States, and the prevalence of serovars from this serogroup has been increasing in Europe and the United States over the last decade. They are also the most commonly isolated serovars from healthy cattle and poultry, indicating the underlying importance of surveillance in animals. Four out of the 10 most lethal serovars in the United States are serogroup C, and reports from African countries suggest that strains within this serogroup are highly antibiotic resistant. Serogroup C consists of highly diverse organisms among which 37 serovars account for the majority of human cases, compared to 17 and 11 serovars for serogroups B and D, respectively. Despite these concerning data, no human vaccines targeting serogroup C NTS are available, and animal vaccines are in limited use. Here, we describe the underestimated burden represented by serogroup C NTS, as well as a discussion of vaccines that target these pathogens.
Copyright © 2016, American Society for Microbiology. All Rights Reserved.
Figures
References
-
- Grimont PAD, Weill F-X. 2007. Antigenic formulae of the Salmonella serovars, 9th ed WHO Collaborating Centre for Reference and Research on Salmonella. Institut Pasteur, Paris, France.
-
- Global Burden of Disease 2013 DALYs and HALE Collaborators. 2015. Global, regional, and national disability-adjusted life years (DALYs) for 306 diseases and injuries and healthy life expectancy (HALE) for 188 countries, 1990-2013: quantifying the epidemiological transition. Lancet 386:2145–2191. doi: 10.1016/S0140-6736(15)61340-X. - DOI - PMC - PubMed
Publication types
MeSH terms
Substances
Grants and funding
LinkOut - more resources
Full Text Sources
Other Literature Sources
Medical