. 2016 Jul 13;36(28):7415-27.
doi: 10.1523/JNEUROSCI.3642-15.2016.

G2019S-LRRK2 Expression Augments α-Synuclein Sequestration into Inclusions in Neurons

Affiliations

G2019S-LRRK2 Expression Augments α-Synuclein Sequestration into Inclusions in Neurons

Laura A Volpicelli-Daley et al. J Neurosci. .

Erratum in

Abstract

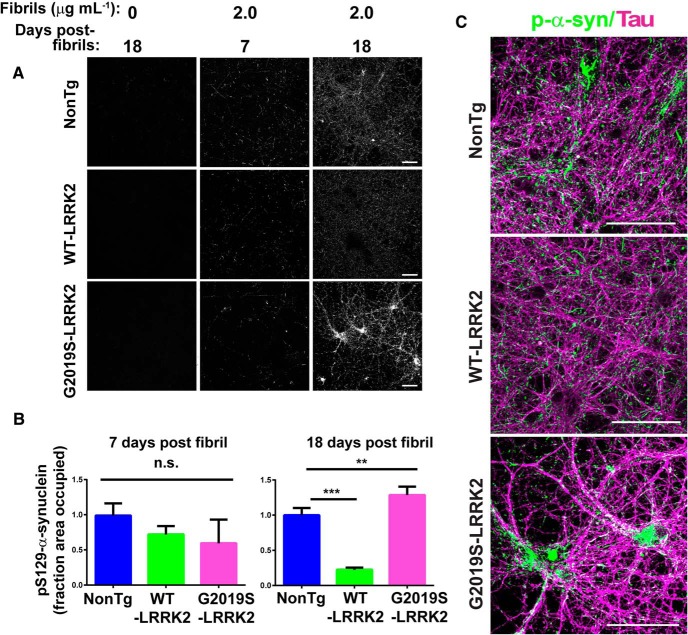
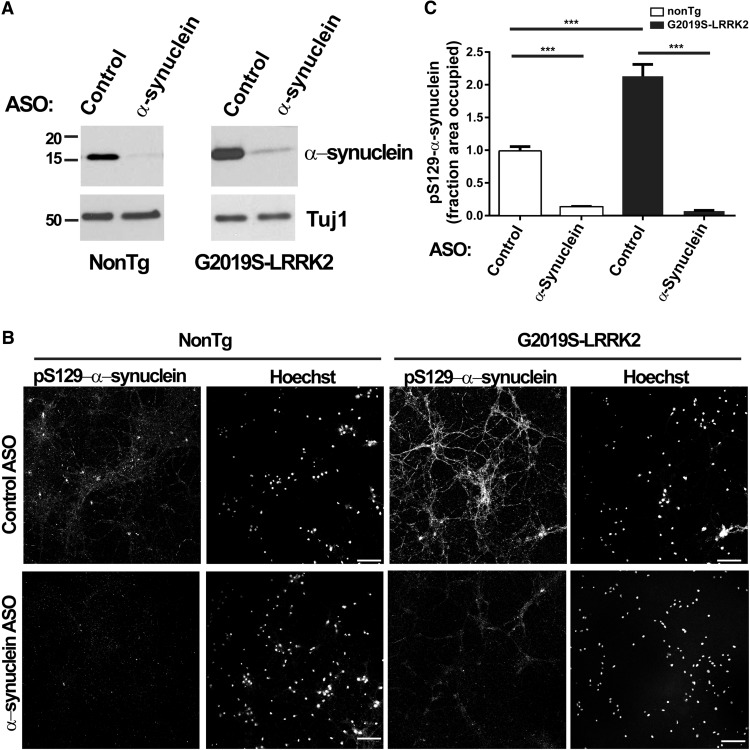
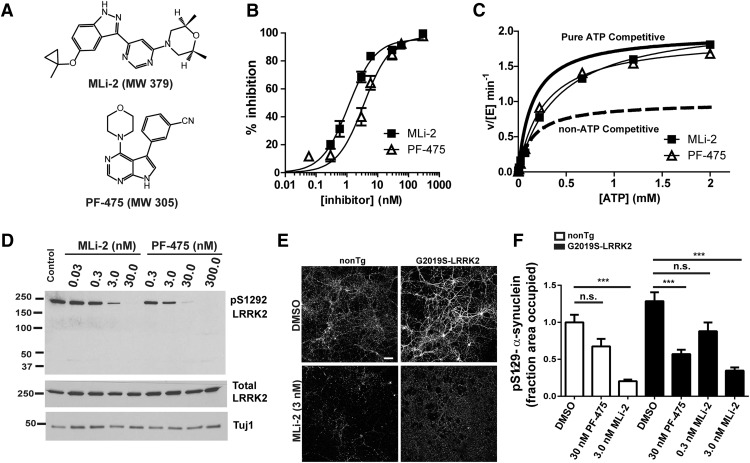
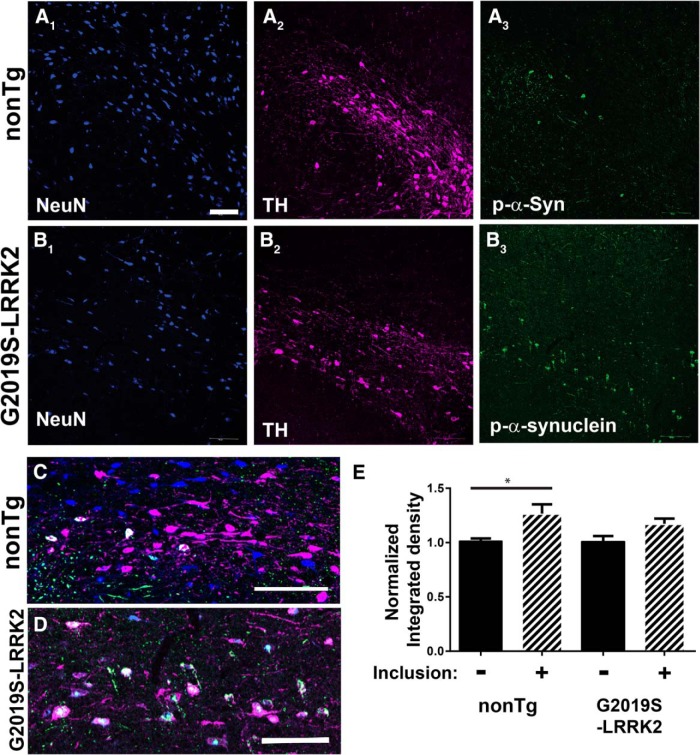
Pathologic inclusions define α-synucleinopathies that include Parkinson's disease (PD). The most common genetic cause of PD is the G2019S LRRK2 mutation that upregulates LRRK2 kinase activity. However, the interaction between α-synuclein, LRRK2, and the formation of α-synuclein inclusions remains unclear. Here, we show that G2019S-LRRK2 expression, in both cultured neurons and dopaminergic neurons in the rat substantia nigra pars compact, increases the recruitment of endogenous α-synuclein into inclusions in response to α-synuclein fibril exposure. This results from the expression of mutant G2019S-LRRK2, as overexpression of WT-LRRK2 not only does not increase formation of inclusions but reduces their abundance. In addition, treatment of primary mouse neurons with LRRK2 kinase inhibitors, PF-06447475 and MLi-2, blocks G2019S-LRRK2 effects, suggesting that the G2019S-LRRK2 potentiation of inclusion formation depends on its kinase activity. Overexpression of G2019S-LRRK2 slightly increases, whereas WT-LRRK2 decreases, total levels of α-synuclein. Knockdown of total α-synuclein with potent antisense oligonucleotides substantially reduces inclusion formation in G2019S-LRRK2-expressing neurons, suggesting that LRRK2 influences α-synuclein inclusion formation by altering α-synuclein levels. These findings support the hypothesis that G2019S-LRRK2 may increase the progression of pathological α-synuclein inclusions after the initial formation of α-synuclein pathology by increasing a pool of α-synuclein that is more susceptible to forming inclusions.

Significance statement: α-Synuclein inclusions are found in the brains of patients with many different neurodegenerative diseases. Point mutation, duplication, or triplication of the α-synuclein gene can all cause Parkinson's disease (PD). The G2019S mutation in LRRK2 is the most common known genetic cause of PD. The interaction between G2019S-LRRK2 and α-synuclein may uncover new mechanisms and targets for neuroprotection. Here, we show that expression of G2019S-LRRK2 increases α-synuclein mobility and enhances aggregation of α-synuclein in primary cultured neurons and in dopaminergic neurons of the substantia nigra pars compacta, a susceptible brain region in PD. Potent LRRK2 kinase inhibitors, which are being developed for clinical use, block the increased α-synuclein aggregation in G2019S-LRRK2-expressing neurons. These results demonstrate that α-synuclein inclusion formation in neurons can be blocked and that novel therapeutic compounds targeting this process by inhibiting LRRK2 kinase activity may slow progression of PD-associated pathology.

Keywords: LRRK2; Lewy body; Lewy neurite; Parkinson's; synuclein.


Figures

Figure 1.
Figure 1.
G2019S-LRRK2 expression increases α-synuclein expression in primary neurons. A, Representative immunoblots of lysates for total LRRK2 expression or (B) α-synuclein from DIV 21 primary hippocampal neurons cultured from WT-LRRK2 BAC, G2019S-LRRK2 BAC, or from nonTg mice. Equivalent protein concentrations (∼10 μg) were loaded per lane. Quantification of immunoblots are from N = 11 pairs of G2019S-LRRK2 and nonTg cultures from independent breeders and N = 4 pairs of WT-LRRK2 and nonTg cultures. **p < 0.001. n.s., Not significant. C, Representative confocal micrographs of hippocampal neurons (DIV 21) stained with antibodies to tau, MAP2, or stained with Hoechst, as indicated. D, Quantification is shown for the area occupied by tau (for each genotype, N = 20, 10 images each from 2 independent experiments), (E) MAP2 (for each genotype, N = 20, 10 images each from 2 independent experiments), or (F) total counts of Hoechst nuclei (nonTg: N = 52 images from 5 independent experiments; WT-LRRK2: N = 65 images from 5 independent experiments; G2019S-LRRK2: N = 55 images from 5 independent experiments). Scale bars, 100 μm. Bar charts represent group mean. Error bars indicate SEM.
Figure 2.
Figure 2.
G2019S-LRRK2 expression exacerbates fibril-induced pS129-α-synuclein inclusions in primary neurons. A, Representative confocal images of pS129-α-synuclein staining in primary hippocampal neurons from nonTg, WT-LRRK2 BAC, or G2019S-BAC mice plated at equivalent densities. B, Quantification of pS129-α-synuclein signal 7 or 18 d after the addition of 2.0 μg/ml of sonicated fibrils. For 7 d after fibrils, for each genotype, N = 20 images from 2 independent experiments. For 18 d after fibrils nonTg: N = 70 from 5 independent experiments; WT-LRRK2: N = 60 from 4 independent experiments; G2019S-LRRK2: N = 70 from 5 independent experiments. **p = 0.002. ***p < 0.001. Bars represent group mean calculated. Error bars indicate SEM. C, Representative confocal images of primary neurons from nonTg, WT-LRRK2 BAC, and G2019S-LRRK2 BAC mice treated at DIV 7 with 2.0 μg/ml fibrils and analyzed for pS129-α-synuclein (green) and tau (magenta) 18 d later. Scale bars, 100 μm. n.s., Not significant.
Figure 3.
Figure 3.
Reducing α-synuclein levels inhibits formation of inclusions. A, Neurons from nonTg or G2019S-LRRK2-expressing mice were treated with 5 μm control or α-synuclein ASOs at DIV 7, lysates were collected 18 d later, and immunoblots were performed for total α-synuclein or Tuj-1. Representative blots are shown. B, Neurons from nonTg or G2019S-LRRK2-expressing mice were cotreated with 5 μm control or α-synuclein ASOs and 2.0 μg/ml fibrils. Neurons were fixed 18 d later, and immunofluorescence for pS129-α-synuclein was performed to visualize inclusions. Representative confocal images are shown. Scale bars, 100 μm. C, Quantitation of pS129-α-synuclein abundance in nonTg or G2019S-LRRK2-expressing primary neurons exposed to 2.0 μg/ml fibrils for 18 d with control or α-synuclein ASOs. For each genotype, N = 20 images from 2 independent experiments. ***p < 0.001. Bar charts represent group mean. Error bars indicate SEM.
Figure 4.
Figure 4.
G2019S-LRRK2 expression increases α-synuclein mobility after the formation of α-synuclein inclusions. Primary hippocampal neurons were transfected on DIV 6 with α-synuclein-GFP. The 2.0 μg/ml fibrils or were added, as indicated, on DIV 7, and FRAP experiments were performed 18 d later. A, Representative images from FRAP experiments with primary neurons transfected with α-synuclein-GFP. Fluorescence at baseline, immediately after the bleach, and 30 s after recovery are shown for control or fibril-treated neurons. In the neurons exposed to fibrils, only the smaller α-synuclein-GFP puncta were bleached, and the longer serpentine inclusions were excluded. Asterisks indicate representative points where recordings were made. B, Quantitation of fluorescence recovery measured every 0.27 s. Fluorescence intensity is expressed as a percentage of the initial prebleach intensity. Individual values are reported as the group mean from an average of 30 individual α-synuclein-GFP-positive puncta analyzed from three independent cultures.
Figure 5.
Figure 5.
Inhibition of LRRK2 kinase activity reduces fibril-induced α-synuclein inclusions in G2019S-LRRK2-expressing primary neurons. A, Structures of the LRRK2 kinase inhibitors, PF-06447475 (PF-475) and MLi-2. B, Recombinant GST-tagged human LRRK2 was incubated with LRRK2tide and [γ-32P]ATP in buffer containing MLi-2 or PF-06447475 (0–1000 nm). MLi-2 and PF-06447475 inhibited LRRK2 peptide phosphorylation with an IC50 value of 1.1 ± 0.2 and 3.5 ± 1.1 nm, respectively. C, The 1.1 nm Mli2 or 3.5 nm PF-06447475 was incubated with recombinant LRRRK2 and peptide, with 0–2000 μm [γ-32P]ATP. Both inhibitors increase LRRK2 Km ATP (149.9 ± 9.7, 421.4 ± 18.7, and 272.3 ± 14.3 μm in presence of DMSO, MLi2, or PF-06447475, respectively) while leaving the Vmax unchanged (1.97 ± 0.03 min for all conditions). Curves represent the inhibitory profile of a theoretical purely competitive or non-ATP competitive inhibitor. D, Primary hippocampal neurons were treated with the indicated concentration of PF-06447475, MLi-2, or DMSO control (1.2 × 10⁻⁴% of media top DMSO concentration) for 18 h before the neurons were harvested into protein lysates. Immunoblots are shown for antibodies specific for pS1292-LRRK2, total LRRK2, and Tuj1 as a loading control. E, Representative confocal images of primary neurons from nonTg or G2019S-LRRK2 BACs cotreated with 2.0 μg/ml fibrils, with or without 3.0 nm MLi-2 for 18 d. Immunofluorescence using an antibody to pS129-α-synuclein was performed to visualize inclusions. Scale bars, 100 μm. F, Quantitation pS129-α-synuclein abundance in nonTg or G2019S-LRRK2-expressing primary neurons exposed to 2.0 μg/ml fibrils for 18 d in the absence or presence of indicated concentrations of PF-06447475 or MLi-2. Ntg: DMSO, N = 70 from 5 independent experiments; 30 nm PF-06447475, N = 40 from 4 independent experiments; 3 nm Mli-2, N = 40 from 2 independent experiments; G2019S-LRRK2 DMSO, N = 70 from 5 independent experiments; 30 nm PF-06447475, N = 40 from 4 independent experiments; 3 nm MLi-2, N = 40 from 2 independent experiments; 0.3 nm MLi-2, N = 40 from 2 independent experiments. Bar charts represent group mean. Error bars indicate SEM. ***p < 0.001.
Figure 6.
Figure 6.
pS129-α-synuclein inclusions in the SNpc localize to TH neurons. The 20 μg of fibrils was injected into the SNpc in 10- to 12-week old nonTg (A, C) or littermate G2019S-LRRK2 BAC rats (B, D). Rats were killed 4 weeks after injection, and confocal analysis was performed in the SNpc to image neuronal nuclei (NeuN, blue), TH in SNpc dopaminergic neurons (TH, magenta), and pS129-α-synuclein inclusions (green). pS129-α-synuclein inclusions localized to TH-positive neurons. E, Confocal images of TH immunofluorescence were captured, and the normalized integrated density was measured for neurons with and without inclusions in both nonTg and G2019S-LRRK2-expressing rats. N = 100 TH-positive neurons analyzed per group (50 with inclusions), from N = 3 nonTg and N = 3 G2019S-BAC rats. *p < 0.05 (independent t test). Error bars indicate SEM. Scale bars, 100 μm.
Figure 7.
Figure 7.
Lack of neurodegeneration in G2019S-LRRK2 BAC rats 1 month after fibrils. A, Representative immunohistochemistry for TH in SNpc sections from nonTg and G2019S-LRRK2 BAC transgenic rats. B, Unbiased stereological counts of TH-positive neurons in the fibril-injected and contralateral monomer-injected SNpc. nonTg: N = 8 rats; G2019S-LRRK2: N = 4 rats. Error bars indicate SEM. C, Representative images showing TH fiber density in the striatum. D, Quantification of dorsal striatum TH fiber density using LiCOR analysis. SNpc nonTg: N = 8 rats; G2019S-LRRK2: N = 4 rats. Error bars indicate SEM.
Figure 8.
Figure 8.
G2019S-LRRK2 expression increases the number of pS129-α-synuclein inclusions in the SNpc after fibril exposure. The 20 μg of fibrils (right side) or monomeric α-synuclein (left side) was injected into the SNpc in 10- to 12-week-old male G2019S-LRRK2 BAC or littermate control nonTg rats. At 4 weeks later, animals were perfused and immunohistochemistry was performed for pS129-α-synuclein by DAB staining with Nissl counterstain. A, B, Representative coronal sections of the midbrain from nonTg and G2019S-LRRK2 BAC rats showing inclusion distribution through the SNpc. Scale bars, 250 μm. B1, B3, C1, A lack of staining in the contralateral alpha-synuclein-monomer-injected side. B2, B4, Neuronal soma with p-S129-alpha-synuclein positive staining ipsilateral to the injection. C2, A variety of pS129-alpha-synuclein positive structures that include dense circular Lewy-body like inclusions highlighted with an asterisk. C1, A lack of staining in the contralateral α-synuclein-monomer-injected side. C2, A variety of pS129-α-synuclein-positive structures that include dense circular Lewy-body like inclusions highlighted with an asterisk. +Neurons that show diffuse staining and much smaller inclusions. Arrow indicates serpentine neurite structures. Scale bars, 50 μm. D, High-magnification image of a circular inclusion with a dense core of pS129-α-synuclein surrounded by a halo. Scale bar, 5 μm. E, Unbiased stereological counts of pS129-α-synuclein inclusions (*structures) in the SNpc from five G2019S-LRRK2 BAC rats and five nonTg littermate controls. *p < 0.01 (independent t test). Error bars indicate SEM. There were no instances of pS129-α-synuclein inclusions in the contralateral side of any animal.

Similar articles

Cited by

References

    1. Beccano-Kelly DA, Volta M, Munsie LN, Paschall SA, Tatarnikov I, Co K, Chou P, Cao LP, Bergeron S, Mitchell E, Han H, Melrose HL, Tapia L, Raymond LA, Farrer MJ, Milnerwood AJ. LRRK2 overexpression alters glutamatergic presynaptic plasticity, striatal dopamine tone, postsynaptic signal transduction, motor activity and memory. Hum Mol Genet. 2015;24:1336–1349. doi: 10.1093/hmg/ddu543. - DOI - PubMed
    1. Bennett CF, Swayze EE. RNA targeting therapeutics: molecular mechanisms of antisense oligonucleotides as a therapeutic platform. Annu Rev Pharmacol Toxicol. 2010;50:259–293. doi: 10.1146/annurev.pharmtox.010909.105654. - DOI - PubMed
    1. Biskup S, Moore DJ, Celsi F, Higashi S, West AB, Andrabi SA, Kurkinen K, Yu SW, Savitt JM, Waldvogel HJ, Faull RL, Emson PC, Torp R, Ottersen OP, Dawson TM, Dawson VL. Localization of LRRK2 to membranous and vesicular structures in mammalian brain. Ann Neurol. 2006;60:557–569. doi: 10.1002/ana.21019. - DOI - PubMed
    1. Boassa D, Berlanga ML, Yang MA, Terada M, Hu J, Bushong EA, Hwang M, Masliah E, George JM, Ellisman MH. Mapping the subcellular distribution of alpha-synuclein in neurons using genetically encoded probes for correlated light and electron microscopy: implications for Parkinson's disease pathogenesis. J Neurosci. 2013;33:2605–2615. doi: 10.1523/JNEUROSCI.2898-12.2013. - DOI - PMC - PubMed
    1. Bousset L, Pieri L, Ruiz-Arlandis G, Gath J, Jensen PH, Habenstein B, Madiona K, Olieric V, Böckmann A, Meier BH, Melki R. Structural and functional characterization of two alpha-synuclein strains. Nat Commun. 2013;4:2575. doi: 10.1038/ncomms3575. - DOI - PMC - PubMed

Publication types

MeSH terms