. 2016 Jun 29:4:e2166.
doi: 10.7717/peerj.2166. eCollection 2016.

Virus wars: using one virus to block the spread of another

Affiliations

Virus wars: using one virus to block the spread of another

Matthew L Paff et al. PeerJ. .

Abstract

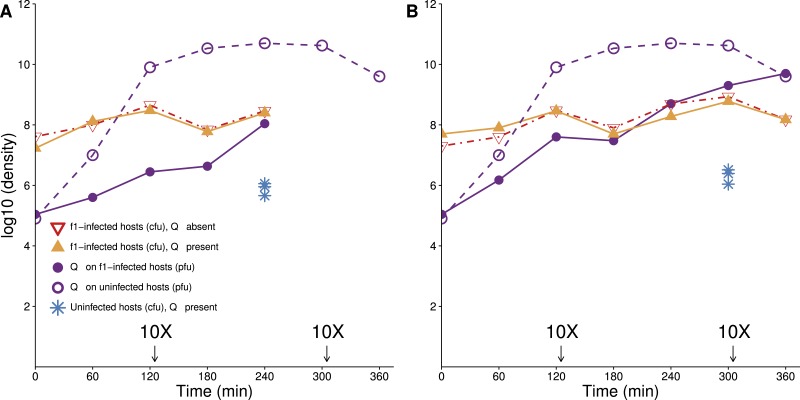
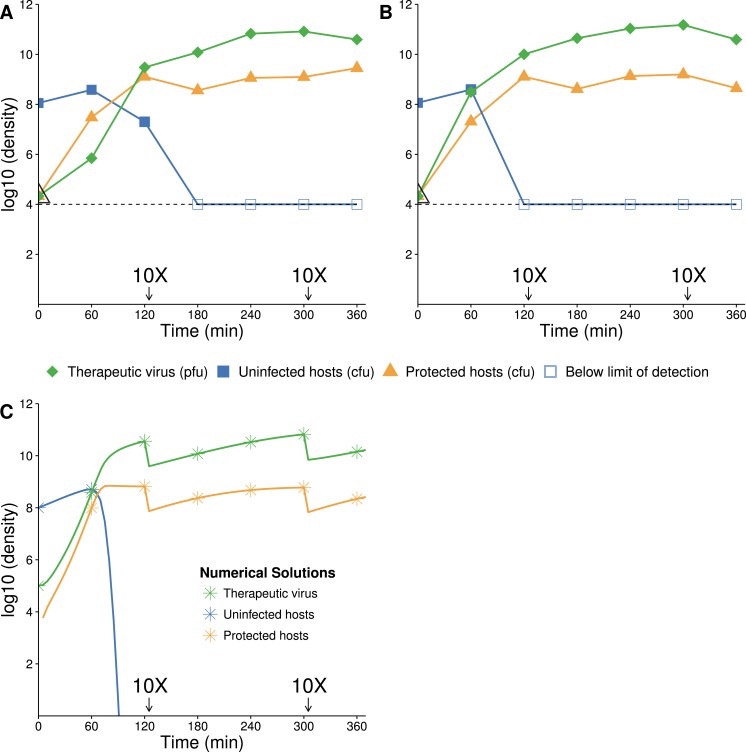
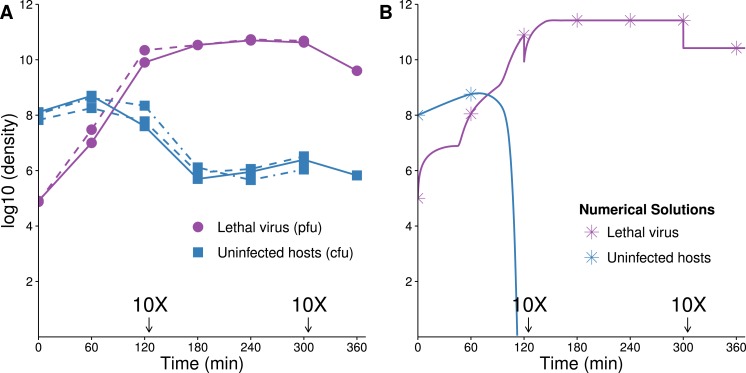
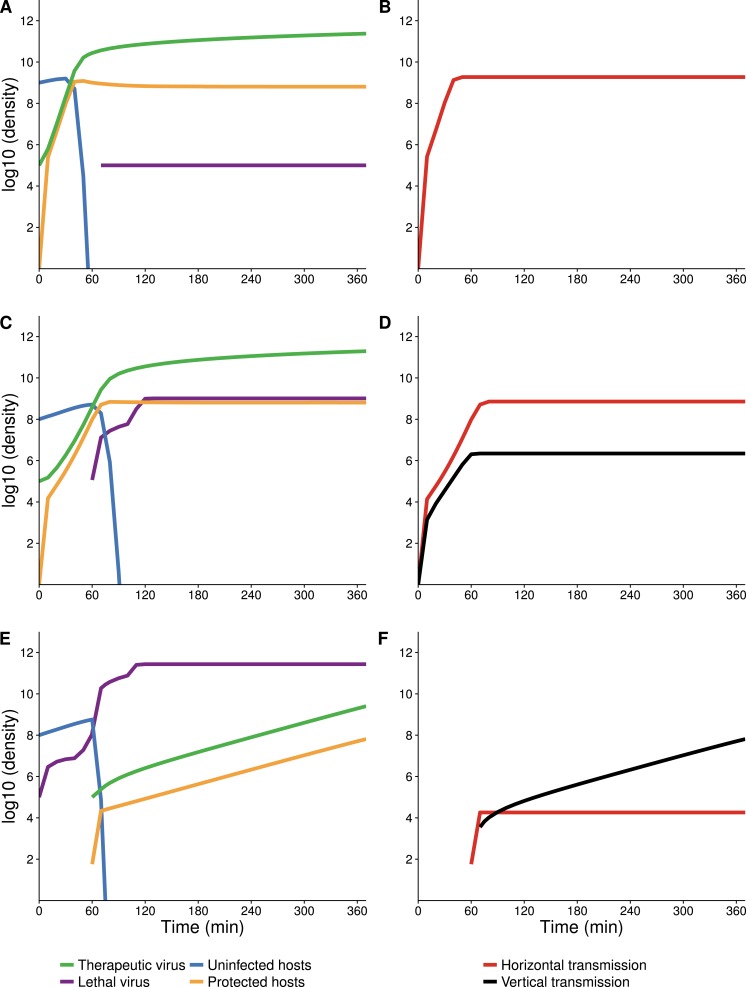
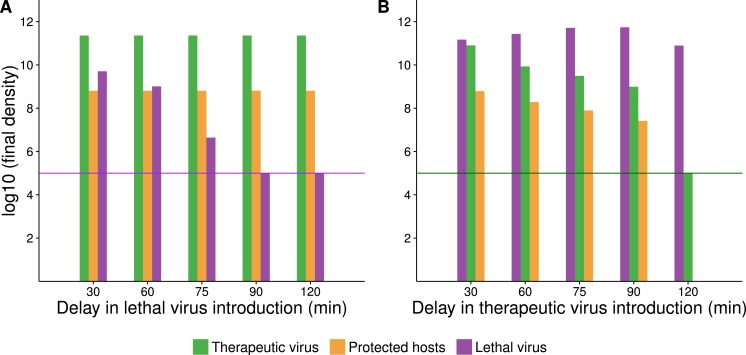
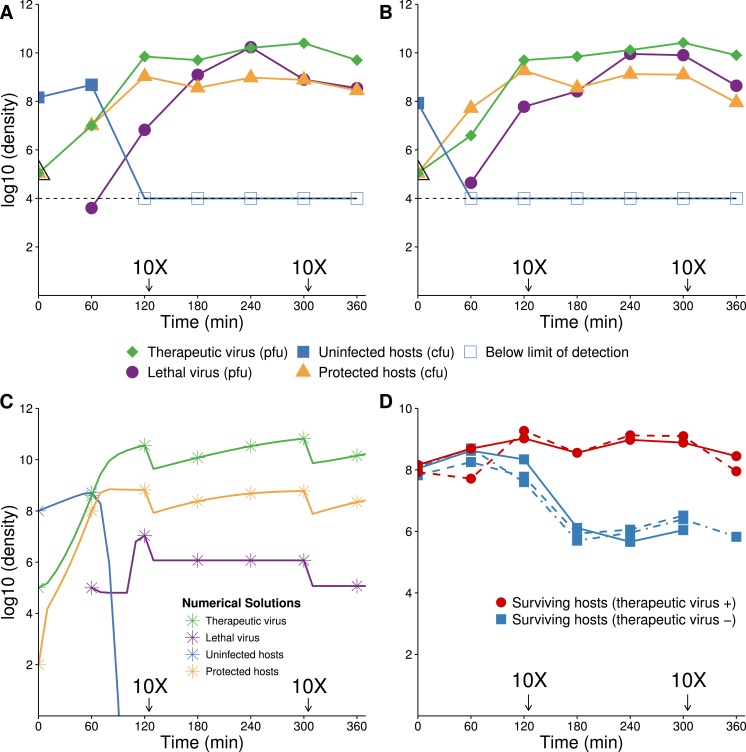
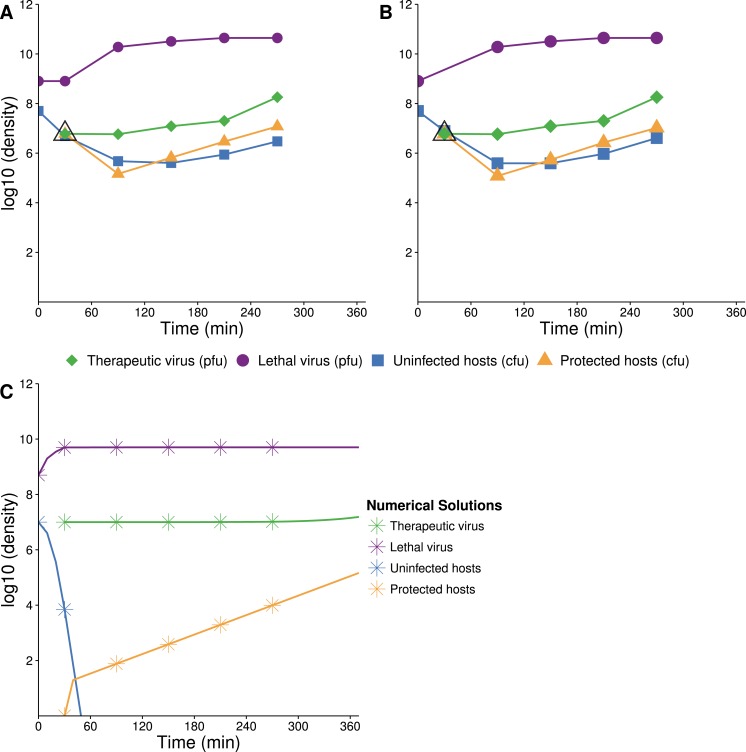
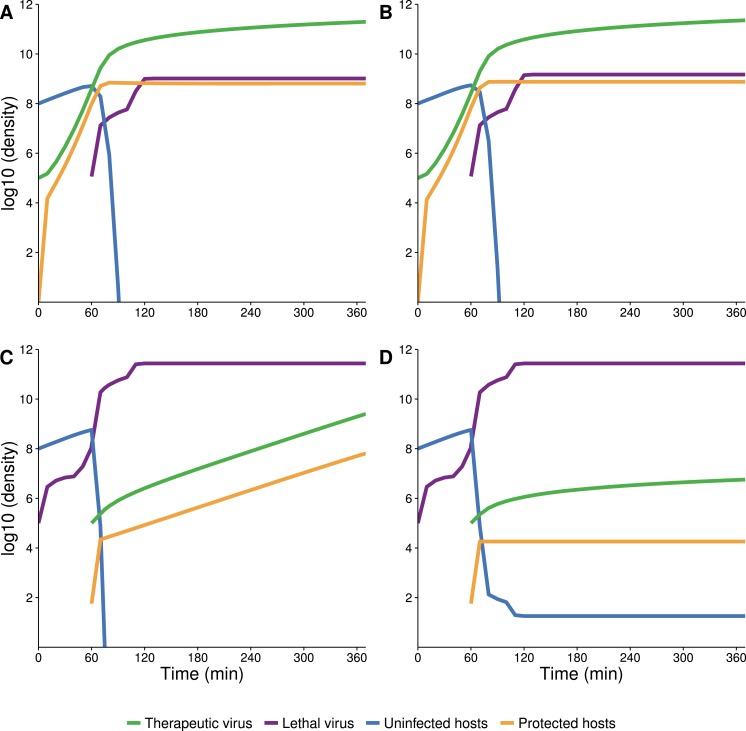
The failure of traditional interventions to block and cure HIV infections has led to novel proposals that involve treating infections with therapeutic viruses-infectious viruses that specifically inhibit HIV propagation in the host. Early efforts in evaluating these proposals have been limited chiefly to mathematical models of dynamics, for lack of suitable empirical systems. Here we propose, develop and analyze an empirical system of a therapeutic virus that protects a host cell population against a lethal virus. The empirical system uses E. coli bacteria as the host cell population, an RNA phage as the lethal virus and a filamentous phage as the therapeutic virus. Basic dynamic properties are established for each virus alone and then together. Observed dynamics broadly agree with those predicted by a computer simulation model, although some differences are noted. Two cases of dynamics are contrasted, differing in whether the therapeutic virus is introduced before the lethal virus or after the lethal virus. The therapeutic virus increases in both cases but by different mechanisms. With the therapeutic virus introduced first, it spreads infectiously without any appreciable change in host dynamics. With the therapeutic virus introduced second, host abundance is depressed at the time therapy is applied; following an initial period of therapeutic virus spread by infection, the subsequent rise of protection is through reproduction by hosts already protected. This latter outcome is due to inheritance of the therapeutic virus state when the protected cell divides. Overall, the work establishes the feasibility and robustness to details of a viral interference using a therapeutic virus.

Keywords: Bacteriophage; Gene therapy; Infectious vaccine; Intervention; Mathematical model; Population dynamics; Vaccine alternative.


Conflict of interest statement

The authors declare there are no competing interests.

Figures

Figure 1
Figure 1. Lethal virus Qβ growth on a population of f1-infected A/λ (A and B are independent replicates).
Cells infected with therapeutic virus (phage f1) are largely resistant to infection by Qβ, because their densities follow similar trajectories in the presence as in the absence of Qβ. There is nonetheless some growth of Qβ on these cells. A culture of cells infected with f1 carrying kanamycin resistance was grown overnight in LB with kanamycin (50 µg/mL). Cells were pelleted, and the pellet was re-suspended in 10 ml LB lacking drug and grown for 1 h before phage Qβ was added to a concentration of 104–105/mL. To maintain cells in a continual state of growth (which enhances infection), 10× dilutions were made immediately after some platings, as indicated (densities are not adjusted for dilutions). Curves with triangles give densities of f1-infected cells, curves with circles give densities of lethal virus Qβ. For comparison, the density of sensitive hosts in the presence of Qβ alone is shown from time 240 (A) and 300 (B) (blue stars, from Fig. 3).
Figure 2
Figure 2. Growth dynamics of therapeutic virus on a high density of susceptible hosts.
(A, B) Two assays of experimental densities of hosts and therapeutic virus (phage f1). Therapeutic virus (phage f1) was added to a culture of exponentially growing A/λ (≈108 cells/mL) at a concentration of ≈2 × 10⁴ phage/mL. Host and phage densities were monitored each hour and 10X dilutions were made immediately after 120 and 300 min to avoid high densities that would limit cell growth and suitability as a host. The open black triangle at time 0 is an upper limit of therapeutic-virus infected hosts, under the assumption that all free therapeutic virus infects immediately. As such, it provides the highest possible value of the initial density of therapeutic-virus infected hosts and thus the lowest possible rate of therapeutic virus spread during the first hour. Note that the initial host density is not at carrying capacity, so some of the long term increase in therapeutic-virus infected hosts is by reproduction of protected hosts. The decline in uninfected hosts is slower than predicted, possibly for the same reason that Qβ does not kill hosts to the predicted level. (C) Numerical analysis of therapeutic virus and host over time (parameter values are given in Table 2; initial values were 105 phage/mL for free therapeutic virus, 108 cells/mL for uninfected cells, and 0 cells/mL for therapeutic-virus infected cells). In contrast to the empirical results, virtually the entire host population is infected in 1.5 h. Results are broadly robust to variation in phage parameter values.
Figure 3
Figure 3. Growth dynamics of lethal virus (Qβ) on an initially high density of susceptible hosts.
(A) Three replicates of observed densities of host and phage over time (one replicate provides host density without phage density). Lethal virus was added to a culture of exponentially growing hosts (≈108 cells/mL) at an initial density of ≈8 × 10⁴ phage/mL. Host density shows a far more shallow decline than expected from the numerical analyses (in B). 10× dilutions were made immediately after the indicated sampling. (B) Numerical analysis predicting densities of lethal virus and host shows a rapid loss of hosts—to orders of magnitude lower values than in empirical runs. Curves show the numerical output; for visual comparison, symbols are placed at the same times as in the empirical assays. 10× dilutions were imposed in the numerical analyses at the same times as in empirical assays. Results are broadly robust to phage parameter values. (See Table 2 for parameter values; initial values of variables were: lethal virus =105 phage/mL, host =108 cells/mL.)
Figure 4
Figure 4. Numerical analyses show that the contribution of vertical versus horizontal transmission to therapeutic virus spread depends on initial density of hosts.
Full dynamics are shown on the left, cumulative amounts of horizontal (orange) and vertical transmission (black) on the right. (A, B) Therapeutic virus is introduced first. The host density is at carrying capacity when the therapeutic virus is introduced, so there is a complete change from susceptible to resistant hosts without any change in density—all increase is horizontal (through infection). (C, D) Therapeutic virus is introduced first, but host density is below carrying capacity at the start. There is now a visible contribution to the increase in protected hosts from vertical transmission, although most spread is still horizontal. (E, F) Therapeutic virus is introduced second. The lethal virus reduces host density several logs by the time the therapeutic virus is introduced. There is then an initial period of infectious (horizontal) spread by the therapeutic virus on the remaining hosts, but within an hour, growth is mostly due to vertical transmission, and the vertical component would continue until the density of therapeutic-virus infected hosts increased another 2 logs beyond that shown—because host density is so low at this point. Although the details of each run are sensitive to parameter values, the basic behaviors illustrated here are robust. All virus introductions were at 105 phage/mL at 0 or 60 min, as indicated. Initial (uninfected) host density was 109 cells/mL in (A, B) and 108 cells/mL in (C, D) and (E, F).
Figure 5
Figure 5. Numerical analyses show that the time between introduction of therapeutic virus and lethal virus affects the spread of the second virus.
Bar height gives the final density of the respective phage or host (taken at 420 min after addition of the first virus). X-axis gives the time delay between first and second virus introduction. In all cases, initial starting host cell density was 108 cells/mL. Both viruses were introduced at a density of 105 phage/mL (indicated by a purple or green horizontal line for A and B respectively). (A) Endpoint densities when therapeutic virus is introduced first. Free therapeutic virus and therapeutic-virus infected hosts are largely unaffected because they are introduced early enough to substantially outrun the lethal virus. However, therapeutic virus impact in suppressing the lethal virus increases with the delay in introduction of the lethal virus. (B) Endpoint densities when therapeutic virus is introduced second. Now the head start of the lethal virus means that its density is largely unaffected by the therapeutic virus, but the impact of the therapeutic virus in protecting hosts declines with the delay in its introduction. Results of individual runs are quantitatively sensitive to parameter values, but the qualitative behavior illustrated is robust.
Figure 6
Figure 6. Growth dynamics when therapeutic virus is introduced before lethal virus.
(A, B) Two replicates of observed experimental densities when therapeutic virus is introduced 60 min prior to lethal virus. Free therapeutic virus (≈105 phage/ml) was added to a culture of growing hosts (≈108 cells/ml). After 60 min of growth, lethal virus was added (at ≈4 × 10³ phage/ml). The open black triangle is an upper limit of therapeutic-virus infected hosts under the assumption that all free therapeutic virus infects immediately. As such, the slope shown for the yellow line (triangles) during the first hour is lower, perhaps much lower than the true slope. 10 dilutions were made immediately after the times indicated. (C) Numerical dynamics. 10× dilutions are introduced at the same times as in the empirical assays, and symbols are placed on the curves at the same times as samples were assayed empirically. Parameter values are from Table 2. (D) Comparison of the surviving host dynamics in response to lethal virus for a population into which therapeutic virus was introduced (circles, red) versus a population in which therapeutic virus was not introduced (squares, blue). Replicates are indicated as dashed vs. solid lines. The blue curves are from Fig. 3; the red are from (A) and (B) but combine protected and uninfected host densities.
Figure 7
Figure 7. Growth dynamics when lethal virus is introduced first.
(A, B) Experimental dynamics when lethal virus is introduced 30 min prior to therapeutic virus (two replicates). The increase in protected hosts (yellow triangles) is slow because it is by vertical transmission—reproduction of already-protected hosts. Lethal virus (4.4 × 10⁸ phage/ml) was added to a culture of hosts (8.8 × 10⁶ cells/ml). After 30 min, free therapeutic virus (7.1 × 10⁶ phage/ml) was added and densities were monitored over 4 h. The open black triangle is an upper limit of therapeutic-virus infected hosts, under the assumption that all free therapeutic virus virus infects immediately. (C) Numerical analyses illustrate that the biggest component of the increase in protected hosts comes from vertical transmission rather than horizontal transmission (the curve denoted with yellow stars; stars are placed at the same times as in the empirical assays). Initial conditions: lethal virus =5 × 10⁸ phage/ml, uninfected host =107 cells/ml, therapeutic-virus infected host = 0 cells/ml, and free therapeutic virus =107 phage/ml at 30 min.
Figure 8
Figure 8. Numerical analyses showing the effect of vertical transmission to the increase in density of protected hosts.
(A, B) Therapeutic virus introduced first with vertical transmission included (A) or blocked (B). Dynamics are indistinguishable due to nearly all increase in protected hosts coming from new infections (horizontal transmission). (C, D) Therapeutic virus introduced second with vertical transmission included (C) or blocked (D). Dynamics of protected hosts (orange triangles) are profoundly affected by blocking vertical transmission. Early on, dynamics are similar, as therapeutic-virus infected host densities rise quickly from horizontal transmission, until most hosts are infected. When vertical transmission is blocked, there is no further noticeable rise in therapeutic-virus infected hosts compared to the moderate rise observed when vertical transmission is included. Viruses were added at 105 at times indicated. Initial host densities were 108 cells/ml.

Similar articles

Cited by

References

    1. Adams MH. Bacteriophages. Interscience Publishers; New York: 1959.
    1. Bohannan B, Lenski R. Linking genetic change to community evolution: insights from studies of bacteria and bacteriophage. Ecology Letters. 2000;3(4):362–377. doi: 10.1046/j.1461-0248.2000.00161.x. - DOI
    1. Brown NJ, Hirsch ML. Adeno-associated virus (AAV) gene delivery in stem cell therapy. Discovery Medicine. 2015;20(111):333–342. - PubMed
    1. Bull JJ, Vegge CS, Schmerer M, Chaudhry WN, Levin BR. Phenotypic resistance and the dynamics of bacterial escape from phage control. PLoS ONE. 2014;9(4):e2166. doi: 10.1371/journal.pone.0094690. - DOI - PMC - PubMed
    1. Chapman-McQuiston E, Wu XL. Stochastic receptor expression allows sensitive bacteria to evade phage attack. Part I: experiments. Biophysical Journal. 2008a;94(11):4525–4536. doi: 10.1529/biophysj.107.120212. - DOI - PMC - PubMed

LinkOut - more resources