. 2016 Jul 14:5:e16412.
doi: 10.7554/eLife.16412.

Updates to the zoonotic niche map of Ebola virus disease in Africa

Affiliations

Updates to the zoonotic niche map of Ebola virus disease in Africa

David M Pigott et al. Elife. .

Abstract

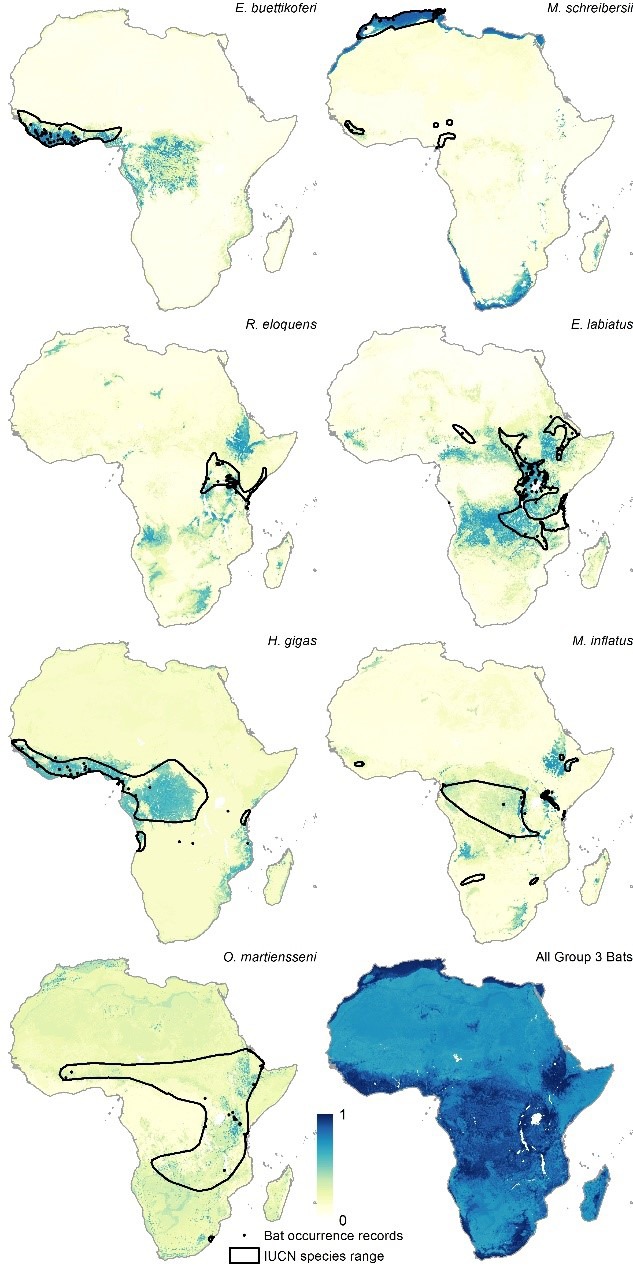
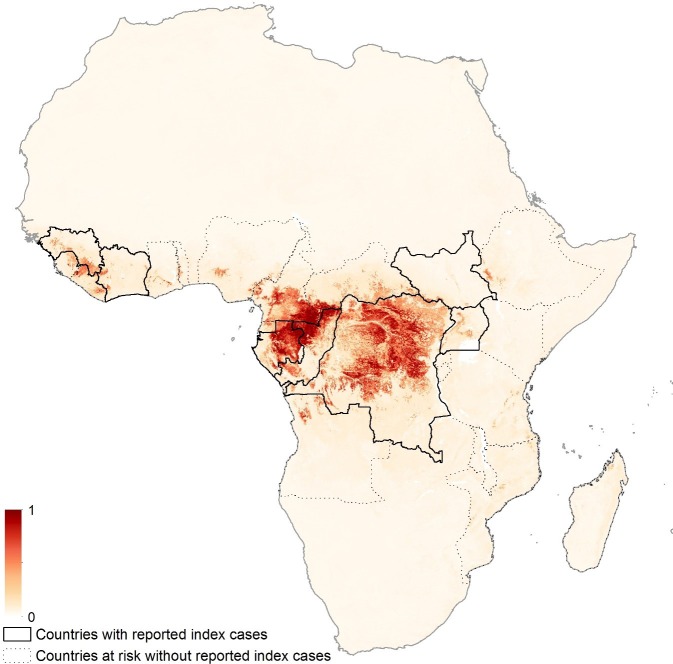
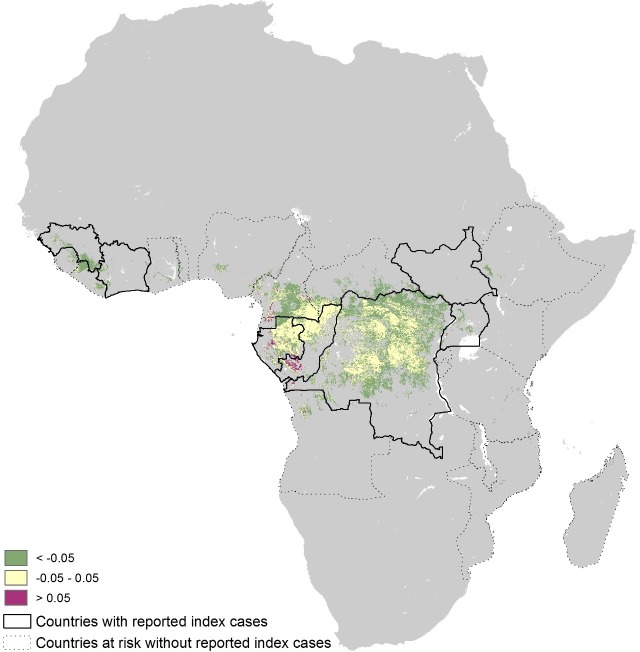
As the outbreak of Ebola virus disease (EVD) in West Africa is now contained, attention is turning from control to future outbreak prediction and prevention. Building on a previously published zoonotic niche map (Pigott et al., 2014), this study incorporates new human and animal occurrence data and expands upon the way in which potential bat EVD reservoir species are incorporated. This update demonstrates the potential for incorporating and updating data used to generate the predicted suitability map. A new data portal for sharing such maps is discussed. This output represents the most up-to-date estimate of the extent of EVD zoonotic risk in Africa. These maps can assist in strengthening surveillance and response capacity to contain viral haemorrhagic fevers.

Keywords: Ebola virus; boosted regression tree; disease mapping; ebola; epidemiology; global health; human; infectious disease; microbiology; niche based modelling; species distribution modelling.


Conflict of interest statement

SIH: Reviewing editor, eLife.

The other authors declare that no competing interests exist.

Figures

Figure 1.
Figure 1.. Updated Ebola virus disease occurrence database.
Human index cases are represented by red circles, animal occurrences in blue. New occurrence information is indicated by the black circle. The coordinates of polygon centroids are displayed for occurrences defined by an area greater than 5 km x 5 km. DOI: http://dx.doi.org/10.7554/eLife.16412.002
Figure 2.
Figure 2.. Combined suitability surfaces for each of the potential reservoir bat groupings.
For each layer the species specific suitability maps were combined to produce a surface approximating the probability that any bat species in that group may be present. Regions in blue (1) are most environmentally similar to locations reporting bat records. Areas in yellow (0) are the least environmentally similar. The top left panel depicts Group 1, top right Group 2 and bottom left Group 3 bats. DOI: http://dx.doi.org/10.7554/eLife.16412.003
Figure 2—figure supplement 1.
Figure 2—figure supplement 1.. Group 1 bat distributions.
The environmental suitability for each of the three bat species in Group 1 are displayed. Regions in dark blue (1) are most environmentally similar to locations reporting bat records. Areas in white (0) are the least environmentally similar. The black outline depicts the expert opinion range maps as determined by the International Union for the Conservation of Nature (Schipper et al., 2008) and the black dots represent occurrence records reported by the Global Biodiversity Information Facility (www.gbif.org/) and from published peer-reviewed articles. From top left, clockwise: Epomops franqueti, Hypsignathus monstrosus, summary Group 1 layer combining all three maps, and Myonycteris torquata. DOI: http://dx.doi.org/10.7554/eLife.16412.004
Figure 2—figure supplement 2.
Figure 2—figure supplement 2.. Group 2 bat distributions.
The environmental suitability for each of the five bat species in Group 2 are displayed. Regions in dark blue (1) are most environmentally similar to locations reporting bat records. Areas in white (0) are the least environmentally similar. The black outline depicts the expert opinion range maps as determined by the International Union for the Conservation of Nature (Schipper et al., 2008) and the black dots represent occurrence records reported by the Global Biodiversity Information Facility (www.gbif.org/). From top left, clockwise: Tadarida condylura, Rousettus aegyptiacus, Miniopterus pusillus, summary Group 2 layer combining all five maps, Eidolon helvum, and Epomophorus gambianus. DOI: http://dx.doi.org/10.7554/eLife.16412.005
Figure 2—figure supplement 3.
Figure 2—figure supplement 3.. Group 3 bat distributions.
The environmental suitability for each of the seven bat species in Group 3 are displayed. Regions in dark blue (1) are most environmentally similar to locations reporting bat records. Areas in white (0) are the least environmentally similar. The black outline depicts the expert opinion range maps as determined by the International Union for the Conservation of Nature (Schipper et al., 2008) and the black dots represent occurrence records reported by the Global Biodiversity Information Facility (www.gbif.org/). From top left, clockwise: Epomops buettikoferi, Miniopterus schreibersii, Epomophorus labiatus, Miniopterus inflatus, summary Group 3 layer combining all seven maps, Otomops martiensseni, Hipposideros gigas, and Rhinolophus eloquens. DOI: http://dx.doi.org/10.7554/eLife.16412.006
Figure 3.
Figure 3.. Updated map showing areas most environmentally suitable for the zoonotic transmission of Ebola virus.
Areas closer to dark red (1) are most environmentally similar to locations reporting Ebola virus occurrences; areas in light yellow (0) are least similar. Countries with borders outlined are those which are predicted to contain at-risk areas for zoonotic transmission based on a thresholding approach. Output displayed generated from model using the three consolidated bat covariates. DOI: http://dx.doi.org/10.7554/eLife.16412.007
Figure 3—figure supplement 1.
Figure 3—figure supplement 1.. Absolute differences between previous and revised maps.
Generated by subtracting the original eLife publication pixel probabilities from the newly generated values and restricted to those areas determined to be at-risk. Areas in yellow are essentially consistent. Areas in purple have probability values greater than the previous output; areas in green have probability values lower than previous outputs. DOI: http://dx.doi.org/10.7554/eLife.16412.008
Figure 3—figure supplement 2.
Figure 3—figure supplement 2.. Zoonotic niche map based upon inclusion of individual bat covariate layers.
Areas closer to dark red (1) are most environmentally similar to locations reporting Ebola virus occurrences; areas in light yellow (0) are least similar. Countries with borders outlined are those which are predicted to contain at-risk areas for zoonotic transmission based on a thresholding approach. Output displayed generated from model using individual bat covariate layers. DOI: http://dx.doi.org/10.7554/eLife.16412.009

References

    1. Allela L, Boury O, Pouillot R, Délicat A, Yaba P, Kumulungui B, Rouquet P, Gonzalez JP, Leroy EM. Ebola virus antibody prevalence in dogs and human risk. Emerging Infectious Diseases. 2005;11:385–390. doi: 10.3201/eid1103.040981. - DOI - PMC - PubMed
    1. Amman BR, Carroll SA, Reed ZD, Sealy TK, Balinandi S, Swanepoel R, Kemp A, Erickson BR, Comer JA, Campbell S, Cannon DL, Khristova ML, Atimnedi P, Paddock CD, Crockett RJ, Flietstra TD, Warfield KL, Unfer R, Katongole-Mbidde E, Downing R, Tappero JW, Zaki SR, Rollin PE, Ksiazek TG, Nichol ST, Towner JS. Seasonal pulses of Marburg virus circulation in juvenile Rousettus aegyptiacus bats coincide with periods of increased risk of human infection. PLoS Pathogens. 2012;8:e16412. doi: 10.1371/journal.ppat.1002877. - DOI - PMC - PubMed
    1. Bogoch II, Creatore MI, Cetron MS, Brownstein JS, Pesik N, Miniota J, Tam T, Hu W, Nicolucci A, Ahmed S, Yoon JW, Berry I, Hay SI, Anema A, Tatem AJ, MacFadden D, German M, Khan K. Assessment of the potential for international dissemination of Ebola virus via commercial air travel during the 2014 west African outbreak. The Lancet. 2015;385:29–35. doi: 10.1016/S0140-6736(14)61828-6. - DOI - PMC - PubMed
    1. Currie J, Grenfell B, Farrar J. Infectious diseases. Beyond Ebola. Science. 2016;351:815–816. doi: 10.1126/science.aad8521. - DOI - PMC - PubMed
    1. Elith J, Leathwick JR, Hastie T. A working guide to boosted regression trees. Journal of Animal Ecology. 2008;77:802–813. doi: 10.1111/j.1365-2656.2008.01390.x. - DOI - PubMed

Publication types