. 2016 Jul 14;14(7):e1002515.
doi: 10.1371/journal.pbio.1002515. eCollection 2016 Jul.

Topological Small-World Organization of the Fibroblastic Reticular Cell Network Determines Lymph Node Functionality

Affiliations

Topological Small-World Organization of the Fibroblastic Reticular Cell Network Determines Lymph Node Functionality

Mario Novkovic et al. PLoS Biol. .

Abstract

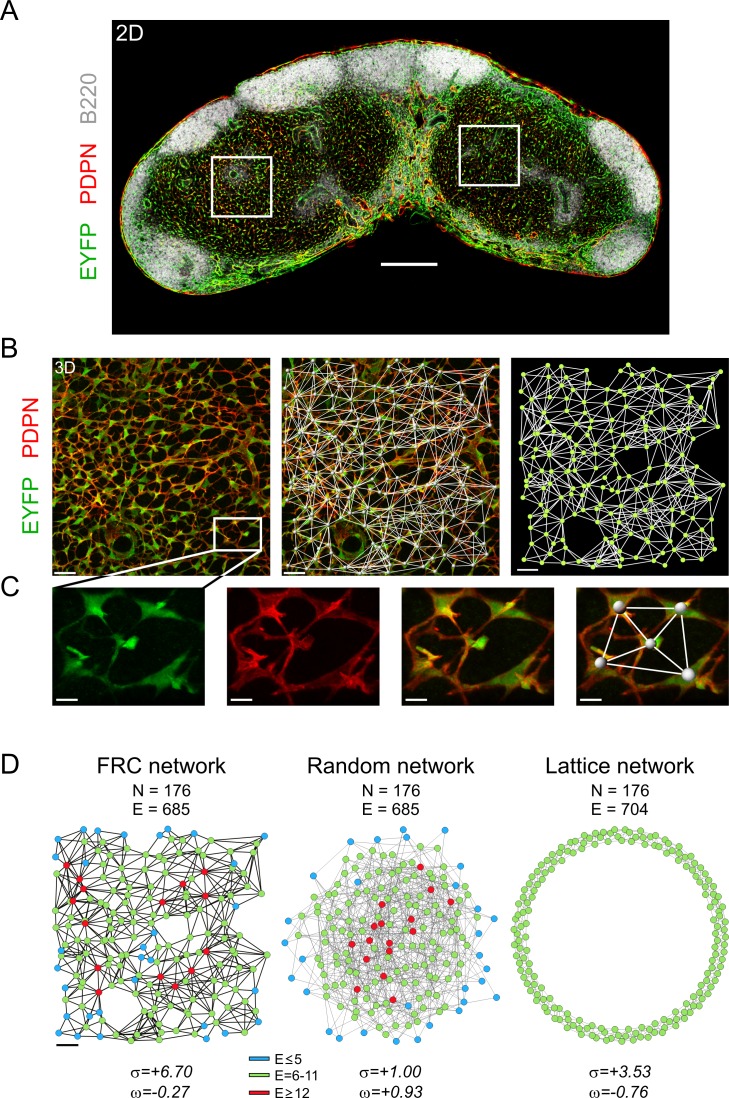
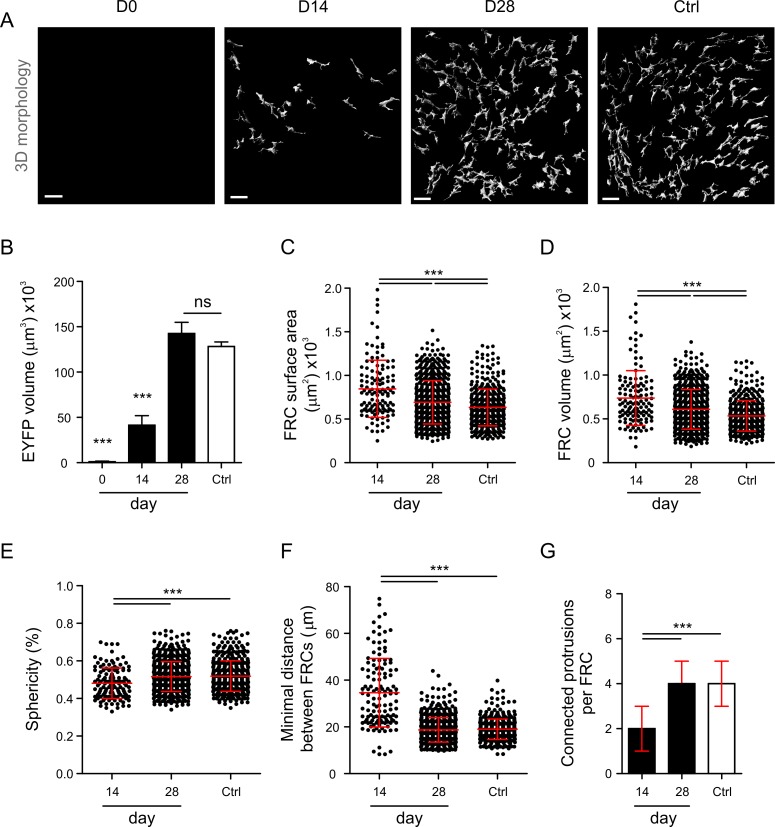
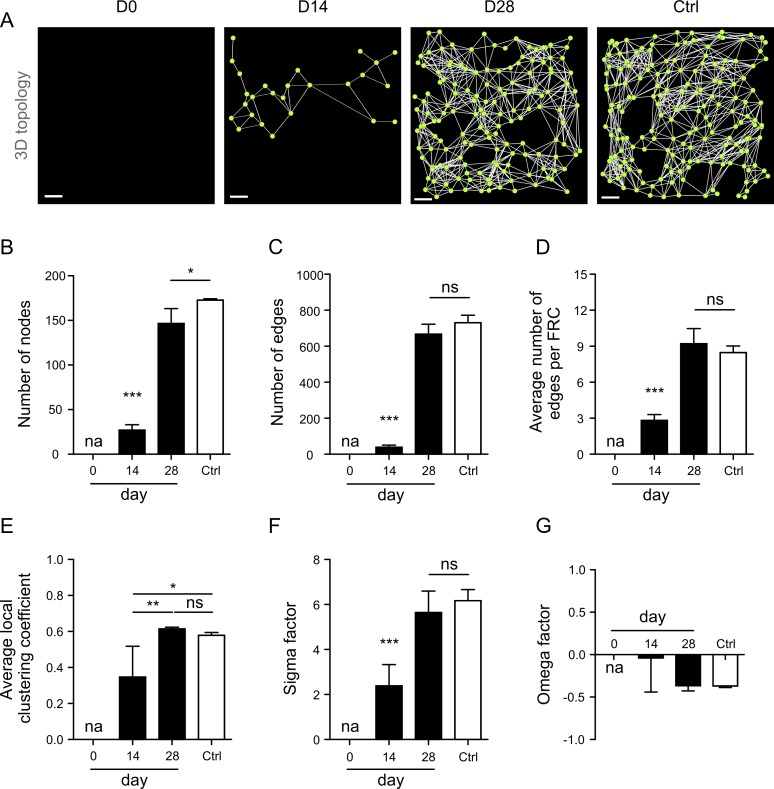
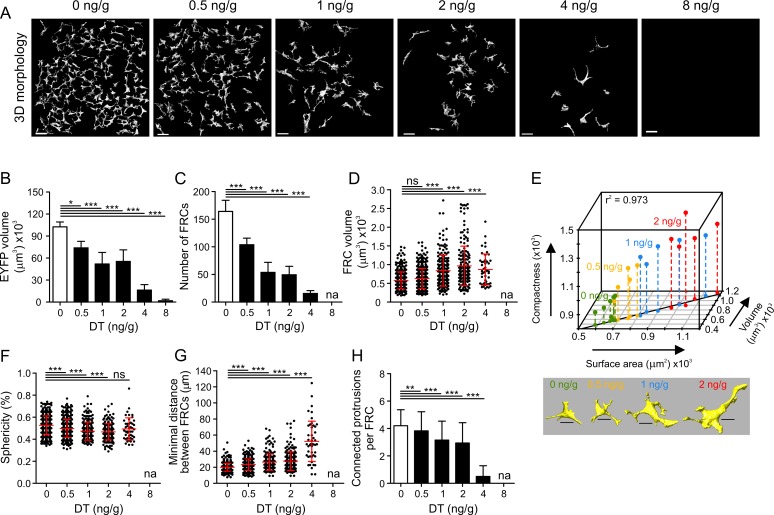
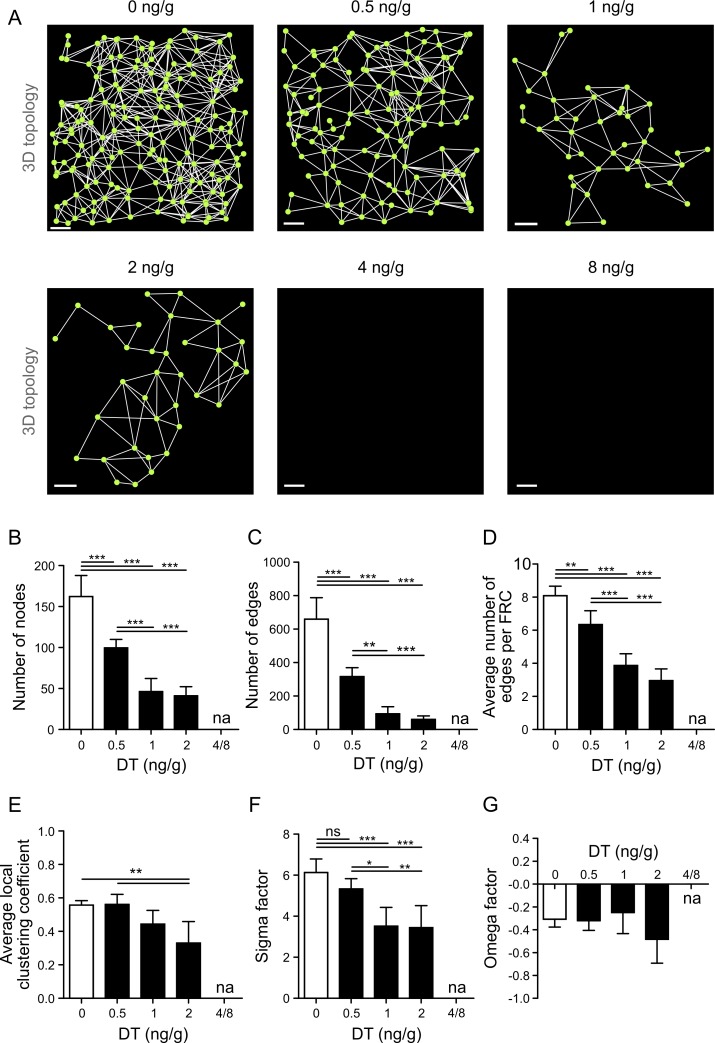
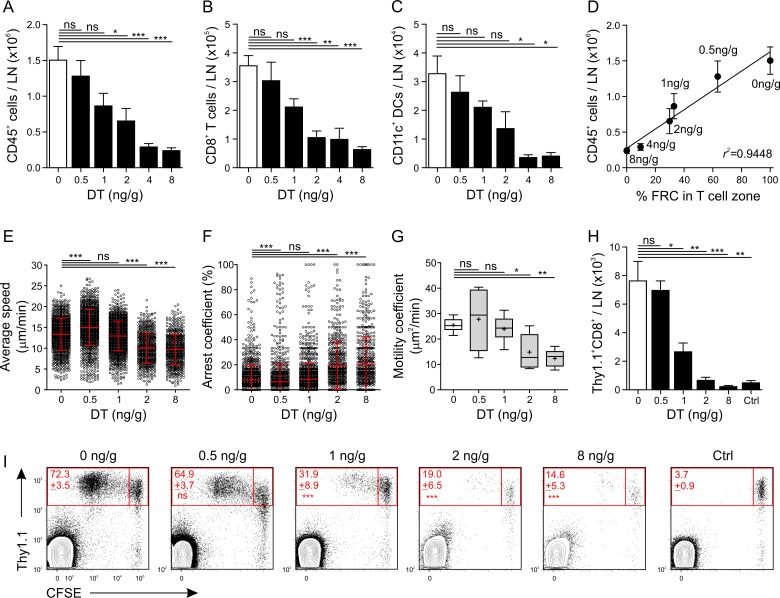
Fibroblastic reticular cells (FRCs) form the cellular scaffold of lymph nodes (LNs) and establish distinct microenvironmental niches to provide key molecules that drive innate and adaptive immune responses and control immune regulatory processes. Here, we have used a graph theory-based systems biology approach to determine topological properties and robustness of the LN FRC network in mice. We found that the FRC network exhibits an imprinted small-world topology that is fully regenerated within 4 wk after complete FRC ablation. Moreover, in silico perturbation analysis and in vivo validation revealed that LNs can tolerate a loss of approximately 50% of their FRCs without substantial impairment of immune cell recruitment, intranodal T cell migration, and dendritic cell-mediated activation of antiviral CD8+ T cells. Overall, our study reveals the high topological robustness of the FRC network and the critical role of the network integrity for the activation of adaptive immune responses.


Conflict of interest statement

The authors have declared that no competing interests exist.

Figures

Fig 1
Fig 1. Assessing the topology of the T cell zone FRC network.
(A) Overview 2-D image of an inguinal LN section from a naive adult Ccl19eyfp mouse stained with antibodies against the indicated markers. Rectangles indicate representative T cell zones acquired with high-resolution confocal microscopy. (B) Representative 3-D Z-stack indicating the T cell zone FRCs (left panel), merged with FRC network (middle panel) and the network representation (right panel) with nodes (FRCs) and edges (physical connections). Size of T cell zone image: 304 x 304 x 32 μm. (C) Zoom-in area of single FRCs from (B, left panel) with signals for EYFP, PDPN, merged, and network representation, respectively. (D) Representative FRC network from (B, right panel). The equivalent random network was constructed using the Erdos-Renyi model, and the regular ring lattice network was constructed with eight edges for every node (FRC network median). Lattice and random networks are shown in Kamada-Kawai representation, while the FRC network is arranged in the real coordinate system of the LN T cell zone. N denotes the number of nodes, and E denotes the number of edges for each network. Small-world parameters σ and ω are shown below. The color legend represents number of edges per node. Data are representative of six mice from two independent experiments. Scale bars represent 300 μm (A), 30 μm (B, D), and 10 μm (C).
Fig 2
Fig 2. Changes in FRC morphology following diphtheria toxin (DT)-mediated ablation.
(A) Three-dimensional single-cell reconstruction of the T cell zone FRC network in Ccl19eyfp/idtr mice at indicated time points after two intraperitoneal (IP) injections of 8 ng/g DT or phosphate-buffered saline (PBS)-treated controls. Scale bars represent 30 µm. (B) Global morphological analysis of the total FRC network volume from the 3-D-reconstructed EYFP channel. (C–G) Single-cell analysis of FRC surface area (C), volume (D), sphericity (E), minimal distance between FRCs (F), and connected protrusions per FRC (G). Each dot represents a measurement for a single FRC. Data represent mean ± standard deviation (SD) (B–F) and median ± interquartile range (IQR) (G) for 3–5 mice per group. * p < 0.05, ** p < 0.01, *** p < 0.001 (one-way ANOVA with Tukey’s post-test [B–F] or Kruskal-Wallis test with Dunn’s post-test [G]). ns, not significant.
Fig 3
Fig 3. FRC network restoration following DT-mediated ablation.
(A) Representative FRC network analysis using nodes as single FRC centers of mass and edges as physical connections between adjacent cells. Scale bars represent 30 µm. (B–G) Topological network analysis of the FRC network at indicated time points after two IP injections of 8 ng/g DT or PBS-treated controls. Network-level statistics shown are total number of nodes (B) and edges (C) in the network, average number of edges per FRC (D), average local clustering coefficient (E), and small-world parameters σ (F) and ω (G). Data represent mean ± SD for 3–5 mice per group. * p < 0.05, ** p < 0.01, *** p < 0.001 (one-way ANOVA with Tukey’s post-test). ns, not significant; na, not applicable.
Fig 4
Fig 4. Alterations in FRC morphology following partial FRC ablation.
(A) Representative 3-D single-cell reconstructions of the T cell zone FRC network in Ccl19eyfp/idtr mice injected twice IP with indicated doses of DT. (B) Total volume of the EYFP+ T cell zone FRC network for indicated doses of DT. (C) Number of single FRCs per acquired T cell zone for indicated doses of DT. (D–H) Single-cell analysis of FRC volume (D); correlation of surface area, volume, and compactness (E); sphericity (F); minimal distance between FRCs (G); and connected protrusions per FRC (H). Values in (B–C) represent mean ± SD for each T cell zone FRC dataset and in (D, F–H) represent mean ± SD for each single FRC for 3–6 mice per group from two independent experiments. Vertical lines in the 3-D plot (E) represent projections on the bottom 2-D plane. The line on the 2-D plane represents a linear regression model for surface area and volume with indicated Pearson correlation coefficient r2 = 0.973, p = 2.71 x 10⁻¹⁶ (Fisher’s F test). Images below are representative 3-D reconstructions of FRCs for indicated doses of DT. Scale bars represent 30 μm (A) and 10 μm (E). * p < 0.05, ** p < 0.01, *** p < 0.001 (one-way ANOVA with Tukey’s post-test [B–D and F–G] or Kruskal-Wallis test with Dunn’s post-test [H]). ns, not significant; na, not applicable.
Fig 5
Fig 5. Gradual FRC ablation reveals thresholds for FRC network integrity.
(A) Topological analysis of the FRC network in Ccl19eyfp/idtr mice injected twice IP with indicated doses of DT. Scale bars represent 30 μm. (B–G) Network analysis of the FRC network at indicated doses of DT. Network-level statistics shown are total number of nodes (B) and edges (C) in the network, average number of edges per FRC (D), average local clustering coefficient (E), and small-world parameters σ (F) and ω (G). Data represent mean ± SD for 3–6 mice per group from two independent experiments. * p < 0.05, ** p < 0.01, *** p < 0.001 (one-way ANOVA with Tukey’s post-test). ns, not significant; na, not applicable.
Fig 6
Fig 6. Graph theory-based analysis of the FRC network topological robustness.
(A) In silico perturbation analysis of a representative FRC network from PBS-treated control mice by random node removal for one simulation. Each image denotes the FRC network in a real coordinate system of the LN T cell zone at indicated fractions of nodes randomly removed. The number of nodes remaining and the starting number of nodes are indicated in the top right of each image. Green nodes represent the largest connected cluster, and blue nodes represent fragmented clusters. See S2 Video for the full simulation. (B) Average shortest path length versus fraction of nodes removed. The dashed line represents fraction of nodes removed for the maximal value of average shortest path length, i.e., the network threshold point. (C) Relative size of the largest cluster compared to the size of the starting network at 0% versus fraction of nodes removed. The indicated value in the top right denotes estimated network robustness R. The dashed line represents the minimal damage line. Data represent mean ± SD over 1,000 simulations of random node removals for a representative FRC network (n = 6 mice from two independent experiments). (D) Network robustness R values for FRC networks at indicated doses of DT. Data represent mean ± SD for 3–6 mice per group from two independent experiments. * p < 0.05, ** p < 0.01, *** p < 0.001 (one-way ANOVA with Tukey’s post-test). ns, not significant; na, not applicable.
Fig 7
Fig 7. Impairment of LN functionality following FRC ablation.
LN cellularity as determined by flow cytometry with total numbers of CD45+ hematopoietic cells (A), CD8+ T cells (B), and CD11c+ DCs (C) in Ccl19idtr mice injected twice IP with the indicated doses of DT. (D) Correlation between CD45+ cells and FRCs remaining in the LN for indicated doses of DT with Pearson correlation coefficient r2 = 0.9448, p = 0.00117 (Fisher’s F test). (E–G) Two-photon microscopy analysis of adoptively transferred CD8+ T cells into Ccl19idtr mice injected IP with indicated doses of DT. The migration parameters analyzed include average cell speed (E), cell arrest coefficient (F), and motility coefficient (G). (H) Total numbers of transferred TCR-transgenic Thy1.1+CD8+ T cells in Ccl19idtr LNs at indicated doses of DT. (I) Flow cytometric analysis of CD8+ T cell activation in Ccl19idtr LNs on day 3 post immunization with DC-targeting viral particles. Numbers indicate mean percentage ± standard error of the mean (SEM) of proliferating Thy1.1+ cells of the whole Thy1.1+ population. Indicated p-values represent comparison to the 0 ng/g group. Controls indicate PBS-treated mice without viral particles. Representative experiment for 3–6 mice per group from three independent experiments. Data represent mean ± SEM for 3–20 mice per group from three independent experiments (A–D, H). Data represent mean ± SD (E–F) or median ± range (G) for 5–10 datasets from 2–3 mice per group from two independent experiments. Plus “+” indicates mean. * p < 0.05, ** p < 0.01, *** p < 0.001 (one-way ANOVA with Tukey’s post-test [A–C, H–I] and Benferroni’s post-test [G] or Kruskal-Wallis test with Dunn’s post-test [E–F]). ns, not significant.

References

    1. Junt T, Scandella E, Ludewig B. Form follows function: lymphoid tissue microarchitecture in antimicrobial immune defence. Nat Rev Immunol. 2008;8: 764–775. 10.1038/nri2414 - DOI - PubMed
    1. Blattman JN, Antia R, Sourdive DJ, Wang X, Kaech SM, Murali-Krishna K, et al. Estimating the precursor frequency of naive antigen-specific CD8 T cells. J Exp Med. 2002;195: 657–664. - PMC - PubMed
    1. Moon JJ, Chu HH, Pepper M, McSorley SJ, Jameson SC, Kedl RM, et al. Naive CD4(+) T cell frequency varies for different epitopes and predicts repertoire diversity and response magnitude. Immunity. 2007;27: 203–213. - PMC - PubMed
    1. Scandella E, Bolinger B, Lattmann E, Miller S, Favre S, Littman DR, et al. Restoration of lymphoid organ integrity through the interaction of lymphoid tissue-inducer cells with stroma of the T cell zone. Nat Immunol. 2008;9: 667–675. 10.1038/ni.1605 - DOI - PubMed
    1. Chai Q, Onder L, Scandella E, Gil-Cruz C, Perez-Shibayama C, Cupovic J, et al. Maturation of Lymph Node Fibroblastic Reticular Cells from Myofibroblastic Precursors Is Critical for Antiviral Immunity. Immunity. 2013;38: 1013–1024. 10.1016/j.immuni.2013.03.012 - DOI - PMC - PubMed

Publication types

MeSH terms

Substances