Randomized Controlled Trial
. 2016 Jul 14;12(7):e1005661.
doi: 10.1371/journal.ppat.1005661. eCollection 2016 Jul.

Exhaustion of Activated CD8 T Cells Predicts Disease Progression in Primary HIV-1 Infection

Affiliations
Randomized Controlled Trial

Exhaustion of Activated CD8 T Cells Predicts Disease Progression in Primary HIV-1 Infection

Matthias Hoffmann et al. PLoS Pathog. .

Abstract

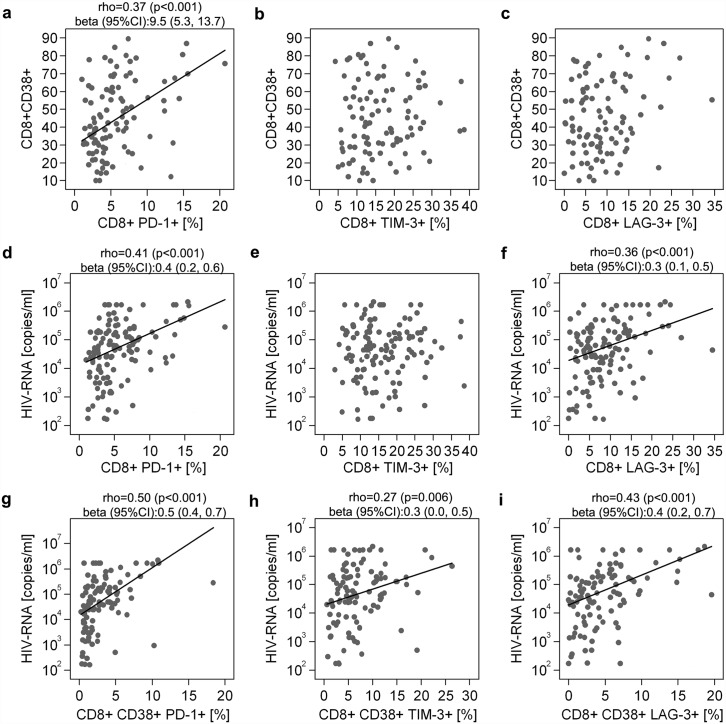
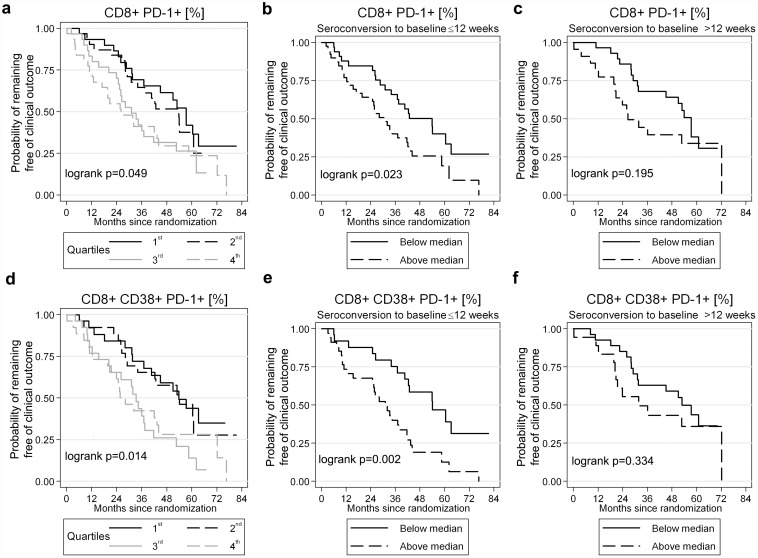
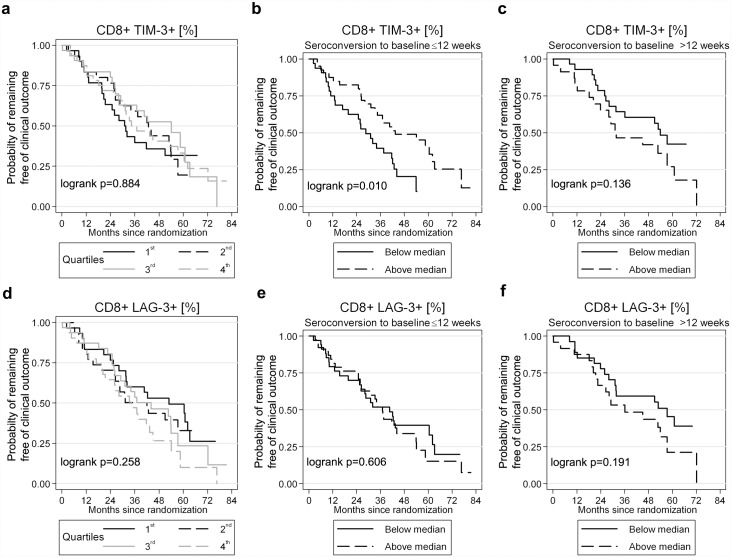
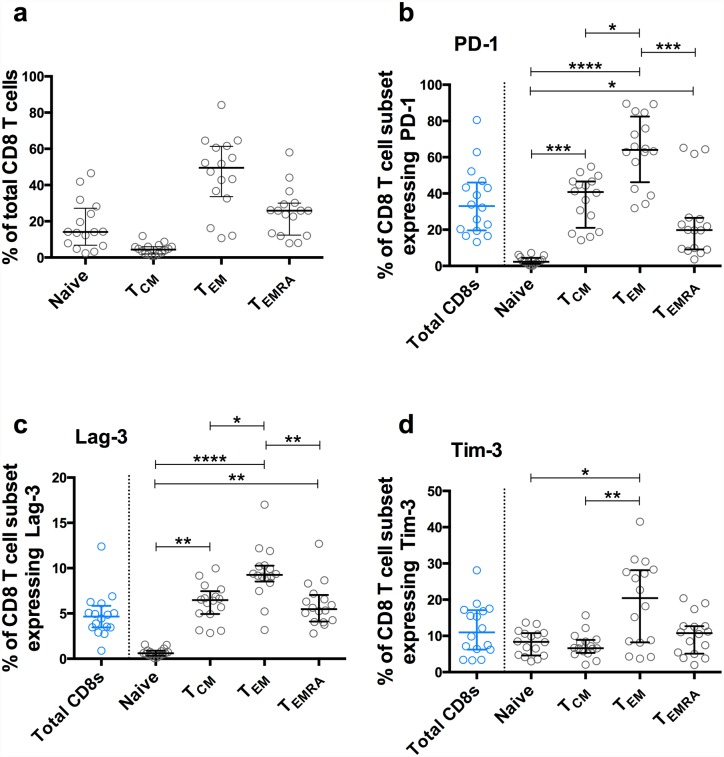
The rate at which HIV-1 infected individuals progress to AIDS is highly variable and impacted by T cell immunity. CD8 T cell inhibitory molecules are up-regulated in HIV-1 infection and associate with immune dysfunction. We evaluated participants (n = 122) recruited to the SPARTAC randomised clinical trial to determine whether CD8 T cell exhaustion markers PD-1, Lag-3 and Tim-3 were associated with immune activation and disease progression. Expression of PD-1, Tim-3, Lag-3 and CD38 on CD8 T cells from the closest pre-therapy time-point to seroconversion was measured by flow cytometry, and correlated with surrogate markers of HIV-1 disease (HIV-1 plasma viral load (pVL) and CD4 T cell count) and the trial endpoint (time to CD4 count <350 cells/μl or initiation of antiretroviral therapy). To explore the functional significance of these markers, co-expression of Eomes, T-bet and CD39 was assessed. Expression of PD-1 on CD8 and CD38 CD8 T cells correlated with pVL and CD4 count at baseline, and predicted time to the trial endpoint. Lag-3 expression was associated with pVL but not CD4 count. For all exhaustion markers, expression of CD38 on CD8 T cells increased the strength of associations. In Cox models, progression to the trial endpoint was most marked for PD-1/CD38 co-expressing cells, with evidence for a stronger effect within 12 weeks from confirmed diagnosis of PHI. The effect of PD-1 and Lag-3 expression on CD8 T cells retained statistical significance in Cox proportional hazards models including antiretroviral therapy and CD4 count, but not pVL as co-variants. Expression of 'exhaustion' or 'immune checkpoint' markers in early HIV-1 infection is associated with clinical progression and is impacted by immune activation and the duration of infection. New markers to identify exhausted T cells and novel interventions to reverse exhaustion may inform the development of novel immunotherapeutic approaches.


Conflict of interest statement

We were unable to contact Stephen Hickling, listed as an author of this paper, to confirm his involvement in the latest version. The corresponding author, John Frater, has therefore supplied the information regarding his contribution to the manuscript and his competing interests and it is correct to the best of his knowledge. The authors are not aware of any other potential conflict of interest associated with this manuscript.

Figures

Fig 1
Fig 1. Association between PD-1, Tim-3 or Lag-3 expression on CD8 T cells with CD38 expression and HIV-1 plasma viral load.
Expression of PD-1, Tim-3 and Lag-3 expression on CD8 T cells was compared with expression of CD38 on CD8 T cells (a-c). Expression of PD-1, Tim-3 and Lag-3 expression on both CD8 T cells (d-f) and CD8 CD38 T cells (g-i) was correlated with plasma viral load measured at the same time. Associations were evaluated using Spearman correlations. P values and Spearman’s rho are presented. The fitted line, superimposed in the relevant scatterplots, was estimated through linear regression. For significant results, the value of beta (the estimated change in the vertical axis variables (log10 scale for HIV-1 RNA) per 1 SD increase in horizontal axis variables) and its confidence intervals (CI) are reported.
Fig 2
Fig 2. Impact of PD-1 expression on CD8 or CD38 CD8 T cells on clinical outcome.
Survival analyses to show the effect of PD-1 expression on (a-c) CD8 and (d-f) CD38 CD8 cells on time to the primary end-point in the SPARTAC trial (CD4 T cell count <350 cells/μl or initiation of long-term ART). In panels a and d, percentage of PD-1 expression is stratifed into quartiles and significance is tested using a log rank test. Survival analyses show the impact of estimated time since seroconversion (reported as ≤12 weeks or >12 weeks) and PD-1 baseline expression on CD8 (b-c) and CD38 CD8 (e-f) T cells. Here, percentage PD-1 expression is stratifed at the median value.
Fig 3
Fig 3. Impact of CD8 T cell Tim-3 and Lag-3 expression on clinical outcome.
Survival analyses showing the effect of Tim-3 (a-c) and Lag-3 (d-f) expression on time to the primary end-point in the SPARTAC trial (CD4 T cell count <350 cells/μl or initiation of long-term ART). Percentage of marker expression is stratifed into quartiles (a, d) or, when tested in conjunction with the estimated time since seroconversion (reported as ≤12 weeks (b,e) or >12 weeks (c,f)), at the median value. Significance is tested using a log rank test.
Fig 4
Fig 4. Distribution of PD-1, Lag-3 and Tim-3 expression according to CD8 T cell memory subsets.
Overall distribution of naïve, central memory (TCM), effector memory (TEM) and TEMRA CD8 T cells from pre-therapy baseline samples (a) and percentage expression on each of these subsets at the same time-point of PD-1 (b), Lag-3 (c) and Tim-3 (d). Markers represent medians and interquartile range. *p<0.05, **p<0.01, ***p<0.001, ****p<0.0001. Comparison of exhaustion marker expression across three or more groups was performed using Friedman’s test (non-parametric, paired analysis of variance). Where a difference was found, subsequent pairwise comparisons between groups (Dunn’s test) were performed with adjustment for multiple comparisons targeting on overall significance level of 0.05.
Fig 5
Fig 5. Association between PD-1, Tim-3 or Lag-3 expression on CD8 T cells with T-bet/Eomes and CD39 expression.
The strategy for gating CD8 T cells based on T-bet and Eomes expression is shown in (a). Expression of PD-1 (b), Tim-3 (c), Lag-3 (d), CD38 (e) and CD39 (f) was compared between CD8 T cells staining T-bethi/Eomesdim and T-betdim/Eomeshi populations. The panels on the right show the expression of these markers from a single, representative sample with T-bethi/Eomesdim (red line) and T-betdim/Eomeshi (blue line) overlaid with gating control (orange line). The shaded area highlights cells that were considered positive for the marker. Expression of exhaustion markers between two subsets was compared using Wilcoxon matched-pairs signed rank test.

References

    1. Feeney ME, Tang Y, Roosevelt KA, Leslie AJ, McIntosh K, Karthas N, et al. Immune escape precedes breakthrough human immunodeficiency virus type 1 viremia and broadening of the cytotoxic T-lymphocyte response in an HLA-B27-positive long-term-nonprogressing child. J Virol. 2004;78: 8927–8930. - PMC - PubMed
    1. Frater AJ, Brown H, Oxenius A, Gunthard HF, Hirschel B, Robinson N, et al. Effective T-cell responses select human immunodeficiency virus mutants and slow disease progression. J Virol. 2007;81: 6742–6751. - PMC - PubMed
    1. Goulder P, Price D, Nowak M, Rowland-Jones S, Phillips R, McMichael A. Co-evolution of human immunodeficiency virus and cytotoxic T-lymphocyte responses. Immunol Rev. 1997;159: 17–29. - PubMed
    1. Kiepiela P, Leslie AJ, Honeyborne I, Ramduth D, Thobakgale C, Chetty S, et al. Dominant influence of HLA-B In mediating the potential co-evolution of HIV and HLA. Nature. 2004;432: 769–774. - PubMed
    1. Leslie AJ, Pfafferott KJ, Chetty P, Draenert R, Addo MM, Feeney M, et al. HIV evolution: CTL escape mutation and reversion after transmission. Nat Med. 2004;10: 282–289. - PubMed

Publication types

MeSH terms