. 2017 Jan 1;595(1):321-339.
doi: 10.1113/JP272215. Epub 2016 Aug 13.

Linear transformation of the encoding mechanism for light intensity underlies the paradoxical enhancement of cortical visual responses by sevoflurane

Affiliations

Linear transformation of the encoding mechanism for light intensity underlies the paradoxical enhancement of cortical visual responses by sevoflurane

Alessandro Arena et al. J Physiol. .

Abstract

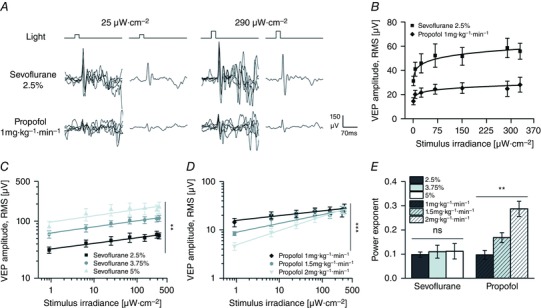
Key points: The mechanisms of action of anaesthetics on the living brain are still poorly understood. In this respect, the analysis of the differential effects of anaesthetics on spontaneous and sensory-evoked cortical activity might provide important and novel cues. Here we show that the anaesthetic sevoflurane strongly silences the brain but potentiates in a dose- and frequency-dependent manner the cortical visual response. Such enhancement arises from a linear scaling by sevoflurane of the power-law relation between light intensity and the cortical response. The fingerprint of sevoflurane action suggests that circuit silencing can boost linearly synaptic responsiveness presumably by scaling the number of responding units and/or their correlation following a sensory stimulation.

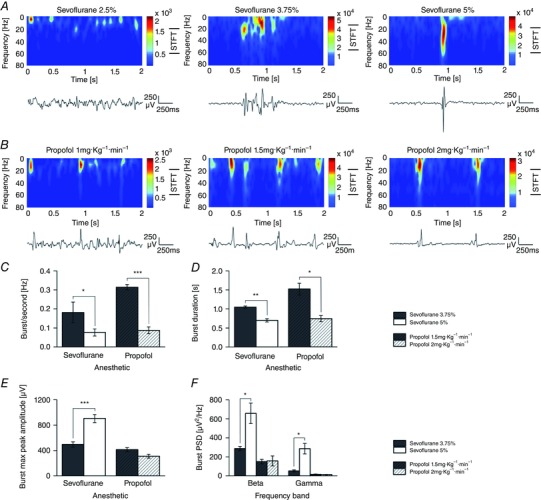
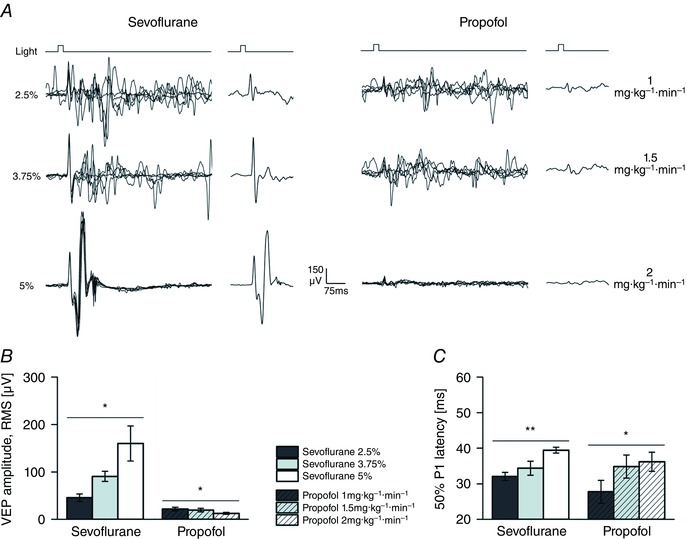
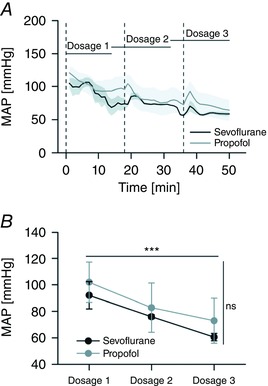
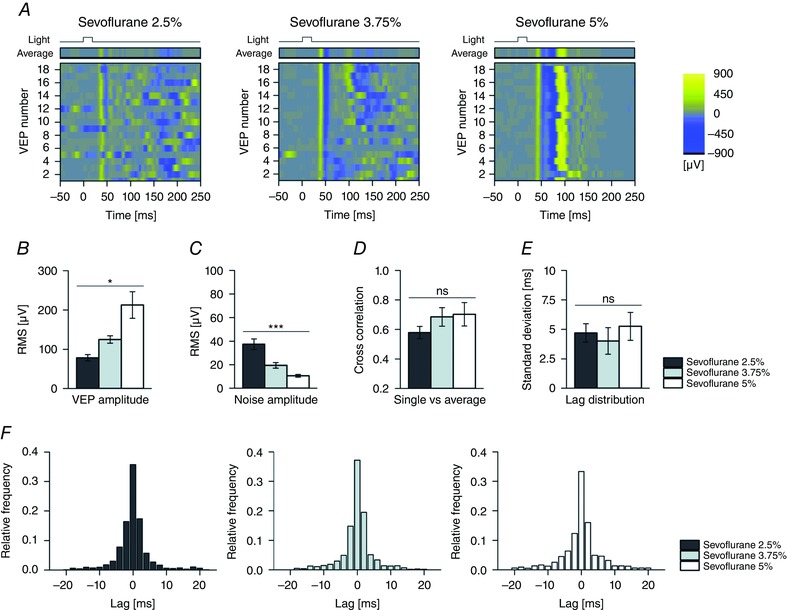
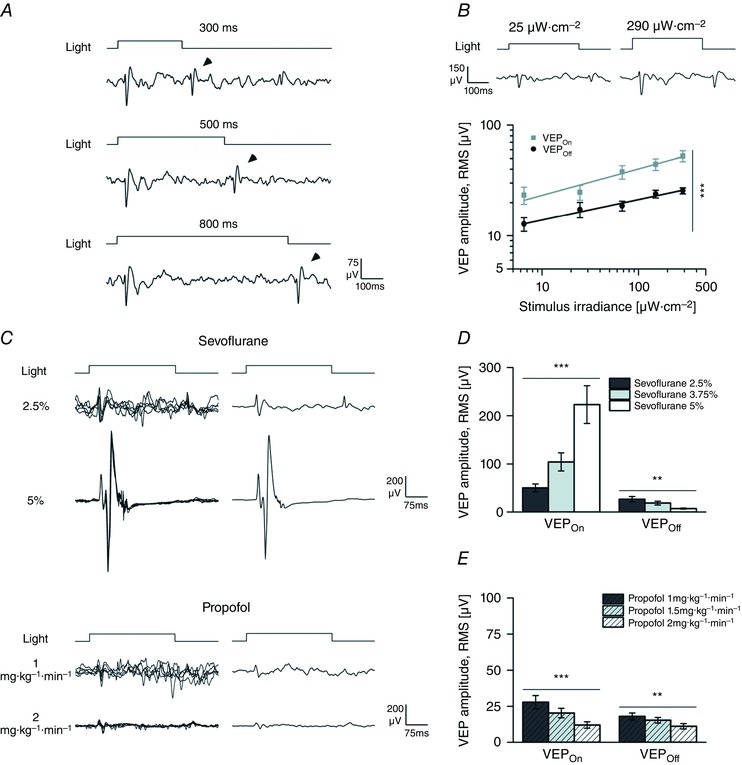
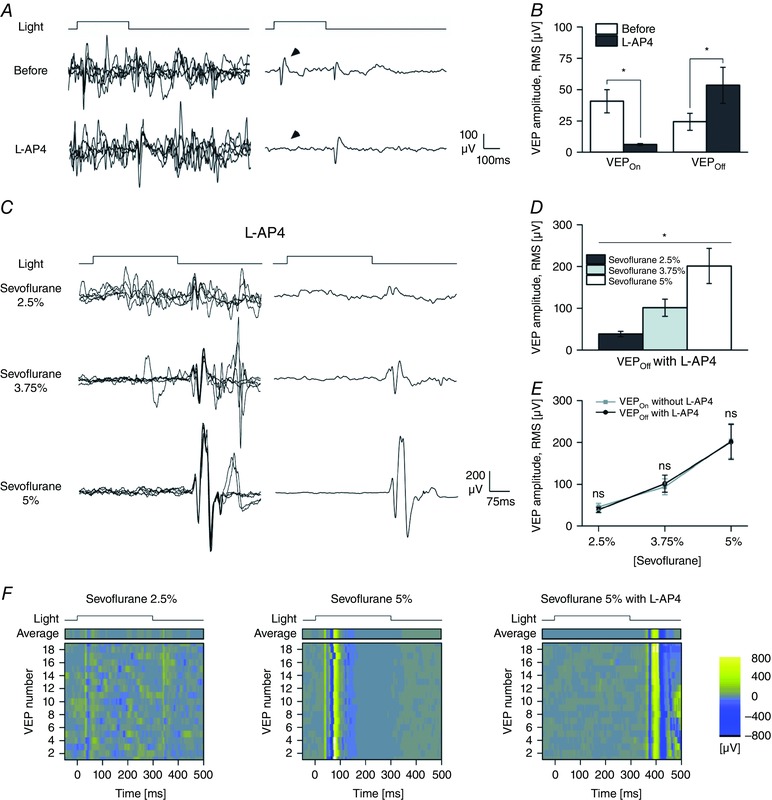
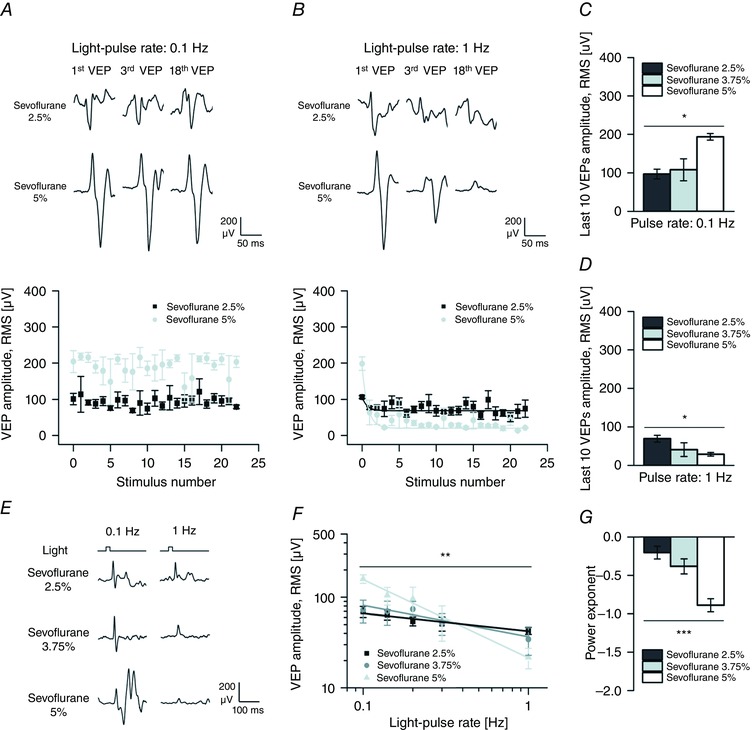
Abstract: General anaesthetics, which are expected to silence brain activity, often spare sensory responses. To evaluate differential effects of anaesthetics on spontaneous and sensory-evoked cortical activity, we characterized their modulation by sevoflurane and propofol. Power spectra and the bust-suppression ratio from EEG data were used to evaluate anaesthesia depth. ON and OFF cortical responses were elicited by light pulses of variable intensity, duration and frequency, during light and deep states of anaesthesia. Both anaesthetics reduced spontaneous cortical activity but sevoflurane greatly enhanced while propofol diminished the ON visual response. Interestingly, the large potentiation of the ON visual response by sevoflurane was found to represent a linear scaling of the encoding mechanism for light intensity. To the contrary, the OFF cortical visual response was depressed by both anaesthetics. The selective depression of the OFF component by sevoflurane could be converted into a robust potentiation by the pharmacological blockade of the ON pathway, suggesting that the temporal order of ON and OFF responses leads to a depression of the latter. This hypothesis agrees with the finding that the enhancement of the ON response was converted into a depression by increasing the frequency of light-pulse stimulation from 0.1 to 1 Hz. Overall, our results support the view that inactivity-dependent modulation of cortical circuits produces an increase in their responsiveness. Among the implications of our findings, the silencing of cortical circuits can boost linearly the cortical responsiveness but with negative impact on their frequency transfer and with a loss of the information content of the sensory signal.

Keywords: anaesthesia; cortical silencing; gain modulation; inactivity-dependent modulation; intensity sensitivity; visual cortex; visual evoked potential.


Figures

Figure 1
Figure 1. Changes in spontaneous cortical activity induced by sevoflurane and propofol
A, spontaneous cortical voltage oscillations observed in an exemplar experiment where the animal was exposed to three different concentrations of sevoflurane (top; 2.5, 3.75 and 5%) and propofol (bottom; 1, 1.5 and 2 mg kg−1 min−1; traces from the same rat kept in the dark and exposed to the two different anaesthetics in consecutive experimental sessions, 3 days apart). Notice the dose‐dependent change in spontaneous activity with a burst‐suppression pattern for the intermediate and highest anaesthetics doses. B, BSR for both anaesthetics at all dosages (n = 7 rats exposed to both agents). C and D, average periodograms from three representative unfiltered EEG recordings (10 s sweeps, total trace length 110 s) obtained as above for sevoflurane (2.5, 3.75 and 5%; C) and propofol (1, 1.5 and 2 mg kg−1 min−1; D). The sharp peak at 50 Hz in D is from power‐line noise. E and F, mean PSD from quantitative spectral analysis for sevoflurane (E) and propofol (F), on the whole frequency band (0.5–80 Hz; left in both panels E and F) and for single frequency bands (right in both panels E and F) as a function of anaesthetic dosage (n = 7, animals exposed to both anaesthetics). Asterisks indicate significance values (panel B, principal effect by Friedman test; panels E and F, principal effect by one‐way rANOVA; P > 0.05, ns; * P < 0.05; ** P < 0.01; *** P < 0.001).
Figure 2
Figure 2. Analysis of spontaneous bursts induced by sevoflurane and propofol
A and B, spontaneous cortical oscillations and their time–frequency analysis at increasing concentrations of sevoflurane (A; 2.5, 3.75 and 5%) and propofol (B; 1, 1.5 and 2 mg kg−1 min−1; same animal as in A). Notice that when the anaesthetic concentration is increased a clear burst‐suppression pattern is induced (middle and right in A and B). C–F, quantitative burst analysis obtained on identified burst episodes during burst suppression to illustrate the effects of these two anaesthetics on burst frequency (C; n = 5 rats; sevoflurane 3.75%, 0.18 ± 0.05 Hz; sevoflurane 5%, 0.08 ± 0.02 Hz; P < 0.05; propofol 1.5 mg kg−1 min−1, 0.31 ± 0.01 Hz; propofol 2 mg kg−1 min−1, 0.09 ± 0.02 Hz; P < 0.001; paired‐samples t test), burst duration (D), burst maximum peak amplitude (E), and their beta and gamma power (F). A parallel decrement of burst duration (D) was detected with both anaesthetics and this was dose‐dependent (sevoflurane 3.75%, 1.04 ± 0.03 s; 5%, 0.70 ± 0.04 s; P < 0.01, paired‐samples t test; propofol 1.5 mg kg−1 min−1, 1.52 ± 0.15 s; 2 mg kg−1 min−1, 0.74 ± 0.08 s; P < 0.05, paired‐samples t test). Notice the opposite effects of sevoflurane and propofol on burst maximum peak amplitude (E; sevoflurane 3.75%, 495.39 ± 42.05 μV; 5%, 903.80 ± 63.77 μV; n = 5 rats; P < 0.001, paired‐samples t test). Notice that this potentiation of burst peak amplitude was not seen with propofol (propofol 1.5 mg kg−1 min−1, 414.18 ± 31.33 μV; 2 mg kg−1 min−1, 310.41 ± 30.21 μV; n = 5 rats; P > 0.05, paired‐samples t test). F, analysis of the beta and gamma power of identified bursts during the burst suppression phase. Notice the clear dose increase in gamma and beta power for sevoflurane but not propofol (beta power: sevoflurane 3.75%, 287.36 ± 22.8 μV2 Hz−1; sevoflurane 5%, 657.43 ± 109.02 μV2 Hz−1; P < 0.05; gamma power: sevoflurane 3.75%, 50.71 ± 10.92 μV2 Hz−1; sevoflurane 5%, 286.30 ± 55.41 μV2 Hz−1; P < 0.05;). (Panels C–F, paired‐samples t test; * P < 0.05; ** P < 0.01; *** P < 0.001.)
Figure 3
Figure 3. Opposite changes induced by sevoflurane and propofol on visual response
A, single VEP traces and ensemble averages from an individual animal exposed to brief light pulses (pulse duration 20 ms; pulse irradiance 25 μW cm−2; pulse rate 0.1 Hz) at incremental concentrations of sevoflurane (2.5, 3.75 and 5%; left) and propofol (1, 1.5 and 2 mg kg−1 min−1; right). B and C, bars graphs of VEP amplitude (B; RMS amplitude, first 150 ms from stimulus onset, estimated from the averaged waveform) and the onset of the P1 deflection (C; mean latency of the 50% of P1 amplitude). These estimates were obtained from the same animals, each exposed to all dosages of both anaesthetics in two separate experimental sessions, run a few days apart (n = 6 rats). Notice how, sevoflurane increased the VEP amplitude in a concentration‐dependent fashion, while propofol did the opposite. Also notice that the VEP latency was incremented by both drugs, indicating a common reduction in neuronal excitability. Asterisks indicate significance values (B and C, principal effect by one‐way rANOVA; P > 0.05, ns; * P < 0.05; ** P < 0.01; *** P < 0.001).
Figure 4
Figure 4. Comparable changes of mean arterial pressure induced by sevoflurane and propofol
A, time courses of the mean arterial pressure (MAP) during stepwise increments of sevoflurane and propofol concentration (n = 4 rats; Dosage 1: sevoflurane 2.5%, propofol 1 mg kg−1 min−1; Dosage 2: sevoflurane 3.75%, propofol 1.5 mg kg−1 min−1; Dosage 3: sevoflurane 5%, propofol 2 mg kg−1 min−1). Dashed lines indicate the time points for atracurium injections. The grey envelopes plot the standard errors of the mean. MAP was recorded by the cannulation of the femoral artery. B, averages of MAP estimates (15 min epochs) for all dosages and anaesthetics. The increment of the concentration of both anaesthetics induced a comparable drop in MAP (n = 4 rats; P < 0.001; principal effect of anaesthetic dosage, two‐way rANOVA) but for each step in anaesthetic concentration the effects of sevoflurane and propofol were not significantly different (P > 0.05 for all anaesthetics pairs, paired‐samples t test; P > 0.05, principal effect of anaesthetic agent, two‐way rANOVA). (A and B, principal effects by two‐way rANOVA; P > ns; *** P < 0.001.)
Figure 5
Figure 5. Analysis of the effects of sevoflurane on single VEPs
A, raster plots of individual and sequential visual responses and their ensemble averages (top) at three different sevoflurane concentrations (same experiment presented in Fig. 3 A; pulse duration, 20 ms; pulse irradiance, 25 μW cm−2; pulse rate, 0.1 Hz; sevoflurane, 2.5, 3.75 and 5%). Notice how in different trials, the VEP onset is highly reproducible while pre‐stimulus and late activity show large inter‐trial variability; B and C, bar graph of RMS amplitude estimated from individual VEPs and their pre‐stimulus spontaneous activity or cortical noise (B; first 150 ms from stimulus onset; C; first 50 ms before stimulus onset; n = 6 rats exposed to all dosages of sevoflurane). The RMS estimates from single VEPs agree with average waveform analysis (Fig. 3 B). The amplitude of cortical noise decreased with a concentration trend similar to that found with PSD (Fig. 1 E). D, bar graph of cross‐correlation at lag 0 between single VEP traces and their ensemble average (n = 6 rats). This result indicates that in our conditions the representativeness of the ensemble average (n = 19 individual VEPs) is not significantly affected by the dosage of sevoflurane. E and F, lag of the first positive cross‐correlation peak between all pairs of individual VEPs (E, standard deviation; F, lag distributions; n = 6 rats, each exposed to all dosages of sevoflurane). This analysis indicates that the phase jittering of individual visual evoked responses displays a high temporal reliability at all sevoflurane concentrations. Asterisks are significance values (B and C, principal effect by one‐way rANOVA; D and E, principal effect by Friedman's test; P > 0.05, ns; * P < 0.05; ** P < 0.01; *** P < 0.001).
Figure 6
Figure 6. Light‐intensity response curves reveal an interaction between light signalling and propofol but not sevoflurane
A, single VEPs and ensemble averages from a representative animal exposed to light pulses of different intensities (same rat of Fig. 3 A; irradiance values: 25 μW cm−2, left; 290 μW cm−2, right; duration, 20 ms; rate, 0.1 Hz) in the presence of sevoflurane (2.5%; top) and propofol (1 mg kg−1 min−1; bottom). B, superimposition of light‐intensity response curves obtained in the presence of sevoflurane (2.5%) and propofol (1 mg kg−1 min−1) (n = 6 rats exposed to both anaesthetics). The continuous lines are power fitting of these curves (sevoflurane: adjusted R² = 0.97, power exponent = 0.098, P < 0.001; propofol: adjusted R² = 0.93, power exponent = 0.099, P < 0.001; F test). Notice the curve scaling up with sevoflurane with similar power exponent. C and D, light‐intensity response curves in log–log plots obtained with sevoflurane (C) and propofol (D) at different anaesthetic dosages. The continuous lines are power fitting of these curves (sevoflurane 2.5%: adjusted R 2 = 0.97, P < 0.001; sevoflurane 3.75%: adjusted R 2 = 0.97, P < 0.001; sevoflurane 5%: adjusted R 2 = 0.72, P < 0.01; propofol 1 mg kg−1 min−1: adjusted R 2 = 0.92, P < 0.001; propofol 1.5 mg kg−1 min−1: adjusted R 2 = 0.95, P < 0.001; propofol 2 mg kg−1 min−1: adjusted R 2 = 0.99, P < 0.01; F test). The data used for the lowest dosage of both anaesthetics are the same as used in B. Notice how with increasing concentration of sevoflurane the stimulus–response curve fully translates to higher response values indicating a multiplicative action between the mechanisms of light stimulus processing and the neural effects of sevoflurane. Notice the inhibiting effect of propofol at low light intensities and the graded relief of this inhibition when the light intensity is increased. E, estimates of the power exponents obtained by fittings the light‐intensity response curves from individual experiments (n = 6 rats). A significant change in the exponent is seen with increasing concentration of propofol but not sevoflurane. Asterisks are significance values (panels C and D, principal effect by two‐way rANOVA; E, principal effect by one‐way rANOVA; P > 0.05, ns; * P < 0.05; ** P < 0.01; *** P < 0.001).
Figure 7
Figure 7. Effects of sevoflurane and propofol on VEPOn and VEPOff
A, ensemble VEPs from a representative animal exposed to randomized light pulses of different duration (pulse duration range 300–800 ms; pulse irradiance 150 μW cm−2; pulse rate 0.1 Hz) recorded in the presence of sevoflurane (2.5%). Notice the presence of clear ON and OFF responses. By increasing stimulus duration the OFF response (arrow tips) was shifted in time. B, stimulus irradiance curves for the ON and OFF responses in log‐log plots (pulse irradiance range, 6.5–290 μW cm−2; pulse duration, 300 ms; pulse rate, 0.1 Hz; n = 7 rats) in the presence of sevoflurane (2.5%). Two exemplar responses (ensemble VEPs) are plotted at the top. In most experiments, with a 300 ms pulse duration the OFF response was smaller than the ON signal. Notice how both ON and OFF amplitudes similarly increased with increasing irradiances. The continuous lines are power fitting of these curves (VEPOn adjusted R 2 = 0.93; P < 0.01; VEPOff adjusted R 2 = 0.96; P < 0.01, F test). C, single traces (left) and ensemble VEP averages (right) obtained in the presence of two different sevoflurane (2.5 and 5%; top) and propofol (1 and 2 mg kg−1 min−1; bottom) concentrations from representative recordings (pulse duration, 300 ms; pulse irradiance, 150 μW cm−2; pulse rate, 0.1 Hz). Notice how high concentration of sevoflurane enhanced the ON and suppressed the OFF responses. Also notice that the effect of propofol was a more generalized reduction of both ON and OFF components. D and E, quantitative analysis of the effects of sevoflurane (D) and propofol (E) on VEPOn and VEPOff waveform amplitude. Asterisks are significance values (B, paired‐samples t test; D and E, principal effect by one‐way rANOVA; P > 0.05, ns; * P < 0.05; ** P < 0.01; *** P < 0.001).
Figure 8
Figure 8. l‐AP4 reverts the sevoflurane‐induced inhibition of the VEPOff
A, traces on the left are single sweeps and traces on the right are the ensemble averages of light responses (averages of n = 59 traces; pulse irradiance 150 μW cm−2; pulse duration 300 ms; pulse rate 0.1 Hz) obtained before (upper traces) and after the vitreal injection of the ON pathway suppressor l‐AP4 (bottom traces; final concentration of l‐AP4 2 mm; sevoflurane 2.5%) in a representative experiment. The arrowheads indicate the ON response. B, bars plot the amplitude of the VEPOn and VEPOff before and after the application of l‐AP4 (n = 5; sevoflurane, 2.5%). Notice how the intravitreal injection of l‐AP4 fully suppresses the VEPOn waveform while the VEPOff response is spared and potentiated (VEPOff before, 24.44 ± 6.77 μV; VEPOff l‐AP4, 53.44 ± 14.39 μV; P > 0.05, paired‐samples t test). C, single light responses (left) and ensemble VEP averages (right; averages of n = 24 traces) recorded in a representative animal exposed to the three different sevoflurane concentrations (2.5, 3.75 and 5%; light‐pulse duration, 300 ms; pulse irradiance, 150 μW cm−2; pulse rate, 0.1 Hz) in the presence of intravitreal l‐AP4 (2 mm). A clear dose‐dependent enhancement of the VEPOff waveform, reminiscent of the potentiation of the VEPOn response seen in control conditions is manifest. D, bar graph of the amplitude of the OFF response at increasing concentrations of sevoflurane (n = 5 rats). Notice how the increment of the VEPOff amplitude is dose‐dependent. E, the same VEPOff data plotted in D superimposed on the effects of sevoflurane on the VEPOn response seen in the absence of l‐AP4 (same data as plotted in Fig. 7 D) to illustrate the superimposable dose‐dependent behaviour of the potentiation of the VEPOn (control conditions) and VEPOff (in the presence of l‐AP4). F, raster plots of individual and sequential VEPs and their ensemble averages (top) from a control animal (same experiment presented in Fig. 7 C; 2.5 and 5% sevoflurane) and from an animal treated with l‐AP4 (same experiment as presented in C; 5% sevoflurane, 2 mm l‐AP4; pulse duration, 300 ms; pulse irradiance, 150 μW cm−2; pulse rate, 0.1 Hz). Notice how in different trials, the VEPOn and VEPOff responses can be easily recognized and occur with a precise timing. Also notice how the disappearance of the OFF response in 5% sevoflurane and conversely the suppression of the ON and the potentiation of the OFF responses in the presence of l‐AP4 (sevoflurane, 5%: l‐AP4, 2 mm) are consistent findings across trials. Asterisks are significance values (B, paired‐samples t test; E, two‐sample t test; D, principal effect by one‐way rANOVA; P > 0.05, ns; * P < 0.05; ** P < 0.01; *** P < 0.001).
Figure 9
Figure 9. The dose‐dependent potentiation induced by sevoflurane is gradually converted into a dose‐dependent depression by increasing the frequency of stimulation
A and B, variation in time of the amplitude of single VEPs from rats (n = 4) exposed to trains of light pulses (light‐pulse duration 20 ms; pulse irradiance 150 μW cm−2) presented at a lower rate and a higher rate (0.1 Hz, A; 1 Hz, B) in the presence of low and high dosages of sevoflurane (2.5 and 5%). Top panels show 3 single responses from a representative rat, while the bottom panels show the mean amplitude of single responses plotted against the stimulation sequence. When stimuli were presented at low rate (0.1 Hz; A), the VEP amplitude in the presence of sevoflurane 2.5% was smaller than the VEP amplitude in the presence of sevoflurane 5% and no significant correlation between the VEP amplitude and the stimulation sequence could be detected. Conversely, when stimuli were presented at a higher rate (1 Hz; B), VEP amplitude exponentially decreased with both dosages of anaesthetic. Continuous lines represent exponential fitting of these relations (sevoflurane 2.5%: y  = 68.62, τ = 0.66, adjusted R 2 = 0.79, P < 0.001; sevoflurane 5%: y  = 20.04, τ = 0.74, adjusted R 2 = 0.48, P < 0.001; F test). With sevoflurane 5% the amplitude decay stabilized at lower values than with sevoflurane 2.5% as indicated by the respective y values. C, bar graph showing the significant dose‐dependent increase of the mean amplitude of the last 10 responses to the lower rate of stimulation (0.1 Hz; P < 0.05; one‐way rANOVA) during the exposure to increasing concentrations of sevoflurane (2.5, 3.75 and 5%). D, bar graph showing the significant dose‐dependent decrease of the mean amplitude of the last 10 responses to the higher rate of stimulation (1 Hz; P < 0.05; one‐way rANOVA) during the exposure to increasing concentrations of sevoflurane. E, ensemble averages of the last 24 VEPs from a representative animal exposed to light pulses at two different rates (0.1 Hz, left; 1 Hz, right) in the presence of increasing dosages of sevoflurane (2.5, 3.75 and 5%). F, superimposition of light‐pulse rate response curves obtained from rats exposed to all dosages of sevoflurane (2.5, 3.75 and 5%) and to all stimulation frequencies (light‐pulse rate range 0.1–1 Hz; pulse duration 20 ms; pulse irradiance 150 μW cm−2). Continuous lines represent the power‐function fitting of these curves in log–log plots (sevoflurane 2.5%: adjusted R 2 = 0.94, P < 0.01; sevoflurane 3.75%: adjusted R 2 = 0.77, P < 0.05; sevoflurane 5%: adjusted R 2 = 0.99, P < 0.001; F test). Notice how the VEP amplitude is significantly decreased as a power function of the light‐pulse rate (principal effect of the frequency of stimulation P < 0.01; two‐way rANOVA) and how the potentiating effect of sevoflurane observed at lower light‐pulse rates is gradually converted into a depression when the frequency of stimulation is increased. G, estimates of the power exponents obtained by fitting the light‐pulse rate response curves from individual experiments (n = 4 rats). A significant decrease in the power exponent is seen by increasing the concentration of sevoflurane. Asterisks are significance values (C, D and G, principal effect by one‐way rANOVA; F, principal effect by two‐way rANOVA; P > 0.05, ns; * P < 0.05; ** P < 0.01; *** P < 0.001).

References

    1. Abenavoli A, Forti L, Bossi M, Bergamaschi A, Villa A & Malgaroli A (2002). Multimodal quantal release at individual hippocampal synapses: evidence for no lateral inhibition. J Neurosci 22, 6336–6346. - PMC - PubMed
    1. Asahi T, Hirota K, Sasaki R, Mitsuaki Y & Roth SH (2006). Intravenous anesthetics are more effective than volatile anesthetics on inhibitory pathways in rat hippocampal CA1. Anesth Analg 102, 772–778. - PubMed
    1. Atallah BV, Bruns W, Carandini M & Scanziani M (2012). Parvalbumin‐expressing interneurons linearly transform cortical responses to visual stimuli. Neuron 73, 159–170. - PMC - PubMed
    1. Ayaz A & Chance FS (2009). Gain modulation of neuronal responses by subtractive and divisive mechanisms of inhibition. J Neurophysiol 101, 958–968. - PubMed
    1. Baumgart JP, Zhou Z, Hara M, Cook DC, Hoppa MB, Ryan TA & Hemmings HC (2015). Isoflurane inhibits synaptic vesicle exocytosis through reduced Ca2+ influx , not Ca2+‐exocytosis coupling. Proc Natl Acad Sci USA 112, 11959–11964. - PMC - PubMed