. 2016 Jul 15:7:12203.
doi: 10.1038/ncomms12203.

Septin 9 induces lipid droplets growth by a phosphatidylinositol-5-phosphate and microtubule-dependent mechanism hijacked by HCV

Affiliations

Septin 9 induces lipid droplets growth by a phosphatidylinositol-5-phosphate and microtubule-dependent mechanism hijacked by HCV

Abdellah Akil et al. Nat Commun. .

Abstract

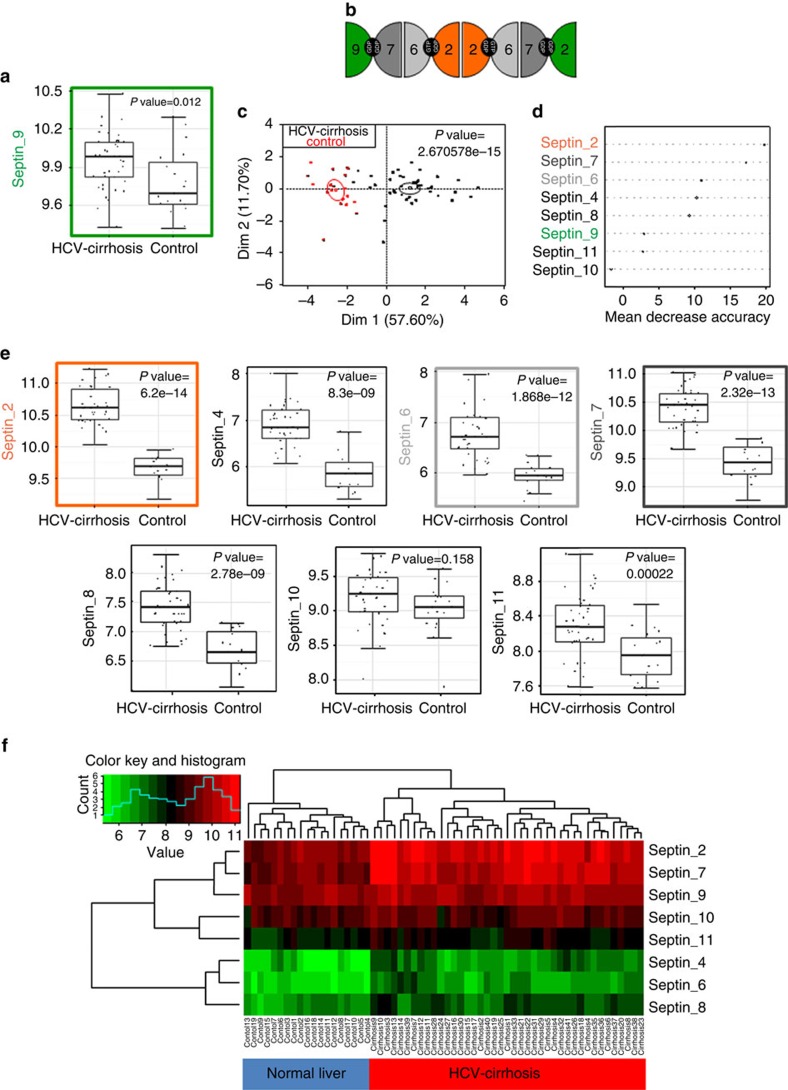
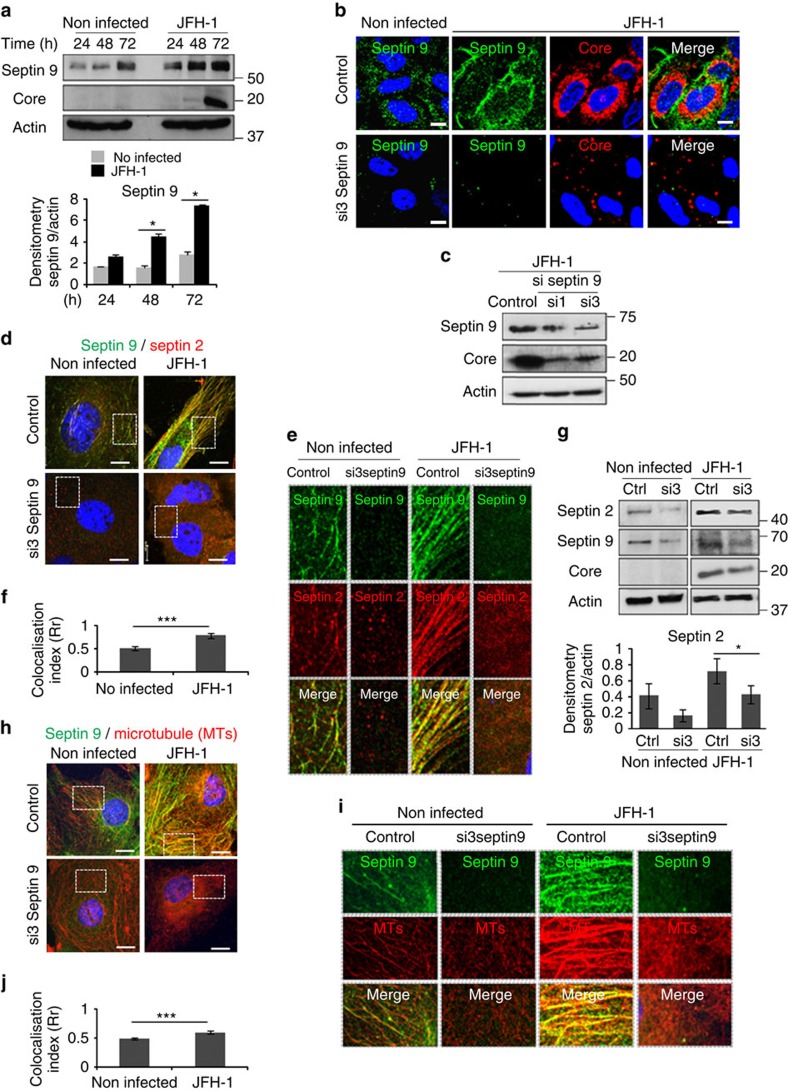
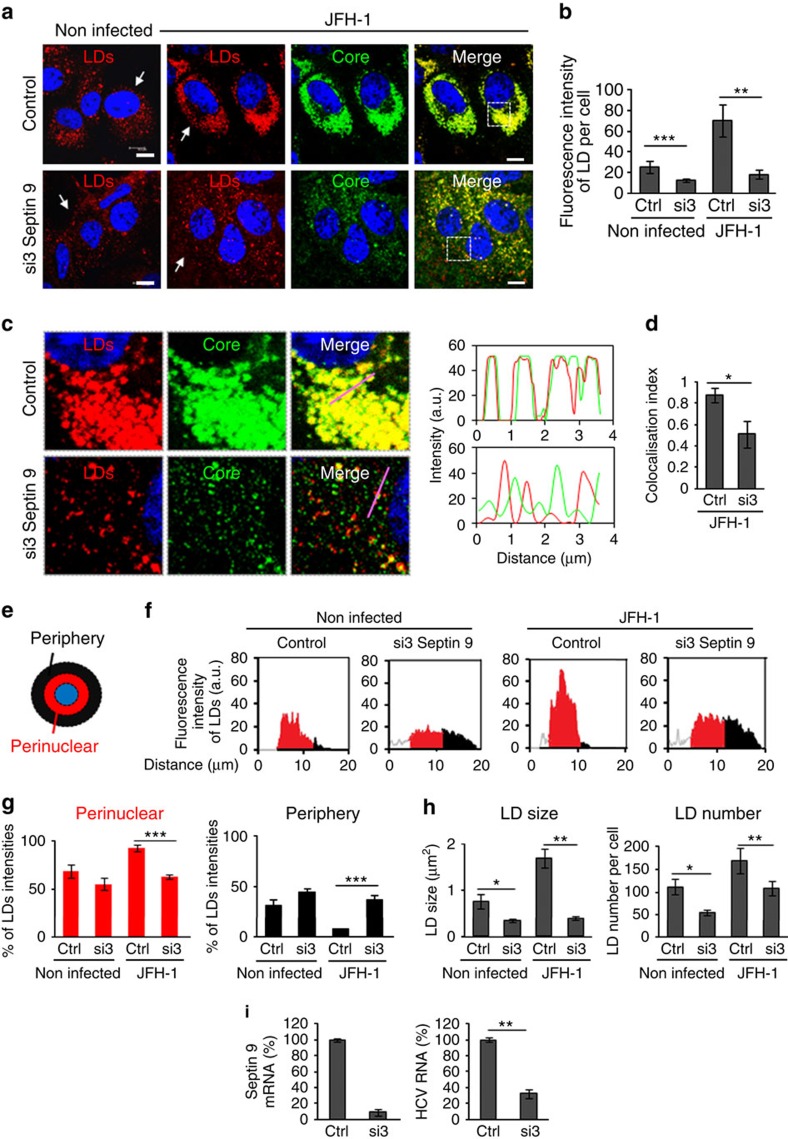
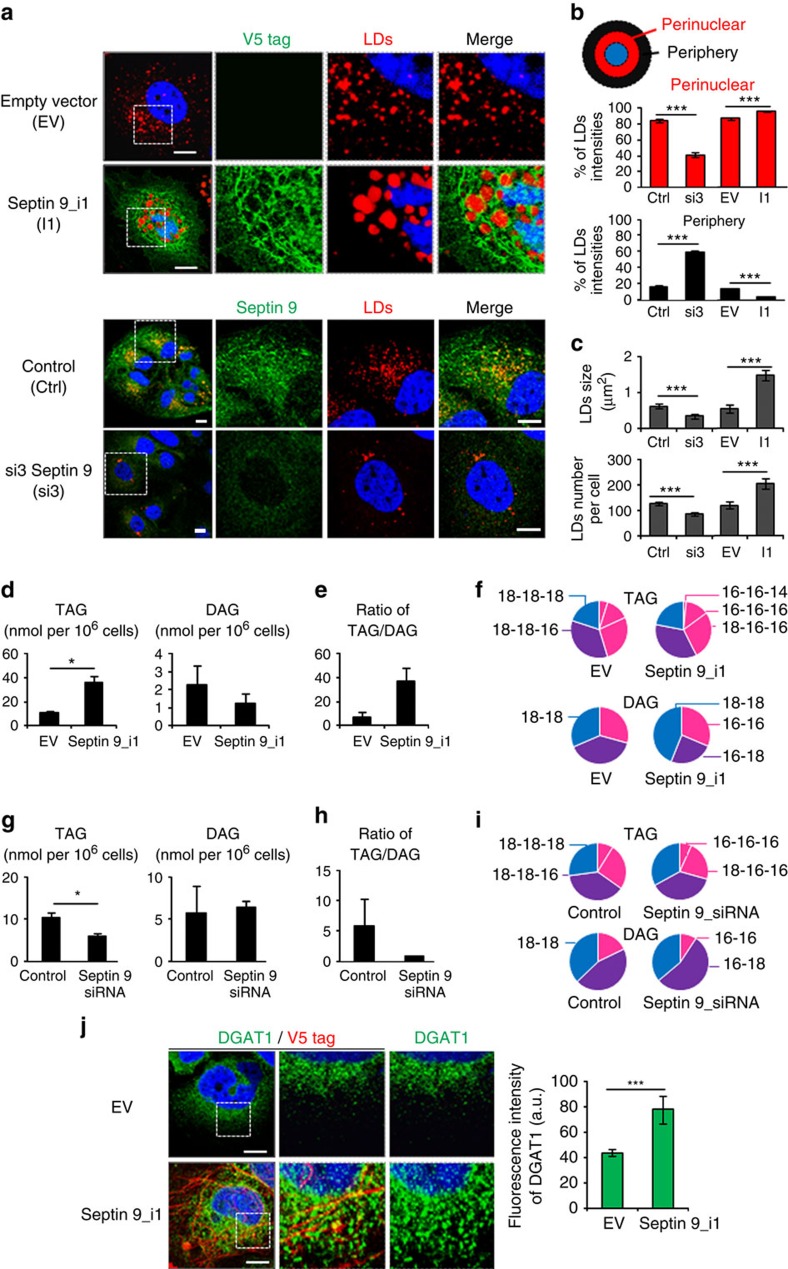
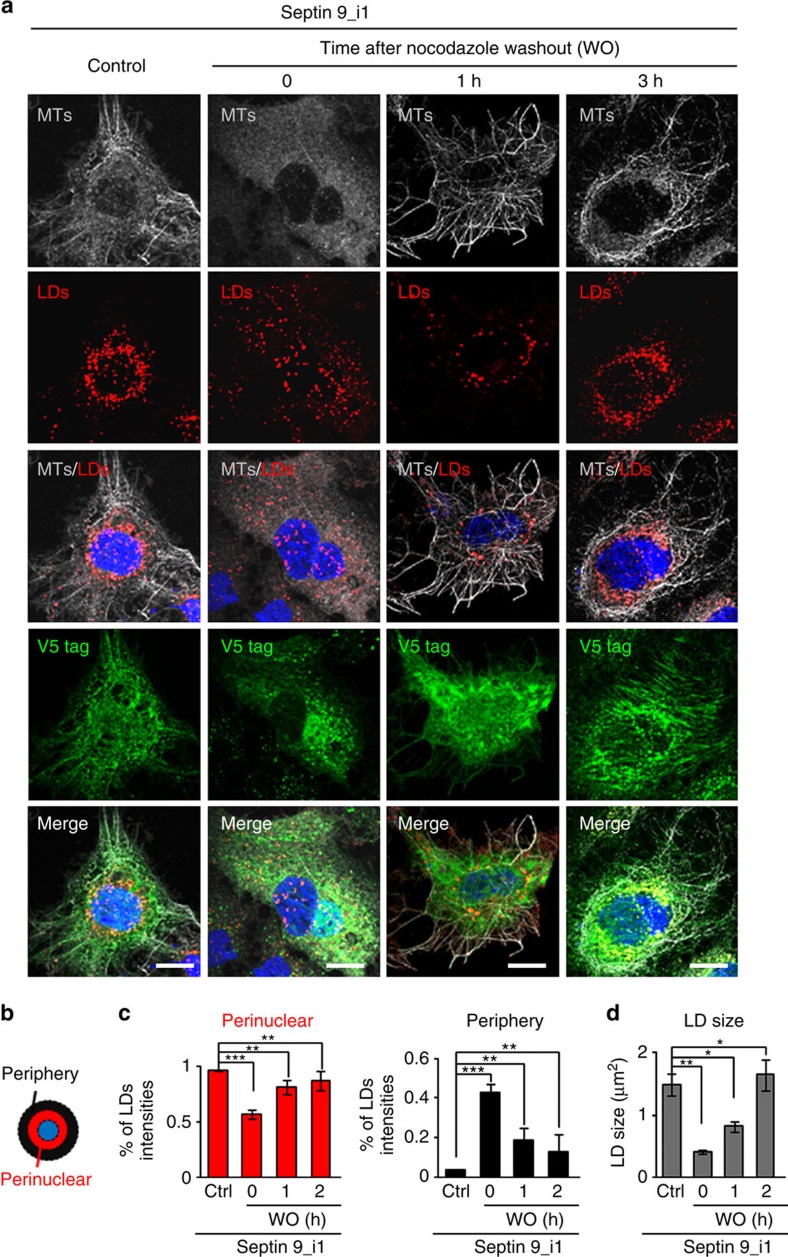
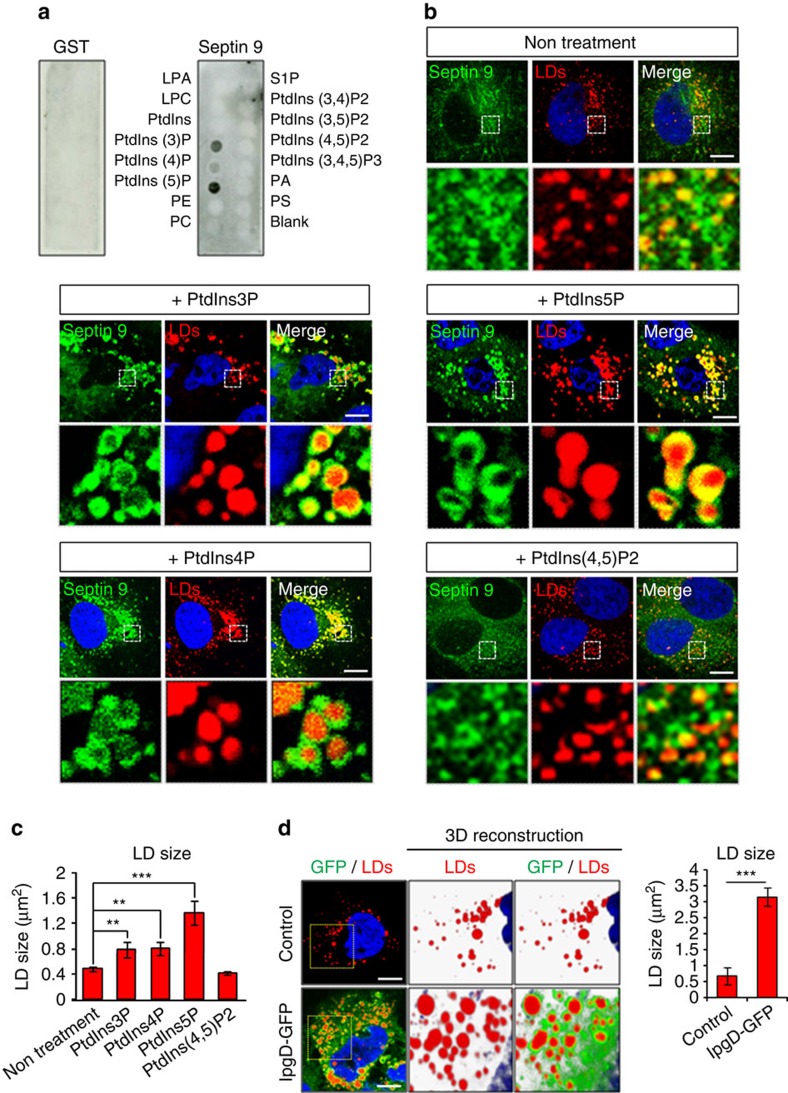
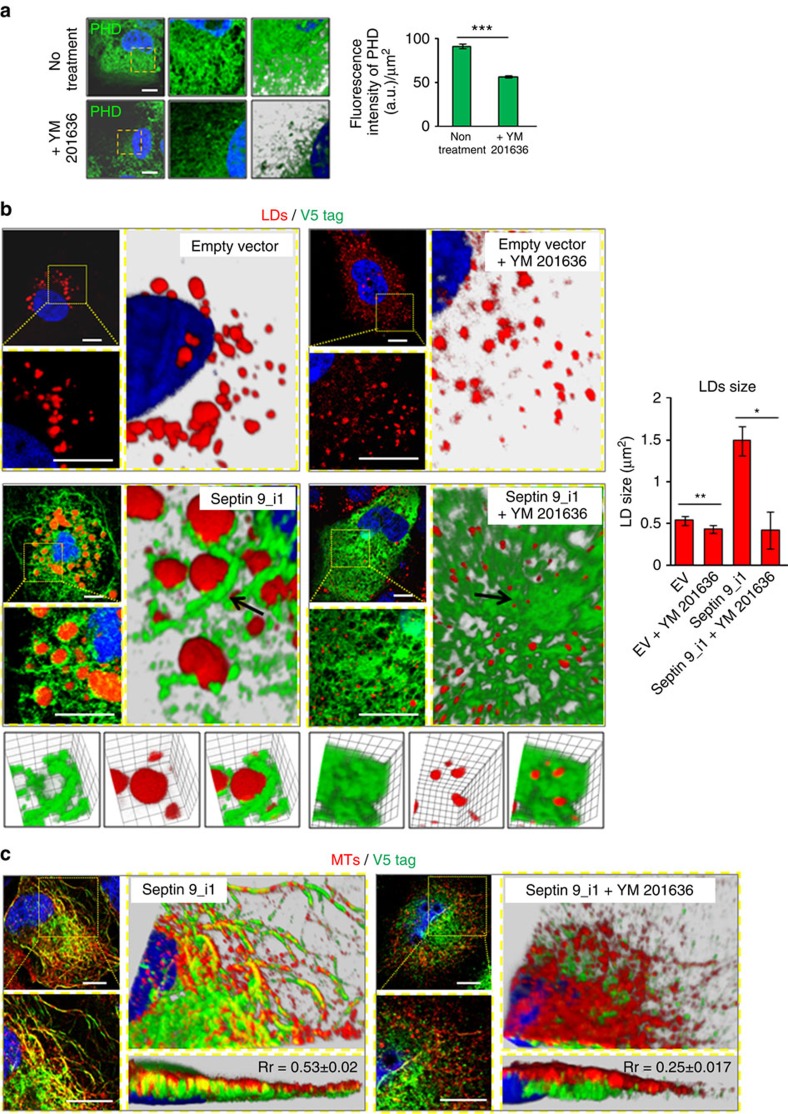
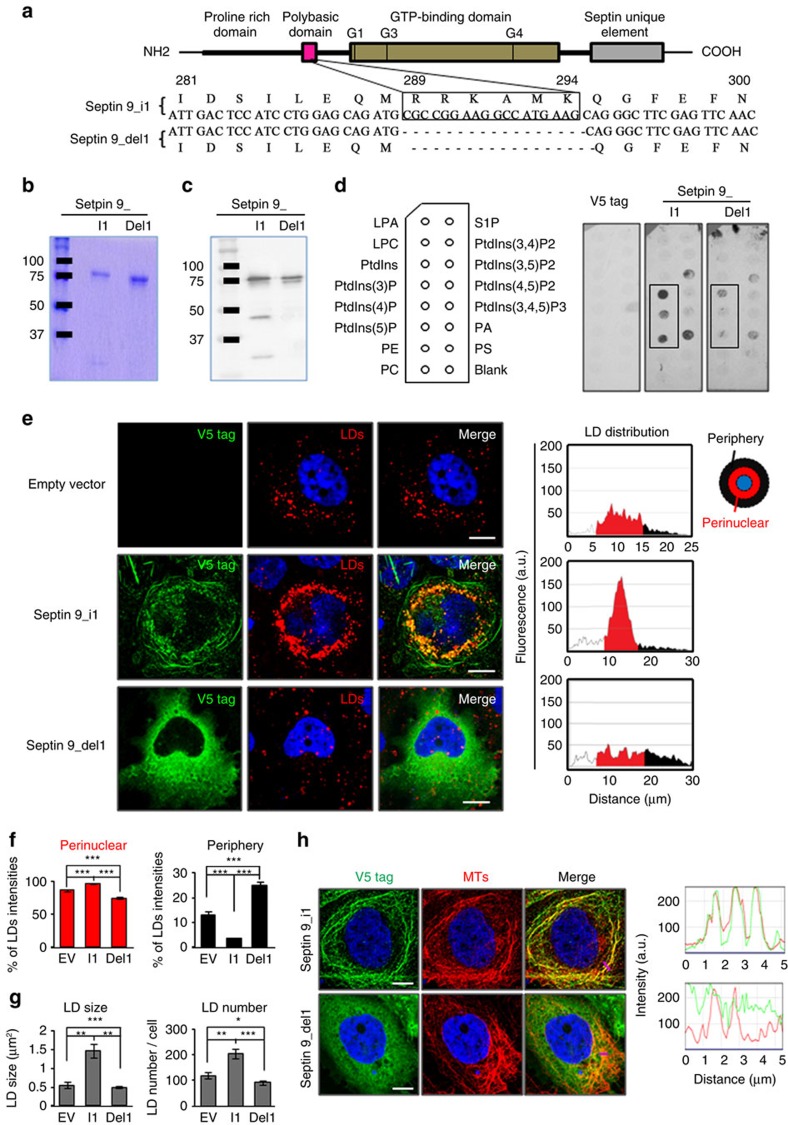
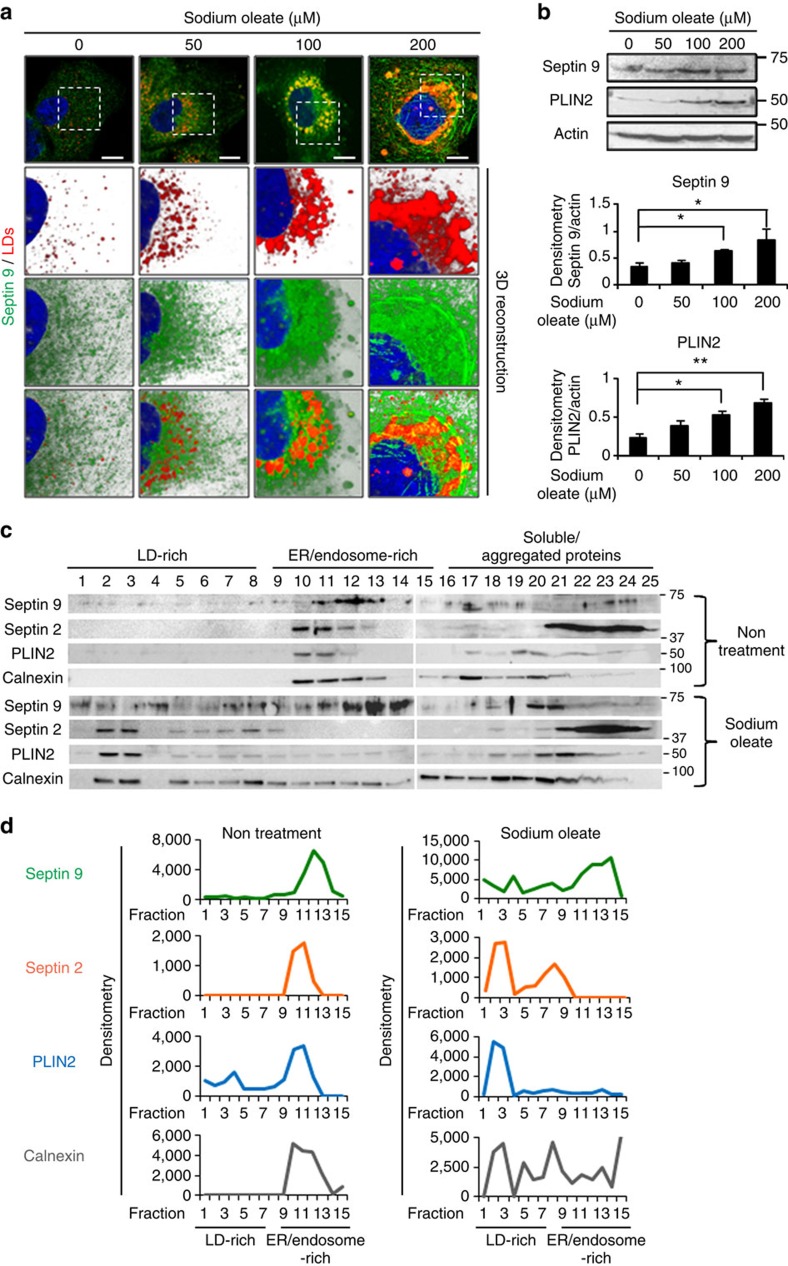
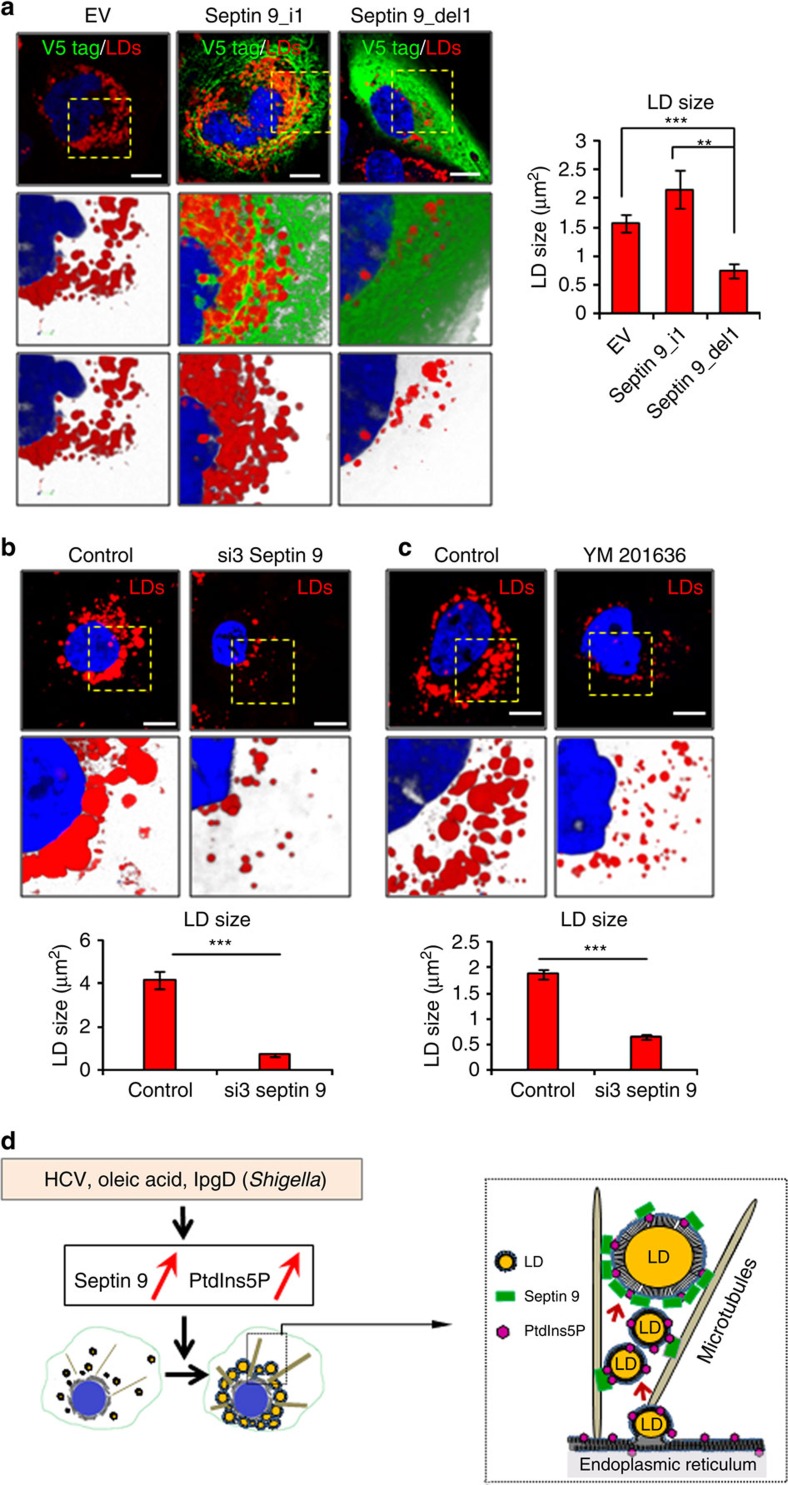
The accumulation of lipid droplets (LD) is frequently observed in hepatitis C virus (HCV) infection and represents an important risk factor for the development of liver steatosis and cirrhosis. The mechanisms of LD biogenesis and growth remain open questions. Here, transcriptome analysis reveals a significant upregulation of septin 9 in HCV-induced cirrhosis compared with the normal liver. HCV infection increases septin 9 expression and induces its assembly into filaments. Septin 9 regulates LD growth and perinuclear accumulation in a manner dependent on dynamic microtubules. The effects of septin 9 on LDs are also dependent on binding to PtdIns5P, which, in turn, controls the formation of septin 9 filaments and its interaction with microtubules. This previously undescribed cooperation between PtdIns5P and septin 9 regulates oleate-induced accumulation of LDs. Overall, our data offer a novel route for LD growth through the involvement of a septin 9/PtdIns5P signalling pathway.


Figures

Figure 1
Figure 1. Transcriptomic analysis of septin 9 in human cirrhosis.
(a) R software was used to generate boxplot presents septin 9 expression in cirrhosis and in normal liver samples of GSE14323 data set and to calculate mentioned P value of two-sided Student's t-test. (b) The octameric complex of septins contains septin 2 group and septin 6 group members, septin 7 and septin 9 which caps the two extremities of the rod shaped complex. (c) R software with FactoMineR package was used to obtain unsupervised principal component analysis performed on GSE14323 with septin molecules: P value obtained on first principal axis allowed discriminating normal liver from cirrhosis in GSE14323. (d) Mean decrease accuracy of predict variables during the ‘Septin' Random Forest learning machine. (e) R software was used to generate boxplot of septins allows to discriminate cirrhosis from normal liver with GSE14323 and to calculate mentioned P value of two-sided Student's t-test. (f) R software was used to perform heatmap by unsupervised classification with septin molecules in GSE14323 (classification tree with Euclidean distance and complete linkage).
Figure 2
Figure 2. Septin 9 increases in JFH-1-infected cells and regulates septin 2 and microtubules filaments.
(a) Immunoblot of septin 9 and core in Huh7.5 cells infected or not with JFH-1 for 24, 48 and 72 h. Actin was used as a loading control. The bar graph presents the densitometry analysis of the immunoblots from three independent experiments. (b) Huh7.5 cells transfected with non-targeting (control) or septin 9 siRNA (si3) for 24 h then infected or not with HCV JFH-1 for 72 h then stained for septin 9 (green) and core (red). (c) Immunoblot of septin 9 and core in Huh7.5 cells transfected with non-targeting (control) or septin 9 siRNA (si1 or si3) then infected with HCV JFH-1 for 72 h. (d) Huh7.5 treated as in b and stained for septin 9 (green) and septin 2 (red). (e) Dot rectangles in d are presented in higher magnification. (f) Bar graph shows Pearson's correlation coefficient (Rr) of septin 9 and septin 2 calculated in 30 cells from 2 independent experiments. (g) Immunoblot of septin 2, septin 9 and core in Huh7.5 cells treated as described in b. Actin was used as a loading control. Bar graph presents septin 2 expression from three independent experiments. (h) Huh7.5 cells were treated as described in b and stained for microtubules (MTs) with β tubulin (red) and septin 9 (green). (i) Dot squares in h present in higher magnification. (j) Bar graph shows Pearson's correlation coefficient (Rr) analysis of septin 9 and MTs calculated in 30 cells from two independent experiments. Values are means±s.e.m. Student's t-test was used. *P<0.05, ***P<0.0001. Scale bar, 10 μm.
Figure 3
Figure 3. Septin 9 regulates core and LDs accumulation in JFH-1 infected cells and virus replication.
(a) Huh7.5 cells were transfected with non-targeting (control or Ctrl) or septin 9 siRNA (si3) for 24 h then infected with JFH-1 for further 72 h and stained for core (green) and LDs (red). (b) LDs fluorescence intensity in 30 cells from two experiments performed as described in a. (c) Dot squares in a are presented in higher magnification. The right panels present green, red, line profile blots of the pink lines. (d) Bar graphs show Pearson's correlation coefficient (Rr) for co-localization between core and LDs of 30 cells from two experiments. (e) Representation of the peripheral (black) and perinuclear (red) regions of the cell. (f) Radial profile plots showing LD distribution between the peripheral (black) and the perinuclear regions (red) of cells indicated with the white arrows in a. (g) Quantification of LDs in perinuclear and peripheral regions in 30 cells from two independent experiments performed as described in a. (h) LD size (left) and LD number (right) in 30 cells from two independent experiments done as described in a. (i) Huh7.5 cells were transfected with non-targeting (control) or septin 9 siRNA (si3) for 24 h and infected with JFH-1 as in a for 72 h. Cells were analysed for septin 9 mRNA and HCV RNA level by qRT–PCR. Bar graphs show results from 3 independent experiments. Values are means±s.e.m. Student's t-test was used. *P<0.05, **P<0.001, ***P<0.0001. Scale bar, 10 μm.
Figure 4
Figure 4. Septin 9 regulates TAG and DAG levels in Huh7R cells.
(a) Huh7R cells transfected with empty vector (EV) or septin 9_i1 for 48 h were stained for LDs (red) and V5 tag (green). Cells transfected with non-targeting (control) or septin 9 siRNA (si3) for 48 h were stained for LDs (red) and septin 9 (green). (b) Schematic representation shows the perinuclear and peripheral regions of the cell. Bar graphs represent LDs intensity in the perinuclear and peripheral region of 36 cells from five independent experiments. (c) LD size and LD number in 36 cells from 5 independent experiments. (df) Huh7R cells were transfected with either EV or septin 9_i1 cDNAs then analysed for triacylglycerol (TAG) and diacylglycerol (DAG). (d) Data represent nmol per 106 cells. (e) Ratio of TAG to DAG. (f) Distribution of fatty acid species in TAG and DAG according to carbon number in the acyl group. Results are obtained from 3 independents experiments. (gi) Huh7R cells transfected with non-targeting or septin 9 siRNA for 72 h were analysed for TAG and DAG as in df. (j) Huh7R cells transfected with EV or septin 9_i1 were stained for V5 tag (red) and diacylglycerol acyltransferase-1 (DGAT1) (green). White squares indicate the area shown in higher magnification. Bar graph represents DGAT1 fluorescence intensity in 50 cells from two independent experiments. Values are means±s.e.m. Student's t-test was used. *P<0.05, ***P<0.0001. Scale bar, 10 μm.
Figure 5
Figure 5. Septin 9 regulates LDs in microtubules-dependent manner.
(a) Huh7R cells transfected with septin 9_i1 were treated with nocodazole (33 μM) for 2 h at 37 °C and placed on ice for 1 h. Then cells were washed five times with ice-cold culture medium to remove the nocodazole and moved at 37 °C for indicated time in the figure before staining for V5 tag (green), LDs (red) and microtubules (grey) with β tubulin. (b) Schematic representation shows the perinuclear and peripheral regions. (c) Percentage of LDs intensity in the perinuclear and peripheral regions of 20 cells from two independent experiments. (d) LD size analysed in 20 cells from two independent experiments. Values are means±s.e.m. Student's t-test was used. *P<0.05, **P<0.001, ***P<0.0001. Scale bar, 10 μm.
Figure 6
Figure 6. Mono-phosphate phosphoinositides regulate LDs size.
(a) PIP strip overlay assay: PIP strips were incubated either with glutathion-S-transferase (GST) used as a negative control or with purified septin 9_i3 GST tagged at 0.5 μg ml−1 and analysed with anti GST antibody. LPA, lysophosphatidic acid, LPC, lysophosphocholine, PtdIns, phosphatidylinositol, PtdIns(3)P, PtdIns(4)P, PtdIns(5)P, PtdIns(3,4)P2, PtdIns(3,5)P2, PtdIns(4,5)P2, PtdIns(3,4,5)P3, PA, phosphatidic acid, PS, phosphatidylserine, PE, phosphatidylethanolamine, PC, phosphatidylcholine, S1P, sphingosine 1-phosphate. (b) Huh7R cells were treated with cell-permeant PtdIns3P, PtdIns4P, PtdIns5P or PtdIns (4, 5) P2 at 30 μM for 15 min before fixing and staining for septin 9 (green) and LDs (red). The dot squares indicate the zoom area. (c) Bar graph shows the LD siz in Huh7R cells treated as described in b. The results were obtained from at least 20 cells for each treatment from three independent experiments. (d) Huh7R cells were transfected with IpgD-GFP construct or not (control) for 48 h and stained for LDs (red). Bar graph represents LDs size measured in 15 cells from two independent experiments. Values are means±s.e.m. Student's t-test was used. **P<0.001, ***P<0.0001. Scale bar, 10 μm.
Figure 7
Figure 7. Huh7R treatment with YM201636 causes decrease of LDs size and disrupts septin 9 and microtubules filaments.
(a) Huh7R cells treated or not with YM201636 were stained for PtdIns5P (PHD) (green). Dot yellow squares indicate the zoomed area shown in 2D image with a black background and in 3D reconstruction images with white background. Bar graph shows PtdIns5P fluorescence intensity analysis of at least in 60 cells from three independent experiments. (b) Huh7R cells were transfected with either empty vector (EV) or septin 9_i1 then treated with YM201636 and stained for V5 tag (green) and LDs (red). The dot squares indicate the zoomed area shown in a 2D image with a black background, and to the right is a 3D reconstruction image with a grey background. Arrows indicated the area present below at a higher magnification. Bar graph shows LD size in 30 cells from three experiments. (c) Huh7R cells transfected with septin 9_i1 and treated with YM201636 were stained for V5 tag (green) and microtubules (red) with β tubulin. The dot squares indicate the zoomed areas shown as a 2D images with a black background, and to the right is a 3D reconstruction image with a grey background and longitudinal section (right down). Pearson's Correlation coefficient (Rr) for septin and microtubules was calculated from 20 cells from three independent experiments. Values are means±s.e.m. Student's t-test was used. *P<0.05, **P<0.001, ***P<0.0001. Scale bar, 10 μm.
Figure 8
Figure 8. Deletion of septin 9/PIs interaction domain disturbs localization of septin 9 with microtubules and affects LDs accumulation.
(a) Septin 9 domain organization: the polybasic domain is located at N-terminal of GTP-binding domain, which is recognized by three motifs G1 (GXXXXGK=G305QSGLGK311), G3 (DXXG=D362TPG365), G4 (XKXD=A444KAD447). Down: septin 9_i1 and septin 9_del1 sequence in the polybasic domain region. The boxed sequence (289RRKAMK294) has been deleted in septin 9_del1. (b) Coomassie blue stained SDS–PAGE gel of purified septin 9_i1 and septin 9_del1. (c) Immunoblot analysis of purified septin 9_i1 and septin 9_del1. (d) PIP strip overlay assay for V5 tag, purified septin 9_i1 and septin 9_del1 performed as in Fig. 6a. Lipid-bound V5 fusion proteins were detected with anti-V5 antibody. (e) Left: Huh7R cells were transfected either with EV or septin 9_i1 or septin 9_del1 and stained for V5 tag (green) and LDs (red). Right: radial profile plots of the presented cells show LDs intensity distribution in the peripheral and perinuclear regions. (f) LDs intensity in the perinuclear and peripheral regions of 36 cells from 5 independent experiments performed as described in e. (g) LD size and LD number in 36 cells from 5 independent experiments done as described in e. (h) Staining of V5 tag (green) and microtubules (MTs) with β tubulin (red) in Huh7R cells transfected with septin 9_i1 or septin 9 del1. The Pearson's correlation coefficient (Rr) measured in 30 cells from two independent experiments is presented on the merge panels. The right panels are green, red, line profile blots of the pink lines. Values are means±s.e.m. Student's t-test was used. *P<0.05, **P<0.001, ***P<0.0001. Scale bar, 10 μm.
Figure 9
Figure 9. Sodium oleate treatment increases septin 9 and LDs in the perinuclear region and in LD-rich fractions.
(a) Huh7 cells were grown for 24 h. The culture medium was supplemented with 0, 50, 100 or 200 μM sodium oleate complex for 24 h then stained for septin 9 (green) and LDs (red). The white squares indicate the zoomed area shown as a 3D reconstruction image with a white background. (b) Immunoblot analysis of septin 9 and PLIN2 in cells treated as in a. Bar graphs below show the analysis from three independent experiments. (c) Huh7 cells were treated or not with sodium oleate at 100 μM were submitted to membrane flotation assay and analysed by western blot for septin 9, septin 2, PLIN2 and Calnexin. (d) Densitometry analysis of protein expression profile from western blot in c is shown. Values are means±s.e.m. Student's t-test was used. *P<0.05, **P<0.001. Scale bar, 10 μm.
Figure 10
Figure 10. Septin 9 and PtdIns(5)P are required for LDs accumulation in Huh7 sodium oleate-treated cells.
(a) Huh7 cells transfected with EV, septin 9_i1, or septin 9_del1 and treated with 100 μM sodium oleate complex were strained for LDs and V5 tag. Dot squares indicates the zoom area shown below in 3D reconstruction images. Bar graph shows LD size analysis of 33 cells from two independent experiments. (b) Huh7 cells transfected with non-targeting (control) or septin 9 siRNA (si3) were treated with 100 μM sodium oleate complex then strained for LDs and V5 tag. Bar graph shows LD size analysis of 30 cells from two independent experiments. (c) Huh7 cells treated with 100 μM sodium oleate then with 160 μm YM201636 for 1 h before staining for LDs (red). Bar graphs present mean LD size of 60 cells from two independent experiments. Values are means±s.e.m. Student's t-test was used. **P<0.001, ***P<0.0001. Scale bar, 10 μm. (d) Proposed model: HCV infection, oleic acid treatment and IpgD, the virulence factor of Shigella flexneri may increase the cellular level of both septin 9 and PtdIns5P promoting their interaction and the subsequent organization of MTs to control LD growth and accumulation.

References

    1. Pol A., Gross S. P. & Parton R. G. Review: biogenesis of the multifunctional lipid droplet: lipids, proteins, and sites. J. Cell Biol. 204, 635–646 (2014). - PMC - PubMed
    1. Welte M. A. Expanding roles for lipid droplets. Curr. Biol. 25, R470–R481 (2015). - PMC - PubMed
    1. Walther T. C. & Farese R. V. Lipid droplets and cellular lipid metabolism. Annu. Rev. Biochem. 81, 687–714 (2012). - PMC - PubMed
    1. Ohsaki Y., Suzuki M. & Fujimoto T. Open questions in lipid droplet biology. Chem. Biol. 21, 86–96 (2014). - PubMed
    1. Bickel P. E., Tansey J. T. & Welte M. A. PAT proteins, an ancient family of lipid droplet proteins that regulate cellular lipid stores. Biochim. Biophys. Acta 1791, 419–440 (2009). - PMC - PubMed

Publication types

MeSH terms