. 2016 Dec;28(12):1849-1864.
doi: 10.1162/jocn_a_01011. Epub 2016 Jul 15.

Differential Contributions of Ventral and Dorsal Striatum to Early and Late Phases of Cognitive Set Reconfiguration

Affiliations

Differential Contributions of Ventral and Dorsal Striatum to Early and Late Phases of Cognitive Set Reconfiguration

Brianna J Sleezer et al. J Cogn Neurosci. 2016 Dec.

Abstract

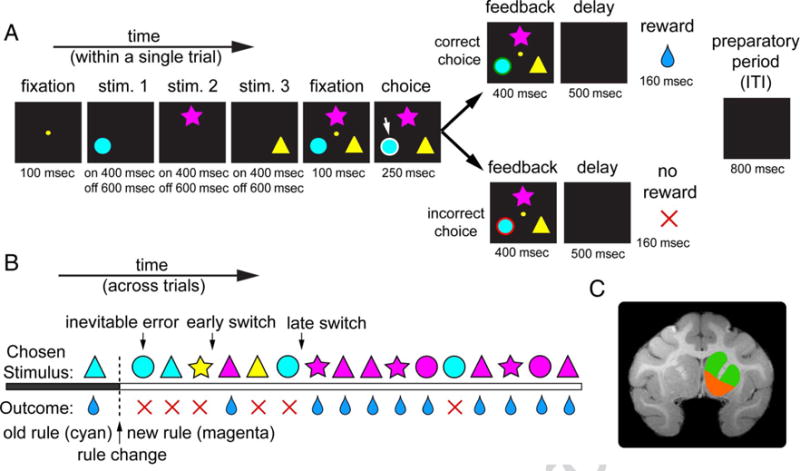
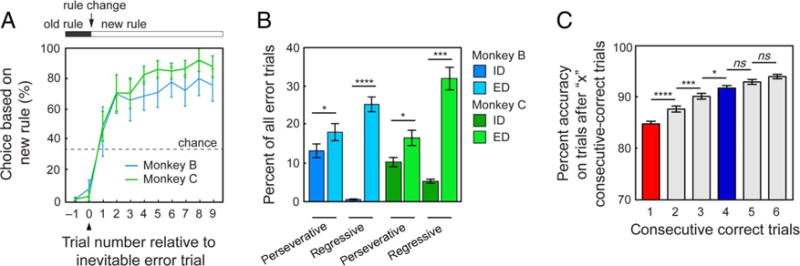
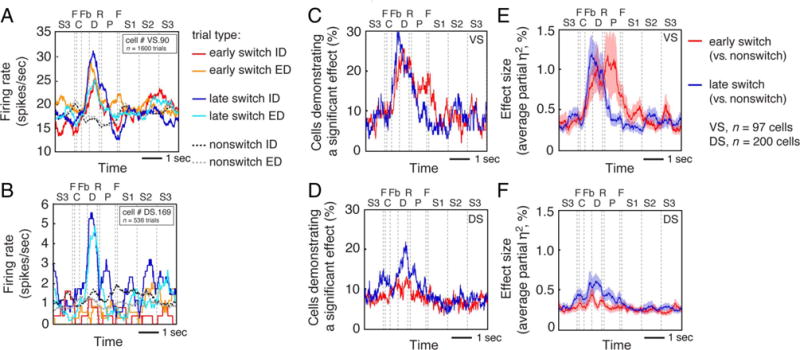
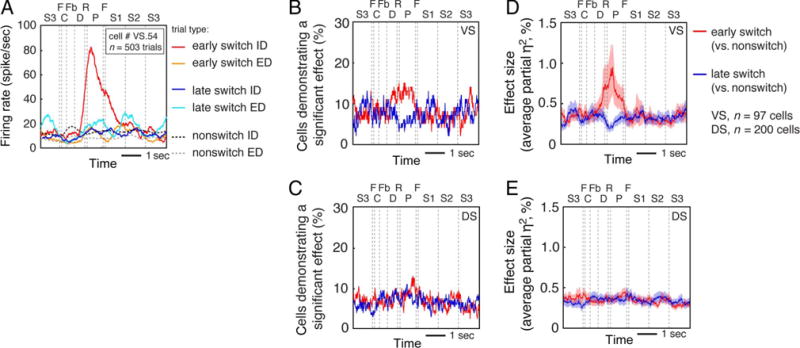
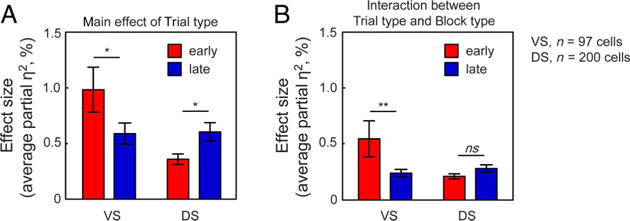
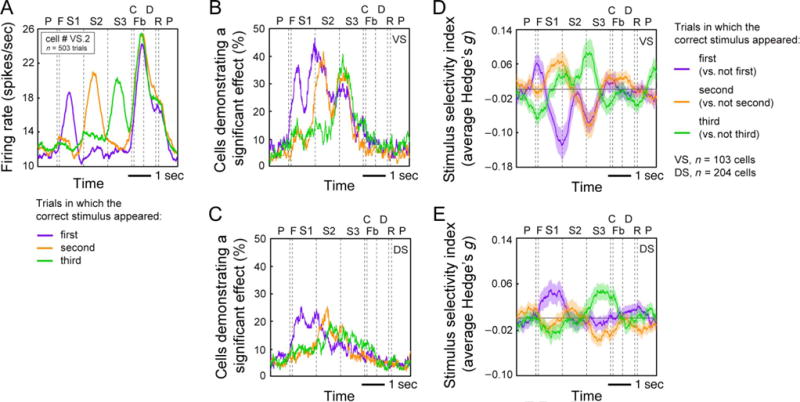
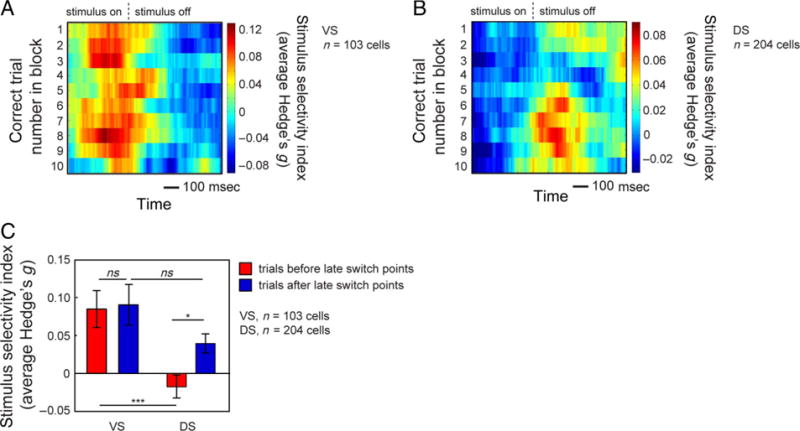
Flexible decision-making, a defining feature of human cognition, is typically thought of as a canonical pFC function. Recent work suggests that the striatum may participate as well; however, its role in this process is not well understood. We recorded activity of neurons in both the ventral (VS) and dorsal (DS) striatum while rhesus macaques performed a version of the Wisconsin Card Sorting Test, a classic test of flexibility. Our version of the task involved a trial-and-error phase before monkeys could identify the correct rule on each block. We observed changes in firing rate in both regions when monkeys switched rules. Specifically, VS neurons demonstrated switch-related activity early in the trial-and-error period when the rule needed to be updated, and a portion of these neurons signaled information about the switch context (i.e., whether the switch was intradimensional or extradimensional). Neurons in both VS and DS demonstrated switch-related activity at the end of the trial-and-error period, immediately before the rule was fully established and maintained, but these signals did not carry any information about switch context. We also observed associative learning signals (i.e., specific responses to options associated with rewards in the presentation period before choice) that followed the same pattern as switch signals (early in VS, later in DS). Taken together, these results endorse the idea that the striatum participates directly in cognitive set reconfiguration and suggest that single neurons in the striatum may contribute to a functional handoff from the VS to the DS during reconfiguration processes.


Figures

Figure 1
Figure 1
Task and recording locations. (A) Timeline of WCST. Three colored shape stimuli were presented in sequence and then simultaneously; monkeys reacquired central fixation and then chose one stimulus with a saccade. Correct choices yielded a green outline followed by a reward. Incorrect choices yielded a red outline followed by no reward. Between each trial, there was an 800-msec ITI, which we call the preparatory period. (B) Example block. In this example, the correct rule is magenta. Early switch trials are defined as the postfeedback period after an error and immediately before the first correct trial of the block. Late switch trials are defined as the postfeedback period after an error and immediately before the first correct trial in a series of at least four consecutively correct trials. Nonswitch trials are defined as all trials other than early or late switch trials. (C) MRI of Monkey C. Recordings were made in VS (highlighted in orange) and DS (highlighted in green). Details of recording site are given in the Methods section. Stim. = stimulus.
Figure 2
Figure 2
Behavioral results. (A) Average proportion of choices based on the new rule relative to the inevitable error trial. Error bars indicate SEMs. (B) Average proportion of perseverative and regressive errors on each block. Error bars indicate SEMs. *p < .05; ***p < .001; ****p < .001, Fisher’s LSD test. (C) Average percent accuracy on the trial immediately after the first occurrence of one, two, three, four, five, or six consecutive correct trials after a rule change. Error bars indicate SEMs. *p < .05; ***p < .001; ****p < .001, Fisher’s LSD test.
Figure 3
Figure 3
(A) Average response of a single VS neuron demonstrating general switch-related activity (i.e., a main effect of Trial type [switch or nonswitch]) at early and late switch points. Red and orange lines indicate ID and ED switch trials at early switch points, blue and light blue lines indicate ID and ED switch trials at late switch points, and dark and light gray dotted lines indicate ID and ED nonswitch trials. C = choice; Fb = feedback; D = delay; R = reward; P = preparatory period (ITI); F = fixation; S1 = first stimulus appearance; S2 = second stimulus appearance; S3 = third stimulus appearance. (B) Average response of a single DS neuron demonstrating general switch-related activity at late switch points. Same conventions as in A. (C) Proportion of VS cells demonstrating general switch-related activity at early (red line) and late (blue line) switch points. (D) Proportion of DS cells demonstrating general switch-related activity at early (red line) and late (blue line) switch points. (E) Proportion of variance explained (partial η2) by the main effect of Trial type across the population of VS cells at early (red line) and late (blue line) switch points. (F) Proportion of variance explained (partial η2) by the main effect of Trial type across the population of DS cells at early (red line) and late (blue line) switch points. Effect size measures reflect averages across all cells (excluding six from VS and four from DS that were excluded because of an insufficient number of trials).
Figure 4
Figure 4
(A) Average response of a single VS neuron demonstrating context-specific switch-related activity (an interaction between Trial type [switch or nonswitch] and Block type [ID or ED]) at early switch points. Lines for ID and ED switches include the average of both types of ID switches (color to color and shape to shape) and both types of ED switches (color to shape and shape to color). Same conventions as in Figure 3A and B. (B) Proportion of VS cells demonstrating context-specific switch-related activity at early (red line) and late (blue line) switch points. (C) Proportion of DS cells demonstrating context-specific switch-related activity at early (red line) and late (blue line) switch points. (D) Proportion of variance explained (partial η2) by the interaction between Trial type and Block type across the population of VS cells at early (red line) and late (blue line) switch points. (E) Proportion of variance explained (partial η2) by the interaction between Trial type and Block type across the population of DS cells at early (red line) and late (blue line) switch points. Effect size measures reflect averages across all cells (excluding six from VS and four from DS that were excluded because of an insufficient number of trials).
Figure 5
Figure 5
(A) Proportion of variance explained (partial η2) by the main effect of Trial type at early (red bars) and late (blue bars) switch points in the VS and DS. Bar graph shows the mean partial η2SEM) during the postfeedback period. *p < .05. (B) Proportion of variance explained (partial η2) by the interaction between Trial type and Block type at early (red bars) and late (blue bars) switch points in the VS and DS. Bar graph shows the mean partial η2SEM) during the postfeedback period. **p < .01.
Figure 6
Figure 6
(A) Average response of a single VS neuron demonstrating selectivity for the presentation of the correct stimulus during the first (purple line), second (orange line), and third (green line) presentation epochs. (B) Proportion of VS cells demonstrating selectivity for the presentation of the correct stimulus. Same conventions as in A. (C) Proportion of DS cells demonstrating selectivity for the presentation of the correct stimulus. Same conventions as in A. (D) Proportion of variance explained (Hedge’s g) by the presentation of the correct stimulus during the first, second, and third presentation epochs across the population of VS cells. Same conventions as in A. (E) Proportion of variance explained (Hedge’s g) by the presentation of the correct stimulus during the first, second, and third presentation epochs across the population of DS cells. Same conventions as in A.
Figure 7
Figure 7
(A) Average proportion of variance explained (Hedge’s g) by the presentation of the correct stimulus (compared with epochs in which the correct stimulus was not presented) for the population of VS neurons. Heat plots were constructed by calculating Hedge’s g for each neuron using a 200-msec window, slid in 10-msec steps, and also across a two-trial window, slid in one-trial steps over the first 10 correct trials in each block, collapsed across blocks. We then averaged across neurons to obtain the average selectivity for the population. (B) Average proportion of variance explained (Hedge’s g) by the presentation of the correct stimulus (compared with epochs in which the correct stimulus was not presented) for the population of DS neurons. Heat plots were constructed the same as in A. (C) Average proportion of variance explained (Hedge’s g) by the presentation of the correct stimulus before late switch points (red) and after late switch points (blue) for the populations of VS and DS neurons. The analysis epoch for each region consists of a 200-msec period surrounding the average time of maximum selectivity. Bar graph shows the mean Hedge’s gSEM) during these epochs. *p < .05, ***p < .001.

Similar articles

Cited by

References

    1. Apicella P, Ljungberg T, Scarnati E, Schultz W. Responses to reward in monkey dorsal and ventral striatum. Experimental Brain Research. 1991;85:491–500. - PubMed
    1. Balleine BW, Delgado MR, Hikosaka O. The role of the dorsal striatum in reward and decision-making. Journal of Neuroscience. 2007;27:8161–8165. - PMC - PubMed
    1. Beveridge TJ, Gill KE, Hanlon CA, Porrino LJ. Parallel studies of cocaine-related neural and cognitive impairment in humans and monkeys. Philosophical Transactions of the Royal Society of London, Series B: Biological Sciences. 2008;363:3257–3266. - PMC - PubMed
    1. Blanchard TC, Hayden BY. Neurons in dorsal anterior cingulate cortex signal postdecisional variables in a foraging task. Journal of Neuroscience. 2014;34:646–655. - PMC - PubMed
    1. Blanchard TC, Hayden BY, Bromberg-Martin ES. Orbitofrontal cortex uses distinct codes for different choice attributes in decisions motivated by curiosity. Neuron. 2015;85:602–614. - PMC - PubMed