. 2016 Jul 15:7:11976.
doi: 10.1038/ncomms11976.

Determining solar effects in Neptune's atmosphere

Affiliations

Determining solar effects in Neptune's atmosphere

K L Aplin et al. Nat Commun. .

Abstract

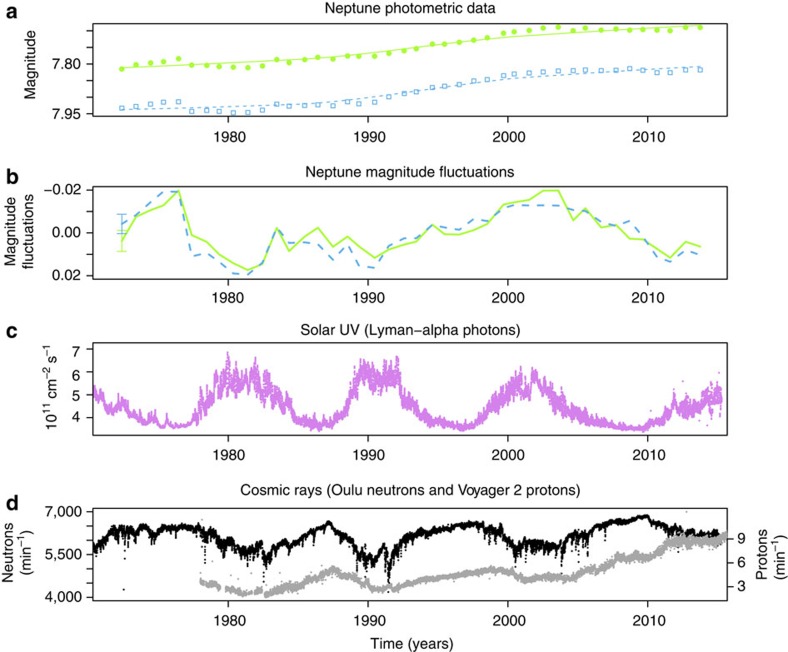
Long-duration observations of Neptune's brightness at two visible wavelengths provide a disk-averaged estimate of its atmospheric aerosol. Brightness variations were previously associated with the 11-year solar cycle, through solar-modulated mechanisms linked with either ultraviolet or galactic cosmic ray (GCR) effects on atmospheric particles. Here, we use a recently extended brightness data set (1972-2014), with physically realistic modelling to show, rather than alternatives, ultraviolet and GCR are likely to be modulating Neptune's atmosphere in combination. The importance of GCR is further supported by the response of Neptune's atmosphere to an intermittent 1.5- to 1.9-year periodicity, which occurred preferentially in GCR (not ultraviolet) during the mid-1980s. This periodicity was detected both at Earth, and in GCR measured by Voyager 2, then near Neptune. A similar coincident variability in Neptune's brightness suggests nucleation onto GCR ions. Both GCR and ultraviolet mechanisms may occur more rapidly than the subsequent atmospheric particle transport.


Figures

Figure 1
Figure 1. Time series of Neptune's brightness and solar modulated parameters.
(a) Neptune brightness (astronomical magnitude, where smaller values represent a greater signal) time series at 472 nm (blue squares) and 551 nm (green circles), from ref. , each smoothed with a lowess fit (blue dashed line or green solid line). (b) Magnitude fluctuations after detrending (a) with a lowess fit. The maximum s.e.m. in each data set is shown as a single error bar on the far left. (c) Lyman-alpha (ultraviolet) radiation at 121.5 nm. (d) Cosmic ray count rate at Earth's surface and in the heliosphere, showing terrestrial neutron monitor data from Oulu, Finland, (black) and Voyager 2 LECP instrument daily mean flux of cosmic ray protons >70 MeV (grey). Data are described in full in the ‘Methods' section.
Figure 2
Figure 2. Physically based linear regression models to explain Neptune magnitude fluctuations.
The models include ultraviolet radiation, attachment and recombination of GCR-created ions—Case 7 in Table 1—for (a) fy at 551 nm and (b) fb at 472 nm. The coefficients determined in equation (1) for, respectively, (a) κ=0.010±0.004 cm2s, λ=(2±1) × 10−4 min, μ=−0.04±0.02 min0.5, x=1.5±0.8 mag (where mag is astronomical magnitude), and (b) κ=0.011±0.005 cm2s, λ=(2±1.5) × 10−4 min, μ=−0.03±0.02 min0.5 and x=1.1±0.9 mag.
Figure 3
Figure 3. Spectral power densities between 1.5 and 1.9 years.
Moving-window spectrograms derive the SPD, normalized by the variance to be dimensionless, for periodicities between 1.5 and 1.9 years from (a) the Voyager 2 LECP instrument proton data, (b) Neptune's magnitude fluctuations at 551 nm, (c) 472 nm, (d) Oulu neutron monitor data and (e) solar ultraviolet (Lyman-alpha) radiation. Contours of SPD are shown, with colour for added emphasis. The data and spectrogram calculations are described in full in the ‘Methods' section.
Figure 4
Figure 4. Estimate of statistical significance of the SPD at 1.5–1.9 years during the 1980s.
Dimensionless power spectral density (solid lines) calculated for (a) 551 nm and (b) 472 nm data from 1980 to 1994, using the Lomb–Scargle method after de-trending with a loess fit. The statistical significance of the spectral peaks has been estimated using a Monte-Carlo procedure: dashed and dotted lines show the upper 95th and 99th percentiles of 50,000 realizations of the power spectra calculated in the same way as the spectral peak, but after random shuffling of the magnitude data.
Figure 5
Figure 5. Relationships between 1.5 and 1.9-year spectral power densities for Neptune and GCRs.
(a) Correlation between mean normalized SPD for periodicities between 1.5 and 1.9 years in Neptune's atmosphere against the same periodicity in GCRs at Oulu, for Neptune lagging Oulu by 0–10 years. Dotted lines mark 95% confidence limits from multiple (10,000) realizations of the SPDs calculated with the uncertainties in the magnitude fluctuations. (b) Average Neptune 472 nm SPD against GCR SPD data values for the 1.5–1.9-year periodicity, with Neptune lagging Oulu by 3 years. The filled circles are from 1980 to 1989, when the 1.5–1.9-year periodicity was particularly strong, and the rest of the data are open circles. A lowess fit to all the data points is also shown (solid line).
Figure 6
Figure 6. Comparison of smoothing approaches for Neptune magnitude time series data.
(a) Raw data are shown as points (blue squares for 472 nm, green circles for 551 nm), with three different smoothing lines as indicated on the legend. (b) fluctuations calculated using the three different fits, with the same lines as indicated in the legend for a.
Figure 7
Figure 7. Saturation ratios required for condensation onto ions.
For (a) methane at 75 K and (b) diacetylene (butadiyne) at 100 K.The critical saturation ratio required is reduced if the ions are multiply charged, with calculations given for 1, 2 and 5 elementary charges e.

References

    1. Lockwood G. W. & Thompson D. T. Photometric variability of Neptune, 1972–2000. Icarus 156, 37–51 (2002).
    1. Lockwood G. W. & Jerzykiewycz M. Photometric variability of Uranus and Neptune, 1950–2004. Icarus 180, 442–452 (2006).
    1. Lockwood G. W. Photometry of Uranus and Neptune, 1972–2014. Available at http://www2.lowell.edu/users/wes/index.htm (accessed on 26 June 2015).
    1. Fletcher L. N., Drossart P., Burgdorf M., Orton G. S. & Encrenaz T. Neptune's atmospheric composition from AKARI infrared spectroscopy. Astron. Astrophys. 514, A17 (2010).
    1. Karkoschka E. Neptune's cloud and haze variations 1994–2008 from 500 HST–WFPC2 images. Icarus 2015, 759–773 (2011).

LinkOut - more resources