

Impact of Pre-Procedure Interventions on No-Show Rate in Pediatric Endoscopy
- PMID: 27417352
- PMCID: PMC4928745
- DOI: 10.3390/children2010089
Impact of Pre-Procedure Interventions on No-Show Rate in Pediatric Endoscopy
Abstract
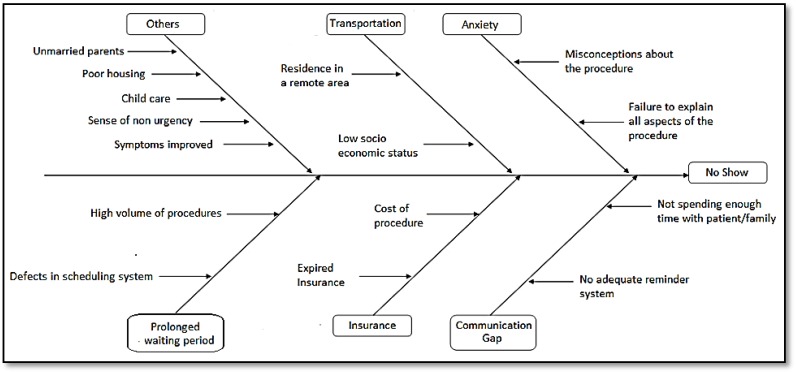
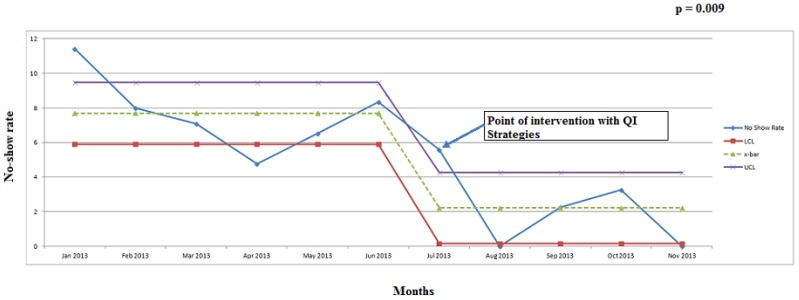
Pediatric endoscopy has evolved into an indispensable tool in the diagnosis and management of gastrointestinal diseases in children. However, there is limited literature focusing on quality improvement initiatives in pediatric endoscopy. The primary goal of this project was to reduce the no-show rate in the pediatric endoscopy unit. Also, we aimed to improve patient and family satisfaction with the procedure by identifying opportunities for improvement. A checklist was designed based on the potential causes of no-show. The endoscopy nurse coordinator reviewed the checklist when scheduling the procedure to identify patients at high risk for non-compliance. Once a risk factor was identified, appropriate actions were taken. She also made a pre-procedure phone call as a reminder and to address any of these risks for non-compliance if present. A patient satisfaction survey was used to identify potential areas for improvement. The no-show rate decreased from an average of 7% in the pre-intervention phase to 2% in the post-intervention phase (p = 0.009). 91% of the patients/family recorded an overall satisfaction of 4 or 5 on a scale of 1-5 5 being best). Quality improvement strategies decreased the no-show rate in the pediatric endoscopy unit. A patient satisfaction survey helped in identifying areas for improvement.
Keywords: endoscopy; pediatrics; quality improvement.
Figures
Similar articles
-
Improving patient safety in the endoscopy unit: utilization of remote video auditing to improve time-out compliance.Gastrointest Endosc. 2019 Sep;90(3):424-429. doi: 10.1016/j.gie.2019.04.237. Epub 2019 May 2. Gastrointest Endosc. 2019. PMID: 31054910
-
Improving Nonattendance at Outpatient Pediatric Endoscopy Unit of a Tertiary Center.J Pediatr Gastroenterol Nutr. 2015 Aug;61(2):234-7. doi: 10.1097/MPG.0000000000000791. J Pediatr Gastroenterol Nutr. 2015. PMID: 25793903
-
Implementation of a checklist before colonoscopy: a quality improvement initiative.Endoscopy. 2018 Mar;50(3):203-210. doi: 10.1055/s-0043-121218. Epub 2017 Dec 13. Endoscopy. 2018. PMID: 29237201
-
Quality Improvement in Pediatric Endoscopy: A Clinical Report From the NASPGHAN Endoscopy Committee.J Pediatr Gastroenterol Nutr. 2017 Jul;65(1):125-131. doi: 10.1097/MPG.0000000000001592. J Pediatr Gastroenterol Nutr. 2017. PMID: 28644360
-
Effect of Facilitated Discharge in Pediatric Orthopedic Patients at an Academic Medical Facility.J Pediatr Health Care. 2019 Jan;33(1):58-63. doi: 10.1016/j.pedhc.2018.06.003. Epub 2018 Aug 25. J Pediatr Health Care. 2019. PMID: 30153962 Review.
Cited by
-
No-show after extracorporeal shock wave lithotripsy treatment in endourology clinic: Can we build a typical patient profile?Int J Urol. 2022 Sep;29(9):963-967. doi: 10.1111/iju.14851. Epub 2022 Mar 18. Int J Urol. 2022. PMID: 35304770 Free PMC article.
-
Predicting no-shows in paediatric orthopaedic clinics.BMJ Health Care Inform. 2020 Mar;27(1):e100047. doi: 10.1136/bmjhci-2019-100047. BMJ Health Care Inform. 2020. PMID: 32165413 Free PMC article.
-
Pediatric endoscopy across multiple clinical settings: Efficiency and adverse events.World J Gastrointest Endosc. 2022 Jun 16;14(6):367-375. doi: 10.4253/wjge.v14.i6.367. World J Gastrointest Endosc. 2022. PMID: 35978713 Free PMC article.
-
Risk Factors for Operating Room No-Show in an Academic Otolaryngology Practice.Laryngoscope. 2022 Sep;132(9):1738-1742. doi: 10.1002/lary.30018. Epub 2022 Feb 5. Laryngoscope. 2022. PMID: 35122445 Free PMC article.
References
LinkOut - more resources
Full Text Sources
Other Literature Sources
Miscellaneous
