

Resting-state networks in 6-to-10 year old children
- PMID: 27417416
- PMCID: PMC6867466
- DOI: 10.1002/hbm.23309
Resting-state networks in 6-to-10 year old children
Abstract
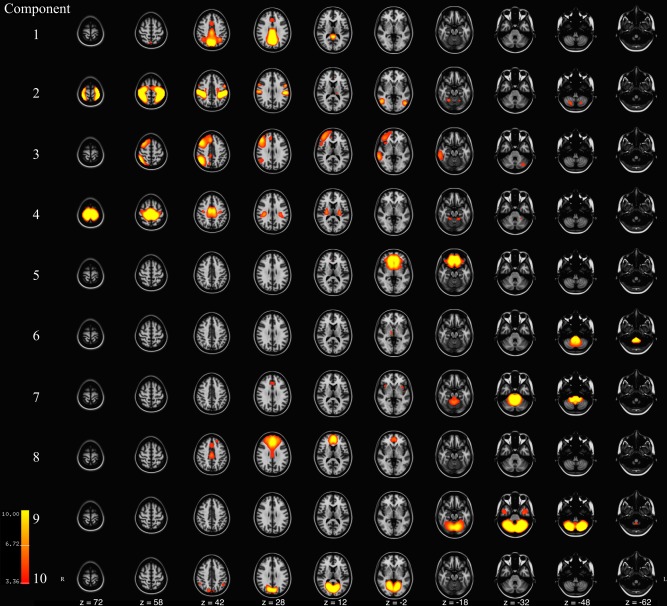
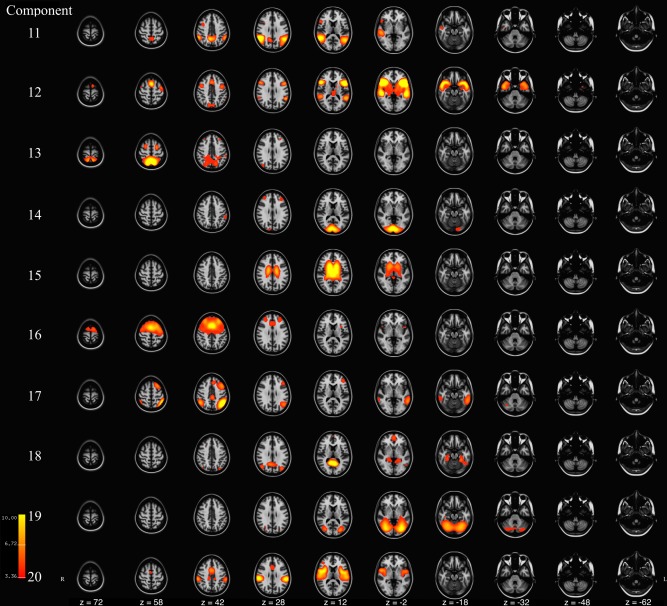
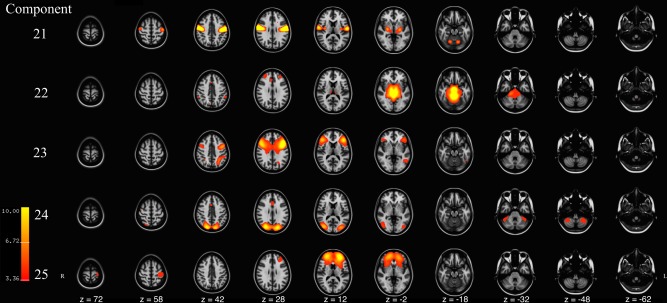
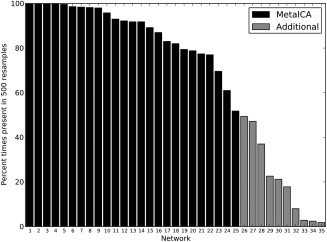
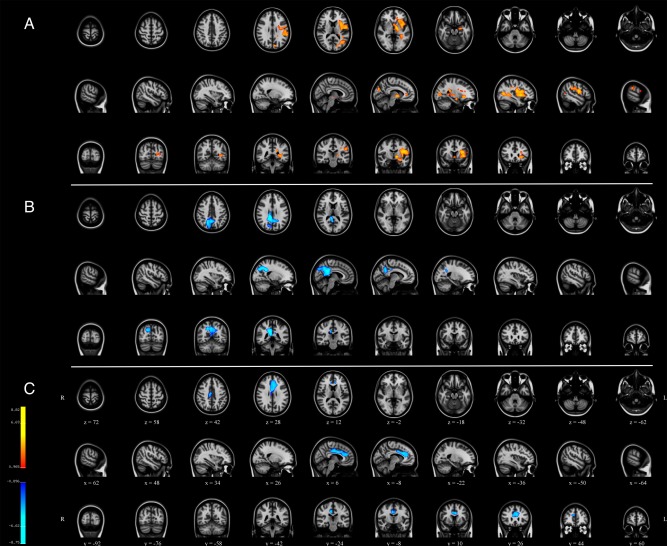
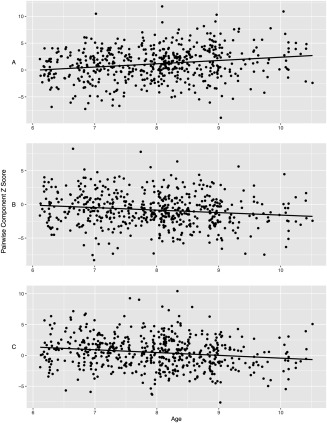
Resting-state functional magnetic resonance imaging provides a non-invasive approach to the study of intrinsic functional brain networks. When applied to the study of brain development, most studies consist of relatively small samples that are not always representative of the general population. Descriptions of these networks in the general population offer important insight for clinical studies examining, for instance, psychopathology or neurological conditions. Thus our goal was to characterize resting-state networks in a large sample of children using independent component analysis (ICA). The study further aimed to describe the robustness of these networks by examining which networks occur frequently after repeated ICA. Resting-state networks were obtained from a sample of 536 6-to-10 year old children. Distributions of networks were built from repeated subsampling and group ICA analyses, and meta-ICA was used to construct a representative set of components. Within- and between-network properties were tested for age-related developmental associations using spatio-temporal regression. After repeated ICA, many networks were present over 95% of the time suggesting the components are highly reproducible. Some networks were less robust, and were observed less than 70% of the time. Age-related associations were also observed in a selection of networks, including the default-mode network, offering further evidence of development in these networks at an early age. ICA-derived resting-state networks appear to be robust, although some networks should further scrutinized if subjected to group-level statistical analyses, such as spatiotemporal regression. The final set of ICA-derived networks and an age-appropriate T1 -weighted template are made available to the neuroimaging community, https://www.nitrc.org/projects/genr. Hum Brain Mapp 37:4286-4300, 2016. © 2016 Wiley Periodicals, Inc.
Keywords: age-related; brain development; dual regression; functional MRI; independent component analysis.
© 2016 Wiley Periodicals, Inc.
Figures
References
-
- Achenbach TM, Rescorla LA (2000): Manual for ASEBA preschool forms & profiles. Burlington, VT: University of Vermont, Research Center for Children, Youth & Families.
-
- Achenbach TM, Ruffle TM (2000): The Child Behavior Checklist and related forms for assessing behavioral/emotional problems and competencies. Pediatr Rev/Am Acad Pediatr 21:265–271. - PubMed
-
- Biswal BB, Mennes M, Zuo XN, Gohel S, Kelly C, Smith SM, Beckmann CF, Adelstein JS, Buckner RL, Colcombe S, Dogonowski AM, Ernst M, Fair D, Hampson M, Hoptman MJ, Hyde JS, Kiviniemi VJ, Kotter R, Li SJ, Lin CP, Lowe MJ, Mackay C, Madden DJ, Madsen KH, Margulies DS, Mayberg HS, McMahon K, Monk CS, Mostofsky SH, Nagel BJ, Pekar JJ, Peltier SJ, Petersen SE, Riedl V, Rombouts SA, Rypma B, Schlaggar BL, Schmidt S, Seidler RD, Siegle GJ, Sorg C, Teng GJ, Veijola J, Villringer A, Walter M, Wang L, Weng XC, Whitfield‐Gabrieli S, Williamson P, Windischberger C, Zang YF, Zhang HY, Castellanos FX, Milham MP (2010): Toward discovery science of human brain function. Proc Natl Acad Sci U S A 107:4734–4739. - PMC - PubMed
Publication types
MeSH terms
LinkOut - more resources
Full Text Sources
Other Literature Sources
Miscellaneous
