

Dynamics of plant DNA replication based on PCNA visualization
- PMID: 27417498
- PMCID: PMC4945867
- DOI: 10.1038/srep29657
Dynamics of plant DNA replication based on PCNA visualization
Erratum in
-
Corrigendum: Dynamics of plant DNA replication based on PCNA visualization.Sci Rep. 2017 Jan 13;7:40831. doi: 10.1038/srep40831. Sci Rep. 2017. PMID: 28084462 Free PMC article. No abstract available.
Abstract
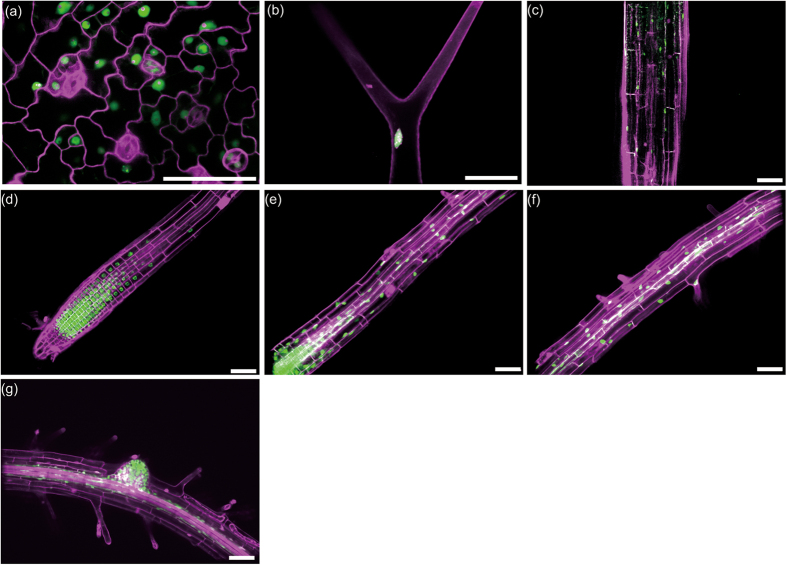
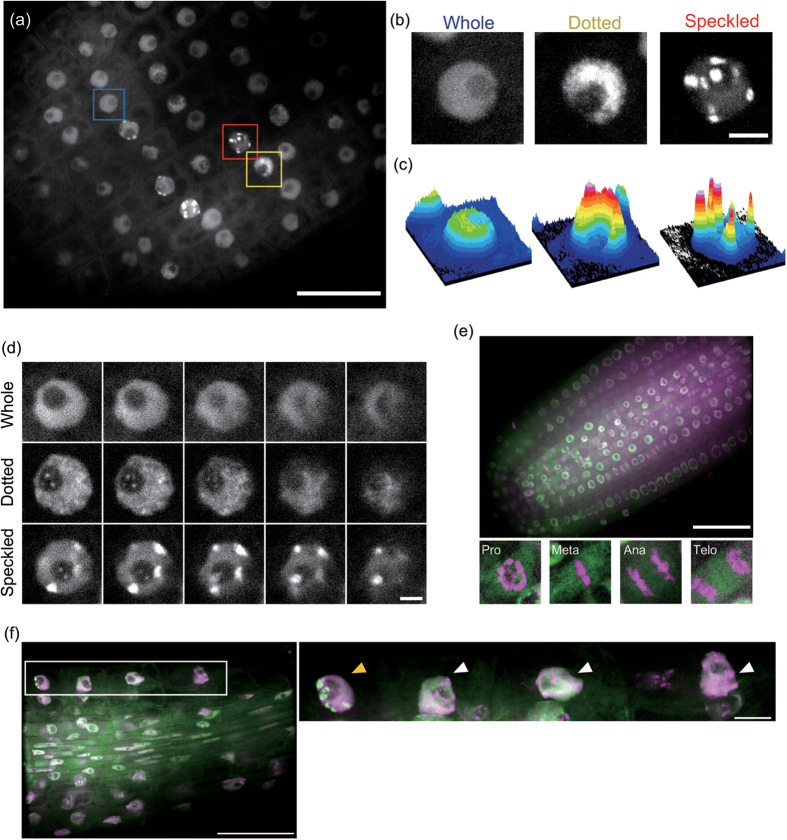
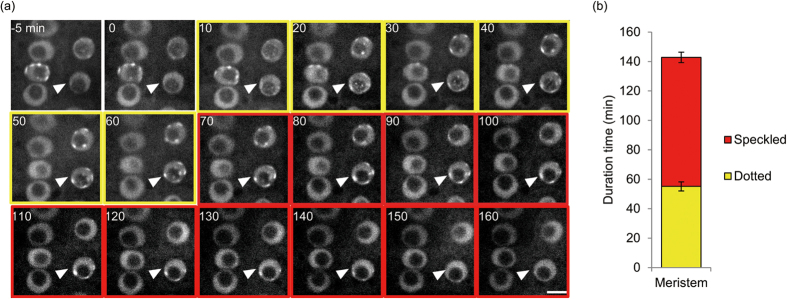
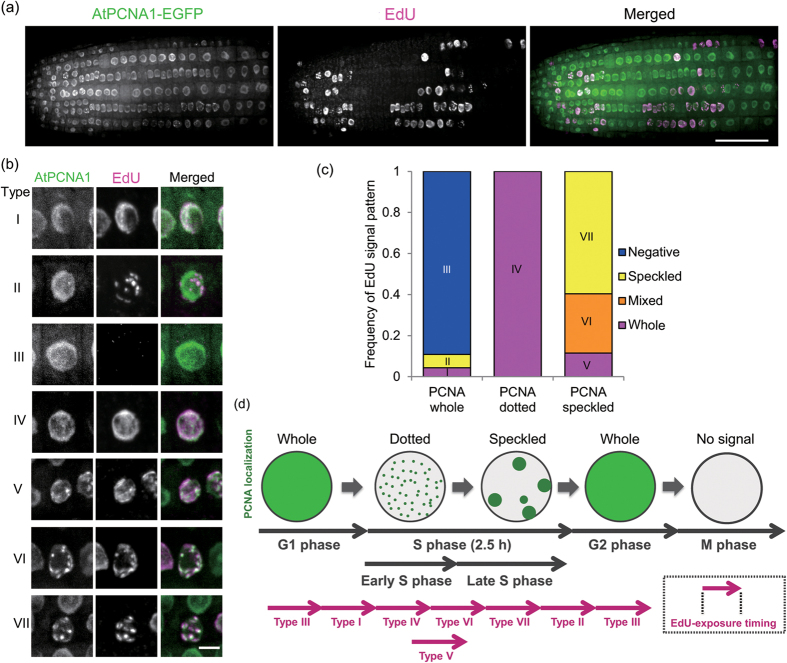
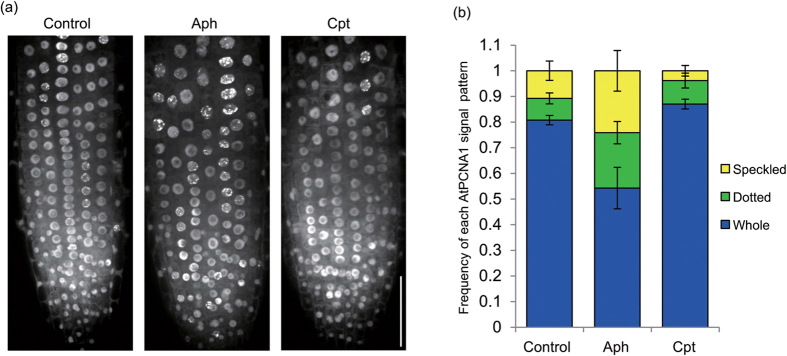
DNA replication is an essential process for the copying of genomic information in living organisms. Imaging of DNA replication in tissues and organs is mainly performed using fixed cells after incorporation of thymidine analogs. To establish a useful marker line to measure the duration of DNA replication and analyze the dynamics of DNA replication, we focused on the proliferating cell nuclear antigen (PCNA), which functions as a DNA sliding clamp for replicative DNA polymerases and is an essential component of replisomes. In this study we produced an Arabidopsis thaliana line expressing PCNA1 fused with the green fluorescent protein under the control of its own promoter (pAtPCNA1::AtPCNA1-sGFP). The duration of the S phase measured using the expression line was consistent with that measured after incorporation of a thymidine analog. Live cell imaging revealed that three distinct nuclear localization patterns (whole, dotted, and speckled) were sequentially observable. These whole, dotted, and speckled patterns of subnuclear AtPCNA1 signals were indicative of the G1 or G2 phase, early S phase and late S phase, respectively. The results indicate that the pAtPCNA1::AtPCNA1-sGFP line is a useful marker line for visualization of S-phase progression in live plant organs.
Figures
Similar articles
-
Two cell-cycle regulated SET-domain proteins interact with proliferating cell nuclear antigen (PCNA) in Arabidopsis.Plant J. 2006 Aug;47(3):395-407. doi: 10.1111/j.1365-313X.2006.02799.x. Epub 2006 Jun 12. Plant J. 2006. PMID: 16771839
-
Targeting of PCNA to sites of DNA replication in the mammalian cell nucleus.J Cell Biochem. 2001;81(1):56-67. doi: 10.1002/1097-4644(20010401)81:1<56::aid-jcb1023>3.0.co;2-#. J Cell Biochem. 2001. PMID: 11180397
-
Arabidopsis thaliana: proliferating cell nuclear antigen 1 and 2 possibly form homo- and hetero-trimeric complexes in the plant cell.Plant Signal Behav. 2013 Jul;8(7):e24837. doi: 10.4161/psb.24837. Epub 2013 Jul 1. Plant Signal Behav. 2013. PMID: 23656863 Free PMC article.
-
Arabidopsis thaliana Y-family DNA polymerase eta catalyses translesion synthesis and interacts functionally with PCNA2.Plant J. 2008 Sep;55(6):895-908. doi: 10.1111/j.1365-313X.2008.03562.x. Epub 2008 May 20. Plant J. 2008. PMID: 18494853
-
Functions of Multiple Clamp and Clamp-Loader Complexes in Eukaryotic DNA Replication.Adv Exp Med Biol. 2017;1042:135-162. doi: 10.1007/978-981-10-6955-0_7. Adv Exp Med Biol. 2017. PMID: 29357057 Review.
Cited by
-
A novel evaluation method for Ki-67 immunostaining in paraffin-embedded tissues.Virchows Arch. 2021 Jul;479(1):121-131. doi: 10.1007/s00428-020-03010-4. Epub 2021 Jan 19. Virchows Arch. 2021. PMID: 33464376
-
Zebularine induces enzymatic DNA-protein crosslinks in 45S rDNA heterochromatin of Arabidopsis nuclei.Nucleic Acids Res. 2022 Jan 11;50(1):244-258. doi: 10.1093/nar/gkab1218. Nucleic Acids Res. 2022. PMID: 34904670 Free PMC article.
-
Take a look at plant DNA replication: Recent insights and new questions.Plant Signal Behav. 2017 Apr 3;12(4):e1311437. doi: 10.1080/15592324.2017.1311437. Plant Signal Behav. 2017. PMID: 28375043 Free PMC article.
-
5-Aminouracil and other inhibitors of DNA replication induce biphasic interphase-mitotic cells in apical root meristems of Allium cepa.Plant Cell Rep. 2020 Aug;39(8):1013-1028. doi: 10.1007/s00299-020-02545-9. Epub 2020 Apr 23. Plant Cell Rep. 2020. PMID: 32328702 Free PMC article.
-
The Armadillo BTB Protein ABAP1 Is a Crucial Player in DNA Replication and Transcription of Nematode-Induced Galls.Front Plant Sci. 2021 Apr 30;12:636663. doi: 10.3389/fpls.2021.636663. eCollection 2021. Front Plant Sci. 2021. PMID: 33995437 Free PMC article.
References
Publication types
MeSH terms
Substances
LinkOut - more resources
Full Text Sources
Other Literature Sources
Molecular Biology Databases
Miscellaneous
