

ALS/FTD-associated FUS activates GSK-3β to disrupt the VAPB-PTPIP51 interaction and ER-mitochondria associations
- PMID: 27418313
- PMCID: PMC5007559
- DOI: 10.15252/embr.201541726
ALS/FTD-associated FUS activates GSK-3β to disrupt the VAPB-PTPIP51 interaction and ER-mitochondria associations
Abstract
Defective FUS metabolism is strongly associated with amyotrophic lateral sclerosis and frontotemporal dementia (ALS/FTD), but the mechanisms linking FUS to disease are not properly understood. However, many of the functions disrupted in ALS/FTD are regulated by signalling between the endoplasmic reticulum (ER) and mitochondria. This signalling is facilitated by close physical associations between the two organelles that are mediated by binding of the integral ER protein VAPB to the outer mitochondrial membrane protein PTPIP51, which act as molecular scaffolds to tether the two organelles. Here, we show that FUS disrupts the VAPB-PTPIP51 interaction and ER-mitochondria associations. These disruptions are accompanied by perturbation of Ca(2+) uptake by mitochondria following its release from ER stores, which is a physiological read-out of ER-mitochondria contacts. We also demonstrate that mitochondrial ATP production is impaired in FUS-expressing cells; mitochondrial ATP production is linked to Ca(2+) levels. Finally, we demonstrate that the FUS-induced reductions to ER-mitochondria associations and are linked to activation of glycogen synthase kinase-3β (GSK-3β), a kinase already strongly associated with ALS/FTD.
Keywords: amyotrophic lateral sclerosis; frontotemporal dementia; glycogen synthase kinase‐3β; protein tyrosine phosphatase interacting protein 51; vesicle‐associated membrane protein‐associated protein B.
© 2016 The Authors. Published under the terms of the CC BY 4.0 license.
Figures

- A
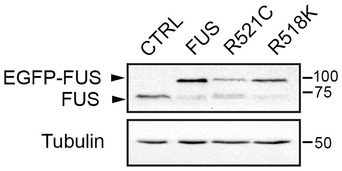
Expression of FUS does not alter expression of VAPB, PTPIP51 or mitofusin‐2 (MFN2) in transfected NSC34 cells. Immunoblots of NSC34 cells transfected with EGFP as a control (CTRL), or wild‐type or mutant EGFP‐FUS. Transfected cells were purified via EGFP using a cell sorter and the samples probed on immunoblots as indicated. On the FUS immunoblot, samples were probed with FUS antibody to show endogenous and transfected proteins; tubulin is shown as a loading control.
- B
Representative electron micrographs of ER–mitochondria associations in NSC34 cells transfected with control EGFP vector (CTRL), EGFP‐FUS, EGFP‐FUSR521C or EGFP‐FUSR518K as indicated; arrowheads with loops show regions of association. Scale bar = 200 nm. Bar chart shows % of the mitochondrial surface closely apposed to ER in the different samples. Data were analysed by one‐way analysis of variance (ANOVA) followed by Tukey's multiple comparison test. N = 27–30 cells and 247–424 mitochondria, error bars are s.e.m.; ***P < 0.001.
- C, D
siRNA loss of FUS does not affect ER–mitochondria associations or alter expression of VAPB, PTPIP51 or mitofusin‐2 (MFN2) in NSC34 cells. (C) Immunoblots of cells either mock transfected or treated with control (CTRL) or FUS siRNAs; GAPDH is shown as a loading control. (D) Representative electron micrographs of ER–mitochondria associations in control (CTRL) and FUS siRNA‐treated cells. Arrowheads with loops show regions of association. Scale bar = 200 nm. Data analysed by unpaired t‐test. N = 27–28 cells and 193–202 mitochondria, error bars are s.e.m.

FU‐induced reductions in ER–mitochondria associations can be detected using SIM. NSC34 cells were transfected with either EGFP control vector, EGFP‐FUS, EGFP‐FUSR521C or EGFP‐FUSR518K and immunostained for TOM20 and PDI to label mitochondria (Mito) and ER, respectively; FUS was detected via their EGFP tags. Merge (ZOOM) shows zoomed images of boxed regions, and co‐localization shows co‐localized pixels. Scale bar = 2 μm. Bar chart shows ER–mitochondria co‐localization (Manders coefficient) normalized to control in the different samples. Data were analysed by one‐way ANOVA with Tukey's post hoc test. A total of 10–14 cells were analysed per condition from three independent experiments; error bars are s.e.m., **P < 0.01 and ***P < 0.001.
ER–mitochondria associations and the VAPB–PTPIP51 interaction are disrupted by wild‐type and ALS/FTD‐mutant FUS. NSC34 cells were transfected with EGFP control vector (CTRL), EGFP‐FUS, EGFP‐FUSR521C or EGFP‐FUSR518K and proximity ligation assays performed using VAPB and PTPIP51 antibodies. FUS were detected via their EGFP tags. Scale bar = 10 μm. Bar chart shows relative number of proximity ligation assay signals/cell. Data were analysed by one‐way ANOVA and Tukey's post hoc test; n = 47–53 cells from five experiments. Error bars are s.e.m.; ***P < 0.001.
Overexpression of FUS reduces the binding of VAPB to PTPIP51 in transfected cells. Cells were transfected as indicated with either control empty vector (CTRL), HA‐PTPIP51 + CTRL, or HA‐PTPIP51 + either EGFP‐FUS, EGFP‐FUSR521C or EGFP‐FUSR518K. PTPIP51 was immunoprecipitated using the HA tag and the amounts of endogenous bound VAPB detected by immunoblotting. Both inputs and immunoprecipitations (IP) are shown and no immunoprecipitating VAPB signals were obtained in the absence of HA‐PTPIP51. Bar chart shows relative levels of VAPB bound to PTPIP51 in the immunoprecipitations following quantification of signals from immunoblots. VAPB signals were normalized to immunoprecipitated PTPIP51‐HA signals. Data were analysed by one‐way ANOVA and Tukey's post hoc test; N = 4. Error bars are s.e.m.; ***P < 0.001.

- A, B
Panel (A) shows NSC34 cells; panel (B) shows mice spinal cords. Samples were probed with no primary antibodies (no Abs), VAPB only, PTPIP51 only or VAPB + PTPIP51 antibodies. In (A) samples are counterstained with DAPI to show nuclei. Scale bar = 10 μm (A) and 30 μm (B). Bar charts show proximity signals/cell. Data were analysed by one‐way ANOVA and Tukey's post hoc test. N = 16 cells (A) and 12 cells (B), error bars are s.e.m.; ***P < 0.001.

Overexpression of FUS does not affect expression of VAPB, PTPIP51 or mitofusin‐2. Immunoblots of spinal cord proteins from three 10‐week‐old FUS transgenic mice and three age‐matched littermates are shown; FUS was detected via its HA tag. Tubulin was used as a loading control.
Representative electron micrographs of ER–mitochondria associations in lumbar spinal cord motor neurons of FUS transgenic mice and their non‐transgenic littermates; arrowheads with loops show regions of association. Scale bar = 200 nm. Bar chart shows % of mitochondrial surface closely apposed to ER in the two samples. Data were analysed by unpaired t‐test. N = 67–88 cells and 438–749 mitochondria, error bars are s.e.m.; ***P < 0.001.
ER–mitochondria associations and the VAPB–PTPIP51 interaction are disrupted in lumbar motor neurons in spinal cords of FUS transgenic mice. Representative images of proximity ligation signals in 11‐week‐old FUS and non‐transgenic (NTg) littermate mice. Data were analysed by unpaired t‐test; N = 40 cells from 3 FUS and 3 non‐transgenic littermates (age 10 weeks). Error bars are s.e.m.; ***P < 0.001.

- A, B
FUS disrupts Ca2+ homoeostasis. HEK293 cells were transfected with M3R and either control vector (CTRL), FUS, FUSR521C or FUSR518K as indicated. Release of ER Ca2+ was induced by treatment of cells with OxoM. Panel (A) shows cytosolic Ca2+ levels with representative Fluo4 fluorescence traces on the left and normalized peak values on the right. Fluo4 fluorescence shows a transient increase in cytosolic Ca2+ levels upon OxoM treatment but compared to control, wild‐type and mutant FUS all increase peak cytosolic Ca2+ levels. Panel (B) shows mitochondrial Ca2+ levels with representative Rhod2 fluorescence traces on the left and normalized peak values on the right. Data were analysed by one‐way ANOVA and Tukey's post hoc test. (A) N = 49–52 cells from three experiments; (B) N = 50–52 cells from five experiments, error bars are s.e.m.; *P < 0.05, **P < 0.01, ***P < 0.001.
- C
FUS reduces mitochondrial ATP production. ATP levels were measured in NSC34 cells transfected with the ATP indicator AT1.03 and either control vector (CTRL), HA‐FUS, HA‐FUSR521C or HA‐FUSR518K. Cells were imaged in time‐lapse prior to and after KCN treatment to inhibit oxidative phosphorylation. Representative traces of YFP/CFP ratios are shown for the different samples; initial YFP/CFP ratios prior to KCN treatment and those after KCN treatment are indicated. The fall in YFP/CFP ratios correlates with ATP produced by oxidative phosphorylation. Bar chart shows relative ATP levels produced by oxidative phosphorylation (OXPHOS) in the different samples. Data were analysed by one‐way ANOVA and Tukey's post hoc test. N = 29–54 cells from five experiments, error bars are s.e.m.; *P < 0.05, ***P < 0.001.
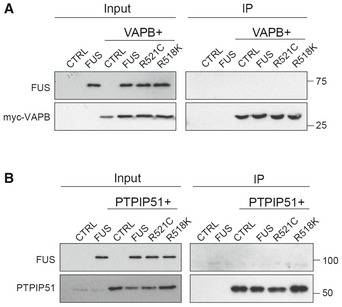
Cells were transfected as indicated with control vector (CTRL), HA‐FUS + CTRL, myc‐VAPB + CTRL, or myc‐VAPB + either HA‐FUS, HA‐FUSR521C or HA‐FUSR518K. VAPB was immunoprecipitated via the myc‐tag and the samples probed on immunoblots for VAPB using rabbit VAPB antibody and for co‐immunoprecipitating FUS via the HA tag. Input VAPB and FUS were detected using myc and HA antibodies.
Cells were transfected as indicated with control vector (CTRL), HA‐FUS + CTRL, HA‐PTPIP51 + CTRL or HA‐PTPIP51 + either HA‐FUS, HA‐FUSR521C or HA‐FUSR518K. PTPIP51 was immunoprecipitated using rat anti‐PTPIP51 and the samples probed for PTPIP51 using rabbit anti‐HA antibody and for co‐immunoprecipitating FUS using rabbit FUS antibody. Input PTPIP51 and FUS were detected using PTPIP51 and EGFP antibodies, respectively.

Cells were transfected with either control vector (CTRL), HA‐FUS, HA‐FUSR521C or HA FUSR518K and the samples probed on immunoblots for GSK‐3β phosphorylated on serine 9 (GSK‐3β‐S9), total GSK‐3β, FUS (using FUS antibody) and tubulin as a loading control. Phosphorylation of GSK‐3β serine 9 is the principal mechanism for regulating its activity; serine 9 phosphorylation inhibits GSK‐3β activity. Bar chart shows relative levels of GSK‐3β serine 9 phosphorylation following quantification of signals from immunoblots and normalization to total GSK‐3β signals. Data were analysed by one‐way ANOVA and Tukey's post hoc test. N = 4, error bars are s.e.m.; *P < 0.05.
Immunoblots of total and serine 9 phosphorylated GSK‐3β in spinal cords from three 10‐week‐old FUS transgenic mice and their non‐transgenic littermates. Samples were probed for tubulin as a loading control. Bar chart shows relative levels of GSK‐3β serine 9 phosphorylation following quantification of signals from immunoblots and normalization to total GSK‐3β signals. Data were analysed by unpaired t‐test, error bars are s.e.m.; *P < 0.05.
Cytosolic FUS activates GSK‐3β more potently than wild‐type FUS. Cells were transfected with EGFP control, EGFP‐FUS or EGFP‐FUS lacking its C‐terminal nuclear localization signal (FUSΔC). Samples were probed on immunoblots for total GSK‐3β, GSK‐3β phosphorylated on serine 9, FUS (using EGFP antibody) and tubulin as a loading control. Bar chart shows relative levels of GSK‐3β serine 9 phosphorylation following quantification of signals from immunoblots and normalization to total GSK‐3β signals. Data were analysed by one‐way ANOVA and Tukey's post hoc test. N = 3, error bars are s.e.m.; **P < 0.01, ***P < 0.001.
Cytosolic FUS reduces the VAPB–PTPIP51 interaction more potently than wild‐type FUS. Cells were transfected with PTPIP51‐HA, and either EGFP control, EGFP‐FUS or EGFP‐FUSΔC. PTPIP51 was immunoprecipitated using the HA tag and bound endogenous VAPB detected by immunoblotting. Both inputs and immunoprecipitations (IP) are shown. FUS was detected using EGFP antibody. Bar chart shows relative levels of VAPB bound to PTPIP51 in the immunoprecipitations following quantification of signals from immunoblots. VAPB signals were normalized to immunoprecipitated PTPIP51‐HA signals. Data were analysed by one‐way ANOVA and Tukey's post hoc test; N = 3. Error bars are s.e.m.; **P < 0.01, ***P < 0.001.

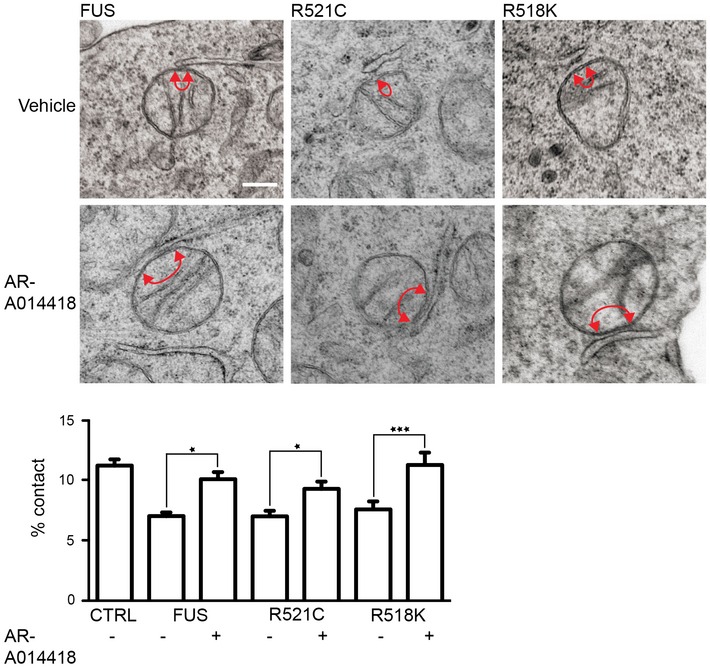
Representative electron micrographs of ER–mitochondria associations in NSC34 cells treated with either vehicle or GSK‐3β inhibitors AR‐A014418 (1 μM) or CT99021 (100 nM) for 16 h. Arrowheads with loops show regions of association; scale bar = 200 nm. Bar charts shows % of the mitochondrial surface closely apposed to ER in the different samples. Data were analysed by one‐way ANOVA followed by Tukey's multiple comparison test. N = 32 cells and 181–210 mitochondria. Error bars are s.e.m.; *P < 0.05.
VAPB‐PTPIP51 proximity ligation assays of NSC34 cells treated with either vehicle, 1 μM AR‐A014418 or 100 nM CT99021 for 16 h. Cells were also stained for nuclei with DAPI. Bar chart shows relative number of proximity ligation assay signals/cell. Data were analysed by one‐way ANOVA and Tukey's post hoc test; n = 103–173 cells from five experiments. Error bars are s.e.m.; **P < 0.01, ***P < 0.001.

Similar articles
-
ER-mitochondria associations are regulated by the VAPB-PTPIP51 interaction and are disrupted by ALS/FTD-associated TDP-43.Nat Commun. 2014 Jun 3;5:3996. doi: 10.1038/ncomms4996. Nat Commun. 2014. PMID: 24893131 Free PMC article.
-
Stimulating VAPB-PTPIP51 ER-mitochondria tethering corrects FTD/ALS mutant TDP43 linked Ca2+ and synaptic defects.Acta Neuropathol Commun. 2024 Feb 23;12(1):32. doi: 10.1186/s40478-024-01742-x. Acta Neuropathol Commun. 2024. PMID: 38395965 Free PMC article.
-
Disruption of ER-mitochondria tethering and signalling in C9orf72-associated amyotrophic lateral sclerosis and frontotemporal dementia.Aging Cell. 2022 Feb;21(2):e13549. doi: 10.1111/acel.13549. Epub 2022 Jan 13. Aging Cell. 2022. PMID: 35026048 Free PMC article.
-
Structural and functional studies of the VAPB-PTPIP51 ER-mitochondria tethering proteins in neurodegenerative diseases.Acta Neuropathol Commun. 2025 Mar 5;13(1):49. doi: 10.1186/s40478-025-01964-7. Acta Neuropathol Commun. 2025. PMID: 40045432 Free PMC article. Review.
-
Targeting ER-Mitochondria Signaling as a Therapeutic Target for Frontotemporal Dementia and Related Amyotrophic Lateral Sclerosis.Front Cell Dev Biol. 2022 May 27;10:915931. doi: 10.3389/fcell.2022.915931. eCollection 2022. Front Cell Dev Biol. 2022. PMID: 35693938 Free PMC article. Review.
Cited by
-
Boosting Mitochondrial Potential: An Imperative Therapeutic Intervention in Amyotrophic Lateral Sclerosis.Curr Neuropharmacol. 2023;21(5):1117-1138. doi: 10.2174/1570159X20666220915092703. Curr Neuropharmacol. 2023. PMID: 36111770 Free PMC article. Review.
-
Mitochondria-associated endoplasmic reticulum membranes and cardiac hypertrophy: Molecular mechanisms and therapeutic targets.Front Cardiovasc Med. 2022 Oct 20;9:1015722. doi: 10.3389/fcvm.2022.1015722. eCollection 2022. Front Cardiovasc Med. 2022. PMID: 36337896 Free PMC article. Review.
-
Nup358 restricts ER-mitochondria connectivity by modulating mTORC2/Akt/GSK3β signalling.EMBO Rep. 2024 Oct;25(10):4226-4251. doi: 10.1038/s44319-024-00204-8. Epub 2024 Jul 18. EMBO Rep. 2024. PMID: 39026009 Free PMC article.
-
Meta-analysis of Genetic Modifiers Reveals Candidate Dysregulated Pathways in Amyotrophic Lateral Sclerosis.Neuroscience. 2019 Jan 1;396:A3-A20. doi: 10.1016/j.neuroscience.2018.10.033. Neuroscience. 2019. PMID: 30594291 Free PMC article.
-
Novel and Recurrent Mutations in a Cohort of Chinese Patients With Young-Onset Amyotrophic Lateral Sclerosis.Front Neurosci. 2019 Dec 6;13:1289. doi: 10.3389/fnins.2019.01289. eCollection 2019. Front Neurosci. 2019. PMID: 31866807 Free PMC article.
References
MeSH terms
Substances
Grants and funding
LinkOut - more resources
Full Text Sources
Other Literature Sources
Medical
Molecular Biology Databases
Miscellaneous
