. 2016 Jul 8;3(3):ENEURO.0101-16.2016.
doi: 10.1523/ENEURO.0101-16.2016. eCollection 2016 May-Jun.

Interactions between Dorsal and Ventral Root Stimulation on the Generation of Locomotor-Like Activity in the Neonatal Mouse Spinal Cord

Affiliations

Interactions between Dorsal and Ventral Root Stimulation on the Generation of Locomotor-Like Activity in the Neonatal Mouse Spinal Cord

Avinash Pujala et al. eNeuro. .

Abstract

We investigated whether dorsal (DR) and ventral root (VR) stimulus trains engage common postsynaptic components to activate the central pattern generator (CPG) for locomotion in the neonatal mouse spinal cord. VR stimulation did not activate the first order interneurons mediating the activation of the locomotor CPG by sacrocaudal afferent stimulation. Simultaneous stimulation of adjacent dorsal or ventral root pairs, subthreshold for evoking locomotor-like activity, did not summate to activate the CPG. This suggests that locomotor-like activity is triggered when a critical class of efferent or afferent axons is stimulated and does not depend on the number of stimulated axons or activated postsynaptic neurons. DR- and VR-evoked episodes exhibited differences in the coupling between VR pairs. In DR-evoked episodes, the coupling between the ipsilateral and contralateral flexor/extensor roots was similar and stronger than the bilateral extensor roots. In VR-evoked episodes, ipsilateral flexor/extensor coupling was stronger than both the contralateral flexor/extensor and the bilateral extensor coupling. For both types of stimulation, the coupling was greatest between the bilateral L1/L2 flexor-dominated roots. This indicates that the recruitment and/or the firing pattern of motoneurons differed in DR and VR-evoked episodes. However, the DR and VR trains do not appear to activate distinct CPGs because trains of DR and VR stimuli at frequencies too low to evoke locomotor-like activity did so when they were interleaved. These results indicate that the excitatory actions of VR stimulation converge onto the CPG through an unknown pathway that is not captured by current models of the locomotor CPG.

Keywords: central pattern generator; dorsal root; locomotion; spinal cord; ventral root.


Conflict of interest statement

The authors report no conflict of interest.

Figures
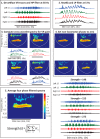
Figure 1.
Figure 1.
Schematic showing the calculation of locomotor strength. The five numbered panels illustrate successive operations performed on the four VR records. The VR records are first high-pass (HP) filtered at 50 Hz and the stimulus artefacts digitally removed (1). After rectification and low-pass (LP) filtering (2), the cross-wavelet spectra are computed (3) for each pair of VRs whose activity is expected to alternate (L5L vs L1L; L1L vs L1R; L1R vs L5R; L5R vs L5L). The non-locomotor phases (>240° and <120°) are then set to zero (4). The four resulting spectra are then averaged (5) and the strength is calculated as indicated by the formula. The power in the cross-wavelet spectrum is indicated by the color map shown to the right of the spectrum. Bottom right, Three locomotor-like episodes are shown with different locomotor strengths. Note the poor development of bursting in the bilateral L5 roots is reflected in the low strengths (146, 153) of the first two episodes. Once the L5 bursting occurs the strength increases to 275.
Figure 2.
Figure 2.
Stimulation of the DRG does not evoke locomotor-like activity if the corresponding DR is cut. A, Schematic to illustrate two possible ways in which DRG afferents (blue) might enter a VR. B, Stimulation of the DRG with the VR cut evokes locomotor-like activity. C, DRG stimulation fails to evoke locomotor-like activity when the DRG is stimulated with the DR cut. D, When the spinal nerve is stimulated with the DR cut, locomotor-like activity is evoked. E, DC recordings of the VRs during an episode of locomotor-like activity triggered by stimulation of the right DRG. F, When the corresponding DR is cut all VR activity is abolished when the DRG is stimulated.
Figure 3.
Figure 3.
The strength of locomotor-like activity increases with increasing stimulus intensity applied to either a dorsal or a ventral root. A, Locomotor-like activity elicited by stimulation of the L6 ventral root at 1× (top traces) and 1.1× (bottom traces) threshold intensity. B, In the same preparation, locomotor-like activity was elicited by stimulation of the L6 dorsal root at 1× (top traces) and 1.1× (bottom traces) threshold intensity. The bar indicates the duration of stimulus train (10 s). The values of locomotor strength (S; see Materials and Methods) computed for each of the displayed episodes is shown to the top and right of the traces. The displayed values reflect the effect of stimulation intensity. C, Locomotor strengths calculated for dorsal (558 from 63 experiments) and VR-evoked episodes (188 from 24 experiments) are plotted as a function of stimulus intensity expressed in multiples of threshold. The horizontal lines show median values and the ends of the vertical lines mark the 25th and 75th quartile of the sample set. The asterisk above a group indicates a statistically significant difference with the group immediately to the left.
Figure 4.
Figure 4.
Comparison of the locomotor-like activity produced by dorsal lumbar/sacral root (A) and lumbar ventral (B) root stimulation. The average coherent power (+SD) between the different root pairs is expressed with reference to the normalized power of the ipsilateral flexor and extensor VRs. For the DR stimulation episodes 300 trials from 45 preparations were used; for VR stimulation 145 trials from 25 preparations were used. The open circles represent the averaged value of the coherent power for each preparation (45 DR, 25 VR). The lines above the graph indicate significant differences between the connected pairs (Kruskal–Wallis followed by χ-squared statistic, p < 0.01). The grey lines highlight the significant differences between dorsal and ventral root stimulation. i F-E, L1 versus L5 Ipsilateral to the stimulated root; Bi F-F, left L1 versus right L1; c F-E, L1 versus L5 contralateral to the stimulated root; Bi E-E, left L5 versus right L5.
Figure 5.
Figure 5.
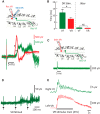
Stimulation of a dorsal, but not a ventral root evokes a short latency potential in the ventral funiculus. A, Schematic of the spinal cord showing the stimulation and recording setup. A stimulating electrode is applied to the left L6 DR (blue) and recording electrodes are applied to the ipsilateral L6 VR (red) and a strip of the contralateral L3 VF (green). Below the schematic are shown 25 superimposed recordings from the VF (green) and the VR (red) in response to DR stimulation (4× Thr) once every 30 s. The arrowheads show the point at which the minimum and maximum latency difference (jitter) was computed. B, The left pair of bars show the mean (±SD) onset latencies of the DR-evoked VR (red) and VF (green) responses, whereas the right pair show the average jitter for each type of recording (6 experiments; 25 trials each). *Indicates statistically significant difference in onset latency (p < 0.001, Tukey's multiple-comparisons test). C, Schematic showing the spinal cord with the left L6 VR (red) stimulated and the contralateral L3 VF (green) recorded. The dashed red line within the L6 segment shows the putative monosynaptic connection between the stimulated VR (red) and the cell bodies of the recorded VF interneurons (green). Below this is the response in the VF recording to 100 stimuli (100 µA) applied to the L6 VR every 30 s. The green area defines ±2 SD of the mean. D, Long-latency responses evoked in the VF in response to VR stimuli. E, Simultaneous low-pass filtered VR and VF recordings of a locomotor-episode in response to a VR stimulus train (4 Hz).
Figure 6.
Figure 6.
Simultaneous stimulation of dorsal and ventral roots at just subthreshold intensities does not elicit locomotor-like activity. A, B, Top traces show examples of locomotor-like rhythms elicited by stimulation of the homonymous dorsal (left, DR stim) and ventral (right, VR stim) roots at threshold intensity (1× Thr). The line at the bottom of the traces shows the duration of the stimulus train (10 s). The activity was high-pass filtered at 50 Hz. The traces below this show that locomotor-like activity was not produced by root when the stimulus intensity was set to 0.9× threshold. C, When the two subthreshold stimuli were combined locomotor activity was still not evoked. D, Box plots showing pooled data from several experiments (43 trials from 18 preparations). Stimulation of the dorsal and ventral alone or together does not result in locomotor-like activity. The values of strength were normalized to the mean of the ventral root sample set. The lines in the box plots show the median values, and the edges of the black rectangles show the 25th and 75th quartiles of the data.
Figure 7.
Figure 7.
Interleaved, suboptimal dorsal and ventral root-evoked responses combine to trigger locomotor-like activity. A, An episode of locomotor-like activity elicited by stimulation of the left L6 dorsal root with a train of electrical pulses appearing every 375 ms. The black traces show ventral root signals from the left (top) and right (bottom) L1 VRs, whereas the spectrogram above displays the corresponding cross-wavelet power spectrum. The hot regions in the spectrum with leftward pointing arrows indicate locomotor-like activity, while the cooler regions with rightward pointing arrows result from stimulus-locked synchronous responses. The vertical ticks below the VR traces indicate the stimulus pulses. The trace on the right shows the global power spectrum obtained by summing values in the cross-wavelet spectrum along the time dimension for all frequencies. The global power spectrum displayed here has been normalized by the maximum value. The number displayed next to the peak of the global power spectrum (red) indicates the frequency at which the power peaks. The red polar plot in the bottom right corner shows the power-weighted distribution of phase angles (arrows) for all regions of significant power appearing the cross-wavelet spectrogram. B, An episode of locomotor-like activity elicited in the same preparation as in A, but by stimulation of the L6 VR with a train of electrical pulses delivered at intervals of 375 ms (vertical red ticks). C, D, Activity resulting from the stimulation of the aforementioned dorsal and ventral root, respectively, but with pulse trains with an interpulse interval twice as long as in A and B (ie, 750 ms). The activity evoked at this stimulus frequency is not locomotor-like, although the bursts in the two VRs appear somewhat rhythmic, their phases are not tightly coupled and are completely out-of-phase. E, When the suboptimal dorsal and ventral root stimulus trains were offset by 375 ms so as to interleave the pulses delivered to the different roots (red and blue vertical ticks below the VR traces) and create a combined train with an effective interpulse interval of 375 ms, locomotor-like activity was evoked.
Figure 8.
Figure 8.
Interleaved, suboptimal brainstem and ventral root stimulus trains combine to trigger locomotor-like activity. The layout of this figure is the same as that of Figure7. A, B, Cross-wavelet spectrograms (top) of locomotor-like activity recorded from the left and right L6 VRs (black traces, bottom) evoked in response to stimulation of the brainstem or the L5 VR with an optimal 6.7 Hz stimulus train. The blue and red bars below the VR activity represent the stimuli. The maximum XW power is at 0.6 Hz (brainstem) and 0.77 Hz (VR) and is shown in the power spectra on the right. The activity between the roots is alternating (arrows to the left, phase plot in the bottom right corner). C, D, Stimulation of the brainstem at the suboptimal frequency of 3.33 Hz evoked synchronized bursting (arrows to the right). Stimulation of the VR at the 3.33 Hz evoked weak alternating bursts together with the stimulus locked synchronous signals. E, Interleaving the 3.33 Hz brainstem and VR stimulus trains (alternating blue and red bars) evoked locomotor-like activity.
Figure 9.
Figure 9.
Comparison of the strength of locomotor-like activity evoked by optimal, suboptimal, and interleaved dorsal and ventral root stimulation. Box and whisker plots compare the strengths of locomotor-like episodes evoked when stimulating at the optimal frequency, suboptimal frequency and interleaved suboptimal frequencies. The horizontal lines within the boxes indicate the median values, the lower and upper edges of the boxes mark the 25th and 75th percentile, and the whiskers extend to the most extreme data points. The X indicates that locomotor-like activity could not be elicited. The strength is expressed as normalized values because data from different preparations were pooled. The data were generated from seven ipsilateral pairs of roots and six contralateral pairs.
Figure 10.
Figure 10.
Locomotor-like activity initiated by stimulation of one pathway continues without interruption when the stimulus is abruptly switched to a different pathway. A, B, The panels show episodes of locomotor-like activity recorded from the left and right L1 ventral roots, initiated by either dorsal (A; DR stim 15 sec, 4 Hz, 2 x Thr.) or ventral root (B; VR stim 10 sec, 4 Hz, 2x Thr.) stimulation. C, D, Locomotor episodes evoked by sequential dorsal and ventral root stimulation. C, The DR is stimulated for 5 s (blue stimulus markers below neurograms) followed by VR stimulation for 10 s (red stimulus markers below neurograms). D, The order is reversed with the VR stimulus (5 s) followed by the DR stimulus (10 s). In each case, the locomotor-like episode was evoked at 0.52 Hz. E, Locomotor-like activity evoked by stimulation the right S2 DR for 10 s followed by stimulation of the right L5 VR for 5 s. In this example, the switch in the stimulated root resulted in a rapid change in locomotor frequency from 0.46 to 1.4 Hz without obvious phase perturbation (see phase plot in bottom right corner). F, Instantaneous locomotor frequency for the evoked locomotor episode shown in E.

Similar articles

Cited by

References

    1. Ampatzis K, Song J, Ausborn J, El Manira A (2014) Separate microcircuit modules of distinct V2a interneurons and motoneurons control the speed of locomotion. Neuron 83:934–943. 10.1016/j.neuron.2014.07.018 [TQ1] - DOI - PubMed
    1. Atsuta Y, Garcia-Rill E, Skinner RD (1990) Characteristics of electrically induced locomotion in rat in vitro brain stem-spinal cord preparation. J Neurophysiol 64:727– 735. - PubMed
    1. Biscoe TJ, Nickels SM, Stirling CA (1982) Numbers and sizes of nerve fibres in mouse spinal roots. Q J Exp Physiol 67:473–494. - PubMed
    1. Blivis D, Mentis GZ, O'Donovan MJ, Lev-Tov A (2007) Differential effects of opioids on sacrocaudal afferent pathways and central pattern generators in the neonatal rat spinal cord. J Neurophysiol 97:2875–2886. 10.1152/jn.01313.2006 - DOI - PubMed
    1. Bonnot A, Chub N, Pujala A, O’Donovan MJ (2009) Excitatory actions of ventral root stimulation during network activity generated by the disinhibited neonatal mouse spinal cord. J Neurophysiol 101:2995–3011. 10.1152/jn.90740.2008 - DOI - PMC - PubMed

Publication types

MeSH terms

LinkOut - more resources