

Relative Skeletal Maturation and Population Ancestry in Nonobese Children and Adolescents
- PMID: 27419386
- PMCID: PMC5257250
- DOI: 10.1002/jbmr.2914
Relative Skeletal Maturation and Population Ancestry in Nonobese Children and Adolescents
Abstract
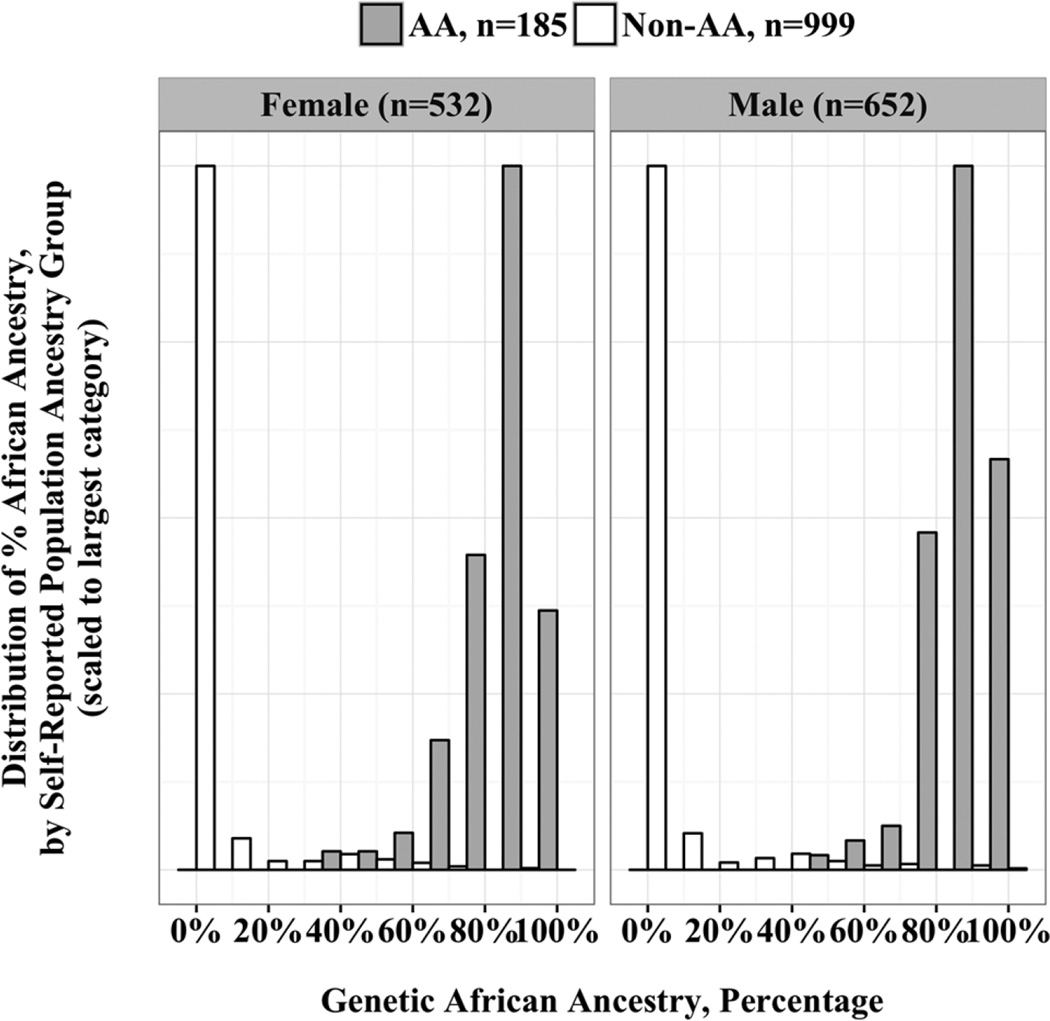
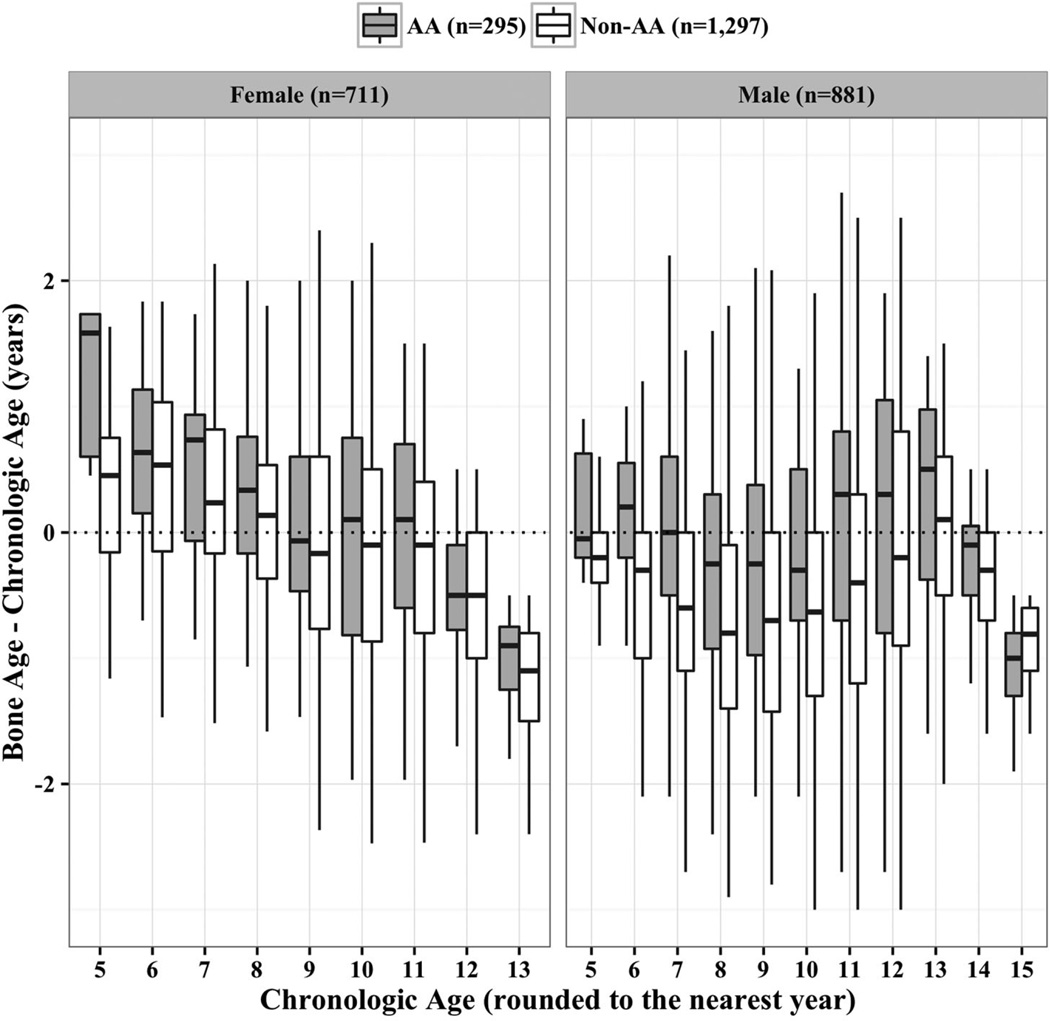
More rapid skeletal maturation in African-American (AA) children is recognized and generally attributed to an increased prevalence of obesity. The objective of the present study was to evaluate the effects of population ancestry on relative skeletal maturation in healthy, non-obese children and adolescents, accounting for body composition and sexual maturation. To do this, we leveraged a multiethnic, mixed-longitudinal study with annual assessments for up to 7 years (The Bone Mineral Density in Childhood Study and its ancillary cohort) conducted at five US clinical centers. Participants included 1592 children, skeletally immature (45% females, 19% AA) who were aged 5 to 17 years at study entry. The primary outcome measure was relative skeletal maturation as assessed by hand-wrist radiograph. Additional covariates measured included anthropometrics, body composition by dual-energy X-ray absorptiometry (DXA), and Tanner stage of sexual maturation. Using mixed effects longitudinal models, without covariates, advancement in relative skeletal maturation was noted in self-reported AA girls (∼0.33 years, p < 0.001) and boys (∼0.43 years, p < 0.001). Boys and girls of all ancestry groups showed independent positive associations of height, lean mass, fat mass, and puberty with relative skeletal maturation. The effect of ancestry was attenuated but persistent after accounting for covariates: for girls, 0.19 years (ancestry by self-report, p = 0.02) or 0.29 years (ancestry by admixture, p = 0.004); and for boys, 0.20 years (ancestry by self-report, p = 0.004), or 0.29 years (ancestry by admixture, p = 0.004). In summary, we conclude that advancement in relative skeletal maturation was associated with AA ancestry in healthy, non-obese children, independent of growth, body composition, and puberty. Further research into the mechanisms underlying this observation may provide insights into the regulation of skeletal maturation. © 2016 American Society for Bone and Mineral Research.
Keywords: BONE AGE; GROWTH; PEDIATRIC ENDOCRINOLOGY; POPULATION ANCESTRY; SKELETAL MATURATION.
© 2016 American Society for Bone and Mineral Research.
Conflict of interest statement
All authors state that they have no conflicts of interest.
Figures

References
-
- Malina RM. Growth and physical performance of American Negro and white children. A comparative survey of differences in body size, proportions and composition, skeletal maturation, and various motor performances. Clin Pediatr. 1969;8(8):476–483. - PubMed
-
- Mazess RB, Cameron JR. Skeletal growth in school children: maturation and bone mass. Am J Phys Anthropol. 1971;35(3):399–407. - PubMed
-
- Garn SM, Clark DC. Nutrition, growth, development, and maturation: findings from the ten-state nutrition survey of 1968–1970. Pediatrics. 1975;56(2):306–319. - PubMed
MeSH terms
Grants and funding
LinkOut - more resources
Full Text Sources
Other Literature Sources
Medical
