Review
. 2016 Jul 14;166(2):279-287.
doi: 10.1016/j.cell.2016.06.047.

Genotypic Context and Epistasis in Individuals and Populations

Affiliations
Review

Genotypic Context and Epistasis in Individuals and Populations

Timothy B Sackton et al. Cell. .

Abstract

Genes encode components of coevolved and interconnected networks. The effect of genotype on phenotype therefore depends on genotypic context through gene interactions known as epistasis. Epistasis is important in predicting phenotype from genotype for an individual. It is also examined in population studies to identify genetic risk factors in complex traits and to predict evolution under selection. Paradoxically, the effects of genotypic context in individuals and populations are distinct and sometimes contradictory. We argue that predicting genotype from phenotype for individuals based on population studies is difficult and, especially in human genetics, likely to result in underestimating the effects of genotypic context.


Conflict of interest statement

Conflicts of interest: None for either author

Figures
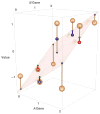
Fig. 1
Fig. 1
Hierarchical fitting of variance components obscures physiological epistasis in population studies. (A) Genotype-phenotype correspondence in a model of complementary epistasis, in which the phenotypes of genotypes A– B– are assigned values of +1 and genotypes aa ––, –– bb, and aa bb are assigned values −1 (as in Table 1). Genotypes are represented as brown spheres, and the deviation of each phenotypic value from the population mean is shown as a brown dashed line. The frequencies of A and B both set equal to 0.459, as in Crow and Kimura (1970, p. 176). The average of the squared deviations is the total genetic variance, in this case equal to 1.000. (B) The plane is the least-squares fit to an additive model of gene action. The black spheres are the predicted phenotypes based on an additive model, and the additive genetic variance is the variance among these predicted phenotypes (in this example 0.582). (C) The red spheres depict the predicted phenotypes based on a model that includes additive as well as dominance effects, but no epistasis. The dashed red lines are the deviations from the additive model due to dominance. The dominance variance equals the average of these squared deviations, in this case 0.247. After allocating the additive and dominance variance, the remaining variance is the epistatic variance (statistical epistasis), which is a mere 17.1% of the total genetic variance.

References

    1. Altshuler DM, Durbin RM, Abecasis GR, Bentley DR, Chakravarti A, Clark AG, Donnelly P, Eichler EE, Flicek P, Gabriel SB, et al. A global reference for human genetic variation. Nature. 2015;526:68–74. - PMC - PubMed
    1. Bateson W. The progress of genetics since the rediscovery of Mendel’s paper. Progressus Rei Botanicae. 1907;1:368–382.
    1. Bloom JS, Ehrenreich IM, Loo WT, Lite TLV, Kruglyak L. Finding the sources of missing heritability in a yeast cross. Nature. 2013;494:234–237. - PMC - PubMed
    1. Cairns BR, Ramer SW, Kornberg RD. Order of action of components in the yeast pheromone response pathway revealed with a dominant allele of the STE11 kinase and the multiple phosphorylation of the STE7 kinase. Genes Dev. 1992;6:1305–1318. - PubMed
    1. Cheverud JM, Routman EJ. Epistasis and its contribution to genetic variance components. Genetics. 1995;139:1455–1461. - PMC - PubMed