. 2016 Jul 14;166(2):408-423.
doi: 10.1016/j.cell.2016.06.037.

Endosome-ER Contacts Control Actin Nucleation and Retromer Function through VAP-Dependent Regulation of PI4P

Affiliations

Endosome-ER Contacts Control Actin Nucleation and Retromer Function through VAP-Dependent Regulation of PI4P

Rui Dong et al. Cell. .

Abstract

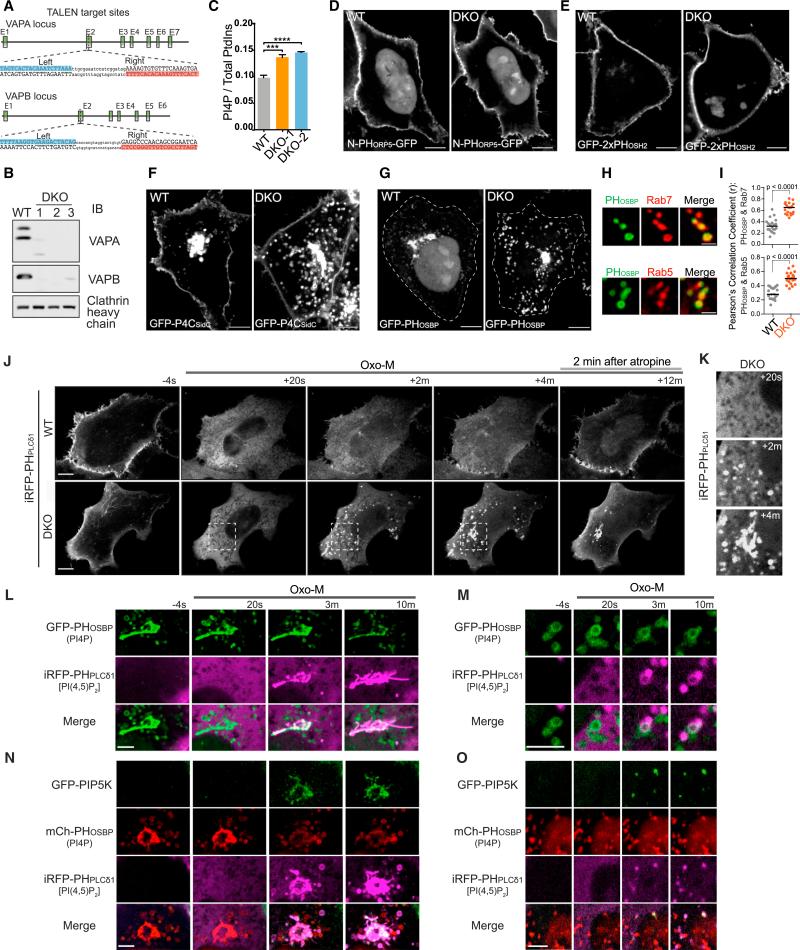
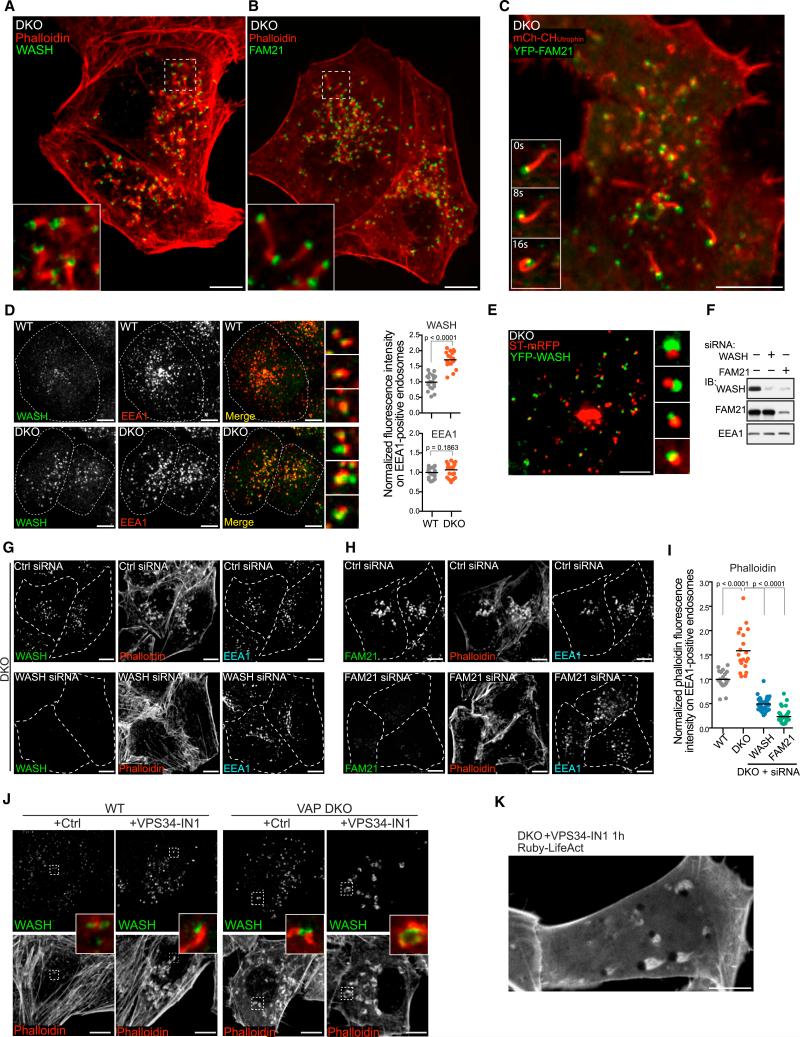
VAP (VAPA and VAPB) is an evolutionarily conserved endoplasmic reticulum (ER)-anchored protein that helps generate tethers between the ER and other membranes through which lipids are exchanged across adjacent bilayers. Here, we report that by regulating PI4P levels on endosomes, VAP affects WASH-dependent actin nucleation on these organelles and the function of the retromer, a protein coat responsible for endosome-to-Golgi traffic. VAP is recruited to retromer budding sites on endosomes via an interaction with the retromer SNX2 subunit. Cells lacking VAP accumulate high levels of PI4P, actin comets, and trans-Golgi proteins on endosomes. Such defects are mimicked by downregulation of OSBP, a VAP interactor and PI4P transporter that participates in VAP-dependent ER-endosomes tethers. These results reveal a role of PI4P in retromer-/WASH-dependent budding from endosomes. Collectively, our data show how the ER can control budding dynamics and association with the cytoskeleton of another membrane by direct contacts leading to bilayer lipid modifications.


Figures

Figure 1
Figure 1. Increased Abundance of PI4P on Endosomes in VAP DKO Cells
(A) Schematic depiction of TALEN targeting sites in exon 2 of human VAPA and VAPB loci. The sequences targeted by the TALEN pairs are highlighted in blue (left arm) and red (right arm) respectively. (B) Western blot of WT HeLa cells and of three independent VAP DKO HeLa cell lines. (C) HPLC analysis of cell extracts showing an increased ratio of PI4P versus total inositol phospholipids in VAP DKO cells relative to WT cells. n = 3 independent experiments. Data are represented as mean ± SEM. WT versus DKO-1, ***p = 0.007; WT versus DKO-2, ****p < 0.0001. (D–G) Confocal images of WT and VAP DKO cells expressing four different PI4P probes: N-PHORP5-GFP (D) and GFP-2xPHOSH2 (E), which label selectively PI4P at the plasma membrane, GFP-P4CSidC (F), which labels PI4P both at the plasma membrane and on internal membranes, and GFP-PHOSBP (G), which labels intracellular PI4P pools. Note the increase of PI4P on vesicular compartments, but no obvious PI4P accumulation at the plasma membrane in VAP DKO cells. Scale bar, 10 μm. (H and I) Confocal images of VAP DKO cells co-expressing the PI4P probe GFP-PHOSBP and the endosome markers mCh-Rab7 and Rab5-mRFP, revealing the presence of PI4P on endosomes (H). Scale bar, 2 μm. Graph of Pearson's correlation coefficient shows greater colocalization of GFP-PHOSBP with mCh-Rab7 and Rab5-mRFP in VAP DKO cells (I) (n = 20 cells, two-tailed t test). (J and K) Time-lapse confocal images of WT and VAP DKO cells co-transfected the PI(4,5)P2 probe iRFP-PHPLCd1 and the muscarinic receptor M1R. Oxo-M (20 μM) was added to cells at time 0 and the M1R antagonist atropine (50 μM) after 10 min. DKO cells show ectopic accumulation of PI(4,5)P2 on intracellular vesicles. The region of the DKO cell indicated by a dashed box in (J) is shown at high magnification in (K). Scale bar, 10 μm. See also Movie S1. (L–O) High-magnification time-lapse images of VAP DKO cells co-transfected with M1R and the indicated plasmids, showing the appearance of PI(4,5)P2 in the PI4P-rich Golgi complex (L) and on a subset of PI4P-positive vesicles (M) in response to Oxo-M stimulation. PIP5K1γ87 also accumulates in the Golgi complex (N) and on a subset of intracellular vesicles (O) as they become PI(4,5)P2 positive. Scale bar, 5 μm. See also Figure S1.
Figure 2
Figure 2. Loss of OSBP and Sac1 Results in Increased PI4P Abundance on Endosomes
(A) Immunofluorescence revealing enhanced localization of endogenous OSBP on intracellular vesicles in VAP DKO cells (red arrowheads) and rescue of this change by exogenously expressed WT VAPB. Scale bar, 10 μm. (B) Western blot of WT HeLa cells transfected with the indicated siRNAs showing depletion of OSBP protein in OSBP siRNA transfected cells. (C–G) Confocal images of WT cells transfected with control or OSBP siRNA and expressing three distinct PI4P probes: GFP-PHOSBP (D), which label selectively internal PI4P pools, GFP-P4CSidC (E), which label both internal and plasma membrane PI4P pools, and N-PHORP8L-GFP (F), a low-affinity “sensor” of plasma membrane PI4P that remains primarily in the cytosol/nucleus under control conditions. In OSBP siRNA-treated cells, GFP-P4CSidC (E) and GFP-PHOSBP (D) accumulate in vesicular compartments. No increase of PI4P in the plasma membrane is detected by any of these probes. Scale bar, 10 μm. (C and G) Quantifications of the vesicular fluorescence of GFP-PHOSBP and of the plasma membrane/cytosol N-PHORP8L-GFP fluorescence ratio based on line scans as exemplified in (F) (n = 20 cells for cells treated with control or OSBP siRNAs, two-tailed t test). (H) Western blot of WT cells transfected with CRISPR/Cas9s constructs as indicated, showing the depletion of Sac1 protein in Sac1 CRISPR/Cas9 transfected cells. (I–M) Confocal images of WT HeLa cells transfected with control or Sac1 CRISPR/Cas9 and expressing the same three distinct PI4P probes used for fields (D–F). In Sac1 CRISPR/Cas9-treated cells, GFP-PHOSBP (J) and GFP-P4CSidC (K) show a robust labeling of vesicles, and N-PHORP8L-GFP redistributes from the cytosol/nucleus to the plasma membrane (L), signaling a major increase of PI4P in all these membranes. Scale bar, 10 μm. (I and M) Quantifications of the vesicular fluorescence of GFP-PHOSBP and of the plasma membrane/cytosol N-PHORP8L-GFP fluorescence ratio based on line scans (n = 20 cells for each genotype in I, two-tailed t test). See also Figure S2.
Figure 3
Figure 3. Defects in Endosomes-to-Golgi Traffic in VAP DKO Cells
(A) TGN46 and GRASP55 immunofluorescence showing the Golgi localization of TGN46 in WT cells and its scattered distribution in the cytoplasm of VAP DKO cells. Scale bar, 10 μm. The graph at right shows the ratio of the punctate TGN46 fluorescence throughout the cytoplasm excluding the Golgi region, versus the TGN46 fluorescence within the Golgi region (n = 19 cells for each genotype, two-tailed t test). (B and C) Close apposition of TGN46 and endosomal markers (EEA1 and VPS35) in DKO cells. Scale bar, 5 μm. Graphs of the Pearson's correlation coefficient shows greater colocalization of TGN46 with EEA1 and VPS35 in VAP DKO cells than in WT (n = 22 cells for each genotype in B, n = 15 cells for WT and 17 cells for VAP DKO in C, two-tailed t test). (D–E) Snapshots from live confocal imaging of VAP DKO cells showing juxtaposition of the trans-Golgi marker ST-mRFP with Rab7-EGFP (D) and Rab5-EGFP (E) positive endosomes (the mRFP and EGFP signals, which are acquired sequentially, are slightly shifted due to the high motility of the organelles). The retromer subunit VPS29-mCh colocalizes with scattered vesicles that are positive for the trans-Golgi marker GalT-EGFP (F), but shows no overlap with the cis/medial-Golgi GFPGOLPH3 that remains concentrated in the Golgi (G). Scale bar, 10 μm. (H–J) (H) Immunofluorescence of internalized (1 hr) anti-CI-MPR antibody (pseudo colored). The internalized antibody is enriched in the perinuclear region corresponding to the TGN in WT cells, but remains disperse in peripheral puncta in VAP DKO cells (note those outside the squares). Scale bar, 10 μm. (I) Western blots of WT and VAP DKO cells revealing no major change of CI-MPR expression levels. (J) Ratio between the punctate fluorescence outside and inside squares (10 × 10 μm2) centered on the Golgi complex area (see dashed squares) (n = 55 for WT and 57 for DKO cells, two-tailed t test). See also Figure S3.
Figure 4
Figure 4. Endosome-ER Tethering via an SNX2-VAPB Interaction
(A) Confocal images of COS-7 cells expressing mCh-VAPB alone, or co-expressing YFP-SNX2 and mCh-VAPB, showing the enrichment of mCh-VAP at YFPSNX2-positive endosomes. Scale bar, 10 μm. (B) Confocal images of a COS-7 cell co-expressing YFP-SNX2 and mCh-VAPB upon treatment with the VPS34 inhibitor VPS34-IN1 (1 μM). The dissociation of YFP-SNX2 from endosomes correlates with the dispersal of mCh-VAPB throughout the ER. Quantification is shown at right. Scale bar, 5 μm. See also Movie S2. (C and D) Confocal images and line scan analysis of COS-7 cells overexpressing YFP-SNX1 and mCh-VAPB (C), or YFP-SNX2 and mCh-VAPB (D), showing that mCh-VAPB coclusters selectively with YFP-SNX2 but not with YFP-SNX1. Scale bar, 5 μm. (E) Extracts of HeLa cells transfected with the constructs indicated were subjected to anti-GFP immunoprecipitation (IP) and then processed for SDS-PAGE and immunoblotting (IB) with anti-Myc or anti-HA antibodies. (F and G) Confocal images and line scan analysis of COS-7 cells co-expressing YFP-SNX2 and either the FFAT motif-binding-deficient mutant mCh-VAPBKMDD (double mutant K87D M89D) (F), or the ALS8 mutant mCh-VAPBP56S (G), showing that mCherry fluorescence remains diffuse throughout the ER tubular network and does not cocluster with YFP-SNX2. Scale bar, 5 μm. (H) Top: SNX2 domain structure. Note the presence of sequences containing phenylalanine residues and acidic amino acids. Bottom: extract of HeLa cells transfected with myc-VAPBWT and WT or mutant YFP-SNX2 were subjected to anti-GFP immunoprecipitation (IP) and then processed for SDS-PAGE and immunoblotting (IB) with anti-GFP and anti-Myc antibodies. (I and J) Confocal images and line scan analysis of COS-7 cells co-expressing mCh-VAPB and either YFP-tagged N-terminal fragment of SNX2 (YFP-SNX21–139) (I), or YFP-SNX2F28A (J). YFP-SNX21–139, which lacks the endosome binding sites but contains the FFAT-like motif, colocalizes with VAPB throughout the ER. YFP-SNX2F28A localizes to endosomes but fails to cocluster with VAPB. Scale bar, 5 μm. (K) Confocal images of COS-7 cells showing that OSBP-EGFP has a predominant diffuse localization when overexpressed alone, is recruited to the ER membrane when co-overexpressed with mCh-VAPB, and is also co-enriched with mCh-VAPB at iRFP-SNX2-positive hotspots when coexpressed with both these proteins. Scale bar, 5 μm. See also Figure S4.
Figure 5
Figure 5. Drastic Perturbation of Actin Organization in VAP DKO Cells
(A and B) Phalloidin staining of WT and VAP DKO cells showing loss of stress fiber and accumulation of actin comets in DKO cells. Insets: high magnification of the regions enclosed by dashed boxes. Scale bar, 10 μm. (C and D) Confocal images of DKO cells showing presence of a trans-Golgi marker GalT-EGFP (C), but not of a cis/medial-Golgi protein EGFP-GOLPH3 (D), at the tips of actin comets visualized by CHUtrophin-mCh. Insets show actin comets at high magnification. Scale bar, 10 μm. (E) Colocalization of Arp2/3 (p34-Arc subunit) immunofluorescence and phalloidin staining in VAP DKO cells. Scale bar, 10 μm. (F) Confocal images of DKO cells showing presence of endosomal Rabs (Rab5-EGFP; Rab7-EGFP), retromer subunits (YFP-VPS29 and YFP-SNX2), the retromer cargo GFP-CD-M6PR and trans-Golgi markers (TGN46-GFP, GalT-EGFP) at the tips of actin tails visualized by CHUtrophin-mCh. Scale bar, 2 μm. Numbers below the micrographs indicate the percentage of actin tails propelling the indicated protein (n = 200 from ten cells for Rab5, n = 131 from eight cells for Rab7, n = 99 from six cells for VPS29, n = 109 from ten cells for CD-M6PR, n = 82 from five cells for TGN46, n = 64 from four cells for GalT). See also Figure S5 and Movie S3.
Figure 6
Figure 6. Actin Comets in VAP DKO Cells Are Nucleated by WASH
(A and B) WASH (A) and FAM21 (B) immunofluorescence at tips of actin tails visualized by phalloidin staining in VAP DKO cells. Scale bar, 10 μm. (C) Live confocal images of a VAP DKO cell expressing YFP-FAM21 and the actin marker CHUTR-mCh. Insets show at high magnification a time series of an actin comet tail propelling a FAM21-positive vesicle. Scale bar, 10 μm. See also Movie S4. (D) Enhanced abundance of WASH on EEA1-posotivie endosomes in DKO cells (as quantified at right, n = 20 cells for each genotype, two-tailed t test). Scale bar, 10 μm. Merged images of high magnification views of individual endosomes are shown at right. (E) Confocal image (high-magnification gallery at right) of a VAP DKO cell showing apposition of EGFP-WASH and of the trans-Golgi marker ST-mRFP. Scale bar, 10 μm. (F) Western blot proving KD of WASH and FAM21. Note that FAM21 KD results in a concomitant loss of WASH. (G–I) Phalloidin staining and immunofluorescence of DKO cells transfected with the indicated siRNAs, showing that loss of WASH (G) and FAM21 fluorescence (H) correlates with the loss of actin foci (comets) on endosomes. Scale bar, 10 μm. The normalized phalloidin fluorescence on EEA1-positive areas is quantified in (I). (J) WASH immunofluorescence and phalloidin staining of WT and DKO cells treated with the VPS34 inhibitor VPS34-IN1 (1 μM) or solvent control (DMSO). VPS34-IN1 induces an increase of WASH and actin at the endosomal surface of both WT and DKO cells. Scale bar, 10 μm. (K) Confocal image of VAP DKO cells expressing actin probe Ruby-LifeAct treated with VPS34 inhibitor VPS34-IN1 (1 μM) for 1 hr, showing dramatically exaggerated actin tails propelling strikingly enlarged endosomes. Scale bar, 10 μm. See also Figure S6 and Movie S5.
Figure 7
Figure 7. A Protein Network Involving Type II PI 4-Kinases and the VAP Interactors OSBP and SNX2 Is Implicated in WASH-Dependent Actin Comets Formation
(A and B) Increased abundance of assembled actin (phalloidin) and WASH immunofluorescence on intracellular organelles in OSBP KD cells (A). Scale bar, 10 μm. Normalized fluorescence intensity of WASH and phalloidin on the region occupied by EEA1-positive endosomes (see Figure S7G) is quantified in (B) (n = 20 cells for either control or OSBP siRNAs, two-tailed t test). (C) WASH and FAM21 immunofluorescence at the tips of actin tails visualized by phalloidin staining in OSBP siRNA-treated cells. Scale bar, 2 μm. See also Movie S6. (D) Live confocal images of OSBP siRNA-treated cells showing presence of endosomal Rabs (Rab5-EGFP; Rab7-EGFP), retromer subunits (YFP-VPS29), and a trans-Golgi marker (GalT-EGFP) at the tips of actin tails visualized by CHUTR-mCh. Scale bar, 2 μm. Numbers below each image indicate the percentage of actin tails propelling the indicated proteins (n = 115 from seven cells for Rab5, n = 93 from five cells for Rab7, n = 99 from five cells for VPS29, n = 110 from eight cells for GalT). (E) Immunofluorescence of WASH and phalloidin staining in WT cells transfected with OSBP and WASH siRNA, showing that loss of WASH fluorescence correlates with the loss of actin foci. Scale bar, 10 μm. (F and G) (F) Increased abundance of assembled actin (phalloidin) and WASH immunofluorescence on intracellular organelles in SNX2 knockdown cells. Scale bar, 10 μm. Normalized fluorescence intensity of WASH and phalloidin on the region occupied by EEA1-positive endosomes (see Figure S7H) is quantified in (G) (n = 20 cells for either control or SNX2 siRNAs, two-tailed t test). (H) WASH (left) and FAM21 (right) immunofluorescence at the tips of actin tails visualized by phalloidin staining in SNX2 siRNA-treated cells. Scale bar, 2 μm. (I) Live confocal images of SNX2 siRNA-treated cells showing presence of endosomal Rabs (Rab5-EGFP; Rab7-EGFP), retromer subunits (YFP-VPS29), and trans-Golgi markers (GalT-EGFP) at the tips of actin comets visualized by CHUTR-mCh. Scale bar, 2 μm. The percentage of actin tails whose tips are positive for the indicated proteins is shown under each image (n = 101 from six cells for Rab5, n = 114 from six cells for Rab7, n = 97 from five cells for VPS29, n = 116 from seven cells for GalT). (J) Western blotting confirming the knockdown of SNX2 in WT cells. (K) Live confocal images showing presence of the PI4P probe GFP-P4CSidC, GFP-PI4KIIα, and GFP-PI4KIIb at the tips of actin tails in VAP DKO cells. Scale bar, 2 μm. See also Movie S7. (L and M) Loss of assembled actin (phalloidin) and WASH immunofluorescence on intracellular organelles in VAP DKO cells upon PI4KIIs knockdown (L). Scale bar, 10 μm. Normalized fluorescence intensity of WASH and phalloidin on the region occupied by EEA1-positive endosomes (see Figure S7I) is quantified in (M) (n = 25 cells for either control or PI4KIIs siRNAs, two-tailed t test). (N–P) Loss of PI4P on endosomal vesicles in PI4KIIs knockdown cells, as examined by two distinct PI4P probes, GFP-PHOSBP and GFP-P4CSidC (N). Western blotting confirms the knockdown of PI4KIIα and PI4KIIβ in DKO cells (O). Quantification of the normalized fluorescence of GFP-P4CSidC is shown in (P) (WT n = 36 cells; DKO n = 40 cells for control siRNA, and n = 50 for PI4KIIs siRNA, two-tailed t test). (Q) Schematic illustration of ER contacts that regulate WASH-dependent actin nucleation on endosomes and retromer-dependent budding by regulating PI4P. A pool of PI4P is synthesized on endosomes by type II PI4Ks. VAP, an ER protein that forms dimers and oligomers, contributes to ER-endosome tethers via its binding to the retromer subunit SNX2 and to OSBP, which binds PI4P on the endosomal membrane via its PH domain. OSBP, via its ORD domain, makes PI4P accessible to the ER-anchored inositol 4-phosphatase Sac1. In WT cells, a transient accumulation of PI4P on endosomes is coupled to a transient burst of WASH-dependent actin nucleation to facilitate retromer function. In cells that lack VAP, loss of PI4P downregulation results in excessive and persistent PI4P accumulation and actin nucleation on endosomes and in disruption of retromer-dependent budding.

References

    1. Alpy F, Rousseau A, Schwab Y, Legueux F, Stoll I, Wendling C, Spiegelhalter C, Kessler P, Mathelin C, Rio M-C, et al. STARD3 or STARD3NL and VAP form a novel molecular tether between late endosomes and the ER. J. Cell Sci. 2013;126:5500–5512. - PubMed
    1. Bago R, Malik N, Munson MJ, Prescott AR, Davies P, Sommer E, Shpiro N, Ward R, Cross D, Ganley IG, Alessi DR. Characterization of VPS34-IN1, a selective inhibitor of Vps34, reveals that the phosphatidylinositol 3-phosphate-binding SGK3 protein kinase is a downstream target of class III phosphoinositide 3-kinase. Biochem. J. 2014;463:413–427. - PMC - PubMed
    1. Balla A, Tuymetova G, Barshishat M, Geiszt M, Balla T. Characterization of type II phosphatidylinositol 4-kinase isoforms reveals association of the enzymes with endosomal vesicular compartments. J. Biol. Chem. 2002;277:20041–20050. - PubMed
    1. Bojjireddy N, Botyanszki J, Hammond G, Creech D, Peterson R, Kemp DC, Snead M, Brown R, Morrison A, Wilson S, et al. Pharmacological and genetic targeting of the PI4KA enzyme reveals its important role in maintaining plasma membrane phosphatidylinositol 4-phosphate and phosphatidylinositol 4,5-bisphosphate levels. J. Biol. Chem. 2014;289:6120–6132. - PMC - PubMed
    1. Bonifacino JS, Rojas R. Retrograde transport from endosomes to the trans-Golgi network. Nat. Rev. Mol. Cell Biol. 2006;7:568–579. - PubMed

Publication types

MeSH terms