. 2017 Jan;11(1):138-151.
doi: 10.1038/ismej.2016.99. Epub 2016 Jul 15.

Metagenomic covariation along densely sampled environmental gradients in the Red Sea

Affiliations

Metagenomic covariation along densely sampled environmental gradients in the Red Sea

Luke R Thompson et al. ISME J. 2017 Jan.

Abstract

Oceanic microbial diversity covaries with physicochemical parameters. Temperature, for example, explains approximately half of global variation in surface taxonomic abundance. It is unknown, however, whether covariation patterns hold over narrower parameter gradients and spatial scales, and extending to mesopelagic depths. We collected and sequenced 45 epipelagic and mesopelagic microbial metagenomes on a meridional transect through the eastern Red Sea. We asked which environmental parameters explain the most variation in relative abundances of taxonomic groups, gene ortholog groups, and pathways-at a spatial scale of <2000 km, along narrow but well-defined latitudinal and depth-dependent gradients. We also asked how microbes are adapted to gradients and extremes in irradiance, temperature, salinity, and nutrients, examining the responses of individual gene ortholog groups to these parameters. Functional and taxonomic metrics were equally well explained (75-79%) by environmental parameters. However, only functional and not taxonomic covariation patterns were conserved when comparing with an intruding water mass with different physicochemical properties. Temperature explained the most variation in each metric, followed by nitrate, chlorophyll, phosphate, and salinity. That nitrate explained more variation than phosphate suggested nitrogen limitation, consistent with low surface N:P ratios. Covariation of gene ortholog groups with environmental parameters revealed patterns of functional adaptation to the challenging Red Sea environment: high irradiance, temperature, salinity, and low nutrients. Nutrient-acquisition gene ortholog groups were anti-correlated with concentrations of their respective nutrient species, recapturing trends previously observed across much larger distances and environmental gradients. This dataset of metagenomic covariation along densely sampled environmental gradients includes online data exploration supplements, serving as a community resource for marine microbial ecology.


Conflict of interest statement

The authors declare no conflict of interest.

Figures

Figure 1
Figure 1
Covariation of gene ortholog group abundance and environmental parameters in the water column. (a) 3D contour map of the Red Sea, with outlines (isobaths) showing boundaries of the Red Sea at sampling depths, and samples colored by phosphate concentration (outer circle) and relative abundance of gene ortholog group (KO) for phosphate ABC transporter pstS (inner circle). (b) Scatter plot of KO relative abundance versus phosphate concentration. Samples taken within the foreign water mass GAIW are indicated. KO relative abundance is given in units of counts per million of total KO counts in each sample (that is, all KOs sum to 1 million in each sample).
Figure 2
Figure 2
Pearson correlations between environmental parameters shown as a colored covariance matrix. A Pearson's r value of 1 (red) indicates a total positive correlation, a value of −1 (blue) indicates a total negative correlation, and a value of 0 (white) indicates no correlation.
Figure 3
Figure 3
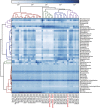
Relative abundance of genera across metagenomes displayed as a hierarchically-clustered heatmap, with clustering of samples by Bray–Curtis distance (top dendrogram) and clustering of taxa by correlation between samples (left dendrogram), with branch colors indicating major clusters. GAIW sample labels are colored red. The top 50 most abundant genera are shown. Relative abundances of all 683 genera detected for each sample sum to 100. Genus-level taxonomy was calculated based on k-mer frequency in comparison with the NCBI RefSeq database (see Materials and methods section).
Figure 4
Figure 4
Covariation of select KOs with environmental parameters. KO relative abundance is given in units of counts per million of total KO counts in each sample (that is, all KOs sum to 1 million in each sample).
Figure 5
Figure 5
Maximization of linear relations between environmental parameters and metagenomic response variables using a distance-based multivariate linear model and distance-based redundancy analysis for (a) the whole dataset and (b) genera Prochlorococcus and Pelagibacter (see Materials and methods section). Percent variation explained by each parameter is shown as a bar graph. The optimal model using AICc to balance performance and parsimony is shown for both (a) and (b); also shown for (a) is the remainder of variation explained by other environmental parameters unused in the optimal model. The distance-based redundancy analysis ordination of the optimal model is shown along distance-based redundancy analysis axes 1 and 2, with stations colored by depth and water mass (GAIW in black).
Figure 6
Figure 6
Canonical correspondence analysis of KO relative abundance with environmental parameters. Samples are shown as black numerals indicating depth in meters (GAIW samples marked with asterisk), environmental parameters as dark blue arrows, and KOs colored by the KEGG pathway. For clarity, only KOs were displayed that were found in all samples, with a total count of at least one per thousand counts over all samples, and variance in the top 10% (see Materials and methods section). The large arrow indicates the trend of sample position from surface (epipelagic), to deep chlorophyll maximum, to deep (mesopelagic).

References

    1. Abubucker SS, Segata NN, Goll JJ, Schubert AAM, Izard JJ, Cantarel BBL et al. (2012). Metabolic reconstruction for metagenomic data and its application to the human microbiome. PLoS Comput Biol 8: e1002358–e1002358. - PMC - PubMed
    1. Anderson MJ. (2001). A new method for non-parametric multivariate analysis of variance. Austral Ecol 26: 32–46.
    1. Anderson MJ, Gorley RN, Clarke KR. (2008) PERMANOVA+ for PRIMER: Guide to Software and Statistical Methods. PRIMER-E Ltd: Plymouth, UK.
    1. Barberán A, Fernández-Guerra A, Bohannan MBJ, Casamayor EO. (2012). Exploration of community traits as ecological markers in microbial metagenomes. Mol Ecol 21: 1909–1917. - PubMed
    1. Churchill JH, Bower AS, McCorkle DC, Abualnaja Y. (2014). The transport of nutrient-rich Indian ocean water through the Red Sea and into coastal reef systems. J Mar Res 72: 165–181.