Review
. 2016 Jul 11:18:387-412.
doi: 10.1146/annurev-bioeng-112415-114722.

Emerging Themes in Image Informatics and Molecular Analysis for Digital Pathology

Affiliations
Review

Emerging Themes in Image Informatics and Molecular Analysis for Digital Pathology

Rohit Bhargava et al. Annu Rev Biomed Eng. .

Abstract

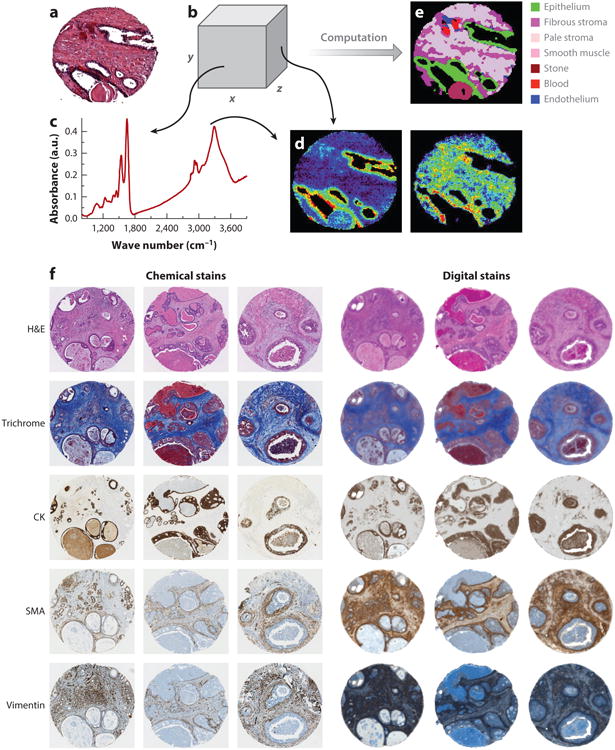
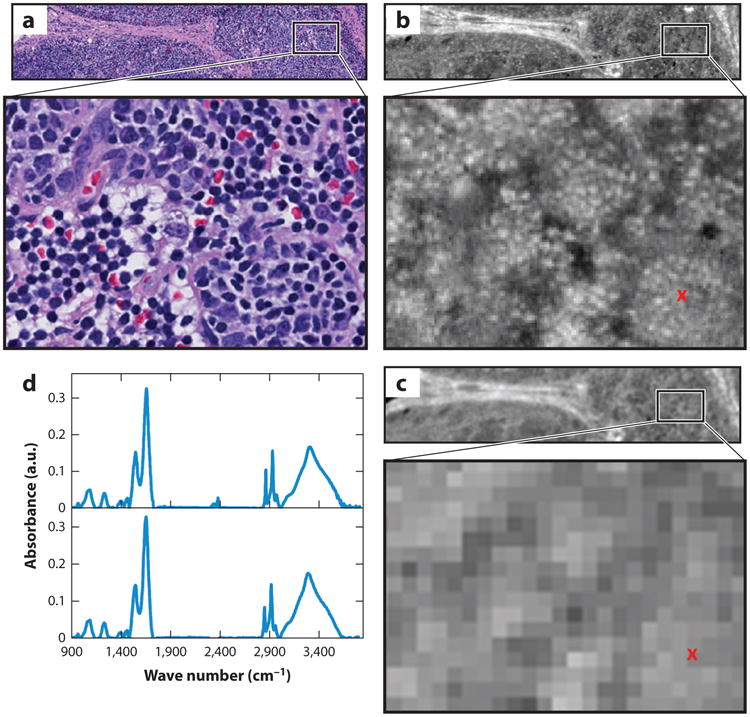
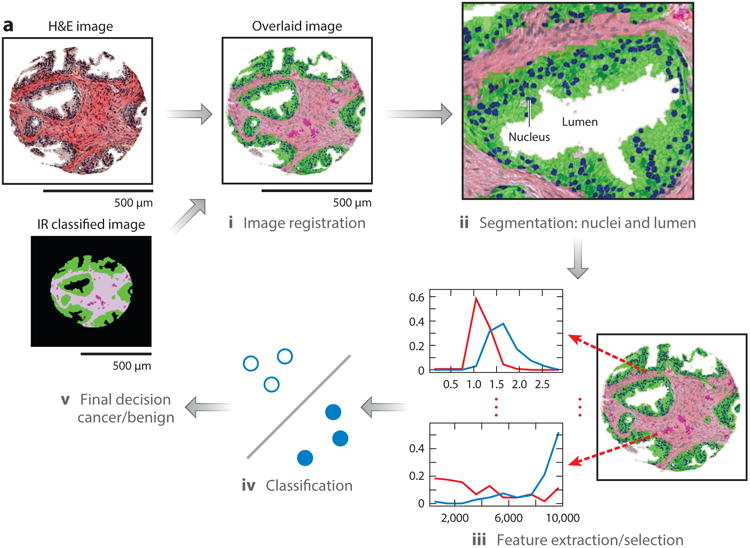
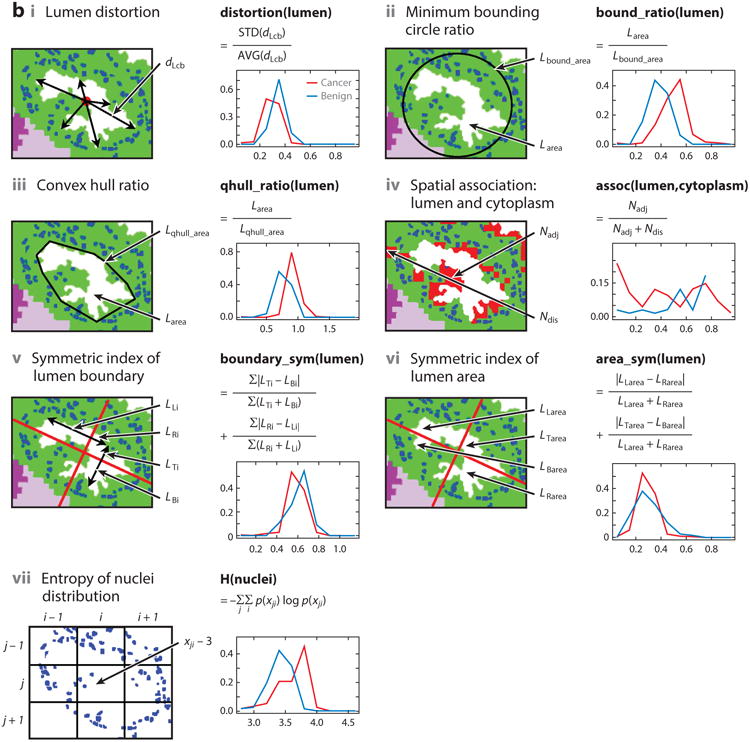
Pathology is essential for research in disease and development, as well as for clinical decision making. For more than 100 years, pathology practice has involved analyzing images of stained, thin tissue sections by a trained human using an optical microscope. Technological advances are now driving major changes in this paradigm toward digital pathology (DP). The digital transformation of pathology goes beyond recording, archiving, and retrieving images, providing new computational tools to inform better decision making for precision medicine. First, we discuss some emerging innovations in both computational image analytics and imaging instrumentation in DP. Second, we discuss molecular contrast in pathology. Molecular DP has traditionally been an extension of pathology with molecularly specific dyes. Label-free, spectroscopic images are rapidly emerging as another important information source, and we describe the benefits and potential of this evolution. Third, we describe multimodal DP, which is enabled by computational algorithms and combines the best characteristics of structural and molecular pathology. Finally, we provide examples of application areas in telepathology, education, and precision medicine. We conclude by discussing challenges and emerging opportunities in this area.

Keywords: FT-IR spectroscopy; algorithms; chemical imaging; computational; diagnosis; digital pathology; infrared spectroscopic imaging; microenvironment; outcome; precision medicine; prognosis; stainless staining.


Figures

Figure 1
Figure 1
(Top) Probabilistic output of a deep learnin classifier for regions of invasion. (Bottom) Corresponding hematoxylin and eosin images with a pathologist's markup of the extent of cancer extent. Note the concordance between the two rows.
Figure 2
Figure 2
(a) Prostate cancer tumor region. The region of interest (ROI) is outlined in blue. (b) Cluster graphs establish localized gland networks. (c) Delaunay triangulation reveals a global graph which traverses stromal and epithelial boundaries, whereas co-occurring gland tensors compute localized features from the gland networks. (d) The ROI from panel a. The color map of the gland orientations (0°, 180°) demonstrates the variation in local gland orientation. Gland orientations are architecturally differently arranged in tissue from patients with and without disease recurrence (58).
Figure 3
Figure 3
A digital stain. A routine hematoxylin and eosin tissue image (left) can be converted into a histomorphometric representation comprising nuclear architecture (middle) and textural measurements (right).
Figure 4
Figure 4
Nuclear architecture features can be extracted within the stromal and epithelial compartments within hematoxylin and eosin tissue sections. The combination of stromal and epithelial nuclear architecture features, referred to as a SpaCCl graph, enables improved prediction of which p16+ oropharyngeal cancers will and will not progress. Abbreviation: TMA, tissue microarray.
Figure 5
Figure 5
(a) Conventional imaging in pathology requires dyes and a human to recognize cells. (b) In chemical imaging data, both (c) a spectrum at any pixel and the spatial distribution of any spectral feature can be observed, as in (d, left) nucleic acids (at ∼1,080 cm−1) and (right) collagen (at ∼1,245 cm−1). (e) Computational tools can then translate the chemical imaging data into knowledge used in pathology. (f) In addition to the color-coded image in panel e, molecular imaging (left) can be reproduced by chemical imaging (right). Abbreviations: CK, cytokeratin; H&E, hematoxylin and eosin; SMA, smooth muscle α-actin.
Figure 6
Figure 6
Comparison of hematoxylin and eosin (H&E)-stained optical microscopy and infrared (IR) images of lymph node tissue. (a) An H&E-stained image from a healthy submandibular lymph node biopsy. (b) A high-definition IR image of a serial section of the lymphoid tissue. (c) The same region imaged with a lower-resolution Fourier transform IR (FT-IR) imaging spectrometer. The IR images show the absorbance at 3,075 cm−1 after baseline correction. (d) Sample spectra plotted from the pixel marked with a red x in panel c. There is a slight discordance between the H&E and IR images because they are on different tissue sections.
Figure 7
Figure 7
(a) Overview of a multimodal digital pathology system. (i) A Fourier transform infrared (FT-IR) spectroscopy data–based cell type classification (IR classified image) is overlain on a hematoxylin & eosin (H&E)-stained image, leading to (ii) segmentation of nuclei and lumens in a tissue sample. (iii) Features are extracted and selected, then (iv) used by the classifier to (v) predict whether the sample is cancerous or benign. (b) Example features. Each panel shows one feature, along with the distributions of the feature's values for cancer (red) and benign (blue) classes. (c) IR and H&E images can be overlaid with our an automated alignment algorithm, and the features allow better classification of cancer than does H&E staining alone. Abbreviations: AUC, area under the curve; AVG, average; STD, standard deviation.
Figure 7
Figure 7
(a) Overview of a multimodal digital pathology system. (i) A Fourier transform infrared (FT-IR) spectroscopy data–based cell type classification (IR classified image) is overlain on a hematoxylin & eosin (H&E)-stained image, leading to (ii) segmentation of nuclei and lumens in a tissue sample. (iii) Features are extracted and selected, then (iv) used by the classifier to (v) predict whether the sample is cancerous or benign. (b) Example features. Each panel shows one feature, along with the distributions of the feature's values for cancer (red) and benign (blue) classes. (c) IR and H&E images can be overlaid with our an automated alignment algorithm, and the features allow better classification of cancer than does H&E staining alone. Abbreviations: AUC, area under the curve; AVG, average; STD, standard deviation.
Figure 8
Figure 8
Combination of histomorphometric and histochemical features is more predictive of biochemical recurrence (BCR) in prostate cancer patients than either modality alone. Data are from 69 patients. Nuclei were first automatically detected in (a) Feulgen and (b) hematoxylin and eosin (H&E) images. (cf) Kaplan–Meier curves for (c) Gleason staining, (d) the top 10 features from H&E staining, (e) a combination of H&E and Feulgen staining, and (f) a combination of Gleason-, Feulgen-, and H&E-derived image markers. Abbreviation: NR, no recurrence.
Figure 9
Figure 9
(Top, table) Odds ratios (ORs) of recurrence in prostate cancer shows that the infrared (IR) score is better than the clinical standards, the Kattan nomogram and the Cancer of the Prostate Risk Assessment, postsurgical (CAPRA-S) score. (a–f) The power of the IR score comes from chemical changes in the tumor microenvironment, as shown for six cases. The three most important changes are labeled.

References

    1. Ghaznavi F, Evans A, Madabhushi A, Feldman M. Digital imaging in pathology: whole-slide imaging and beyond. Annu Rev Pathol Mech Dis. 2013;8:331–59. - PubMed
    1. Madabhushi A. Digital pathology image analysis: opportunities and challenges. Imaging Med. 2009;1:7–10. - PMC - PubMed
    1. Pantanowitz L, Sinard JH, Henricks WH, Fatheree LA, Carter AB, et al. Validating whole slide imaging for diagnostic purposes in pathology: guideline from the College of American Pathologists Pathology and Laboratory Quality Center. Arch Pathol Lab Med. 2013;137:1710–22. - PMC - PubMed
    1. Snead DR, Tsang YW, Meskiri A, Kimani PK, Crossman R, et al. Validation of digital pathology imaging for primary histopathological diagnosis. Histopathology. 2015 doi: 10.1111/his.12879. In press. - DOI - PubMed
    1. Farahani N, Pantanowitz L. Overview of telepathology. Surg Pathol Clin. 2015;8:223–31. - PubMed

Publication types

MeSH terms

LinkOut - more resources