. 2016 Sep 29;128(13):1671-8.
doi: 10.1182/blood-2016-02-695312. Epub 2016 Jul 15.

Evolution of acute myelogenous leukemia stem cell properties after treatment and progression

Affiliations

Evolution of acute myelogenous leukemia stem cell properties after treatment and progression

Tzu-Chieh Ho et al. Blood. .

Abstract

Most cancers evolve over time as patients initially responsive to therapy acquire resistance to the same drugs at relapse. Cancer stem cells have been postulated to represent a therapy-refractory reservoir for relapse, but formal proof of this model is lacking. We prospectively characterized leukemia stem cell populations (LSCs) from a well-defined cohort of patients with acute myelogenous leukemia (AML) at diagnosis and relapse to assess the effect of the disease course on these critical populations. Leukemic samples were collected from patients with newly diagnosed AML before therapy and after relapse, and LSC frequency was assessed by limiting dilution analyses. LSC populations were identified using fluorescent-labeled cell sorting and transplantation into immunodeficient NOD/SCID/interleukin 2 receptor γ chain null mice. The surface antigen expression profiles of pretherapy and postrelapse LSCs were determined for published LSC markers. We demonstrate a 9- to 90-fold increase in LSC frequency between diagnosis and relapse. LSC activity at relapse was identified in populations of leukemic blasts that did not demonstrate this activity before treatment and relapse. In addition, we describe genetic instability and exceptional phenotypic changes that accompany the evolution of these new LSC populations. This study is the first to characterize the evolution of LSCs in vivo after chemotherapy, identifying a dramatic change in the physiology of primitive AML cells when the disease progresses. Taken together, these findings provide a new frame of reference by which to evaluate candidate AML therapies in which both disease control and the induction of more advanced forms of disease should be considered.


Figures

Figure 1
Figure 1
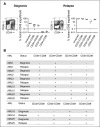
LSC populations from paired AML diagnosis and relapse samples. (A) Engraftment levels of sorted cells of 4 populations (CD34+CD38, CD34+CD38+, CD34CD38+, CD34CD38), as well as unsorted cells from a representative AML sample (AML3) at diagnosis and relapse. Each dot represents the human CD45+ engraftment level in BM of individual NSG mouse; a percentage greater than 0.1 is defined as leukemic engraftment. The horizontal line is the mean level of engraftment for each population. (B) Summary of the LSC activity in 7 sorted AML samples (as defined by CD34 and CD38 or CD32 and CD38) at diagnosis and relapse. The equivalent dose of mononuclear cells per mouse is from 5 × 10⁵ to 3 × 10⁶ cells for sorted populations. The summary of cell dose for primary xenotransplantation is in supplemental Table 3. Plus sign indicates LSC detected at this sensitivity; minus sign indicates no LSC detected at this sensitivity. *LSC activity detected using NOD-scid IL2Rgnull-3/GM/SF mice because of limited materials.
Figure 2
Figure 2
Expression profiles of LSC markers on paired AML diagnosis and relapse samples. (A) A representative example of LSC marker immunophenotyping strategy in AML bulk cells (AML3, diagnosis). The LSC panel included CD32, CD33, CD45RA, CD47, CD96, CD97, CD99, CD123, HLA-DR, IL1RAP, and TIM-3 (top). (B) Frequencies of LSC marker positive populations (CD123+ and TIM-3+) in bulk AML cells at diagnosis (middle) and relapse (right) compared with NBM cells (left) (NBM, n = 22-23; AML, n = 24-25). Mean ± standard error of the mean values are plotted. *P < .05; **P < .01; ***P < .001; ****P < .0001. NS, not significant.
Figure 3
Figure 3
Change of LSC markers on paired AML diagnosis and relapse samples. Change in frequencies of LSC marker-positive bulk AML populations in paired diagnosis and relapse samples (AML, n = 23-25). For comparisons of change in frequency, a fold change (FC) cutoff of 1.5 was used in this analysis. “Increase” denotes any patient with FC ≥ 1.5 at relapse than at diagnosis. “Decrease” denotes any patient with FC of ≤ 0.67 at relapse than at diagnosis. “No change” denotes a FC <1.5 to >0.67 from diagnosis to relapse (bottom).
Figure 4
Figure 4
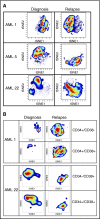
High-dimensional mass cytometry of diagnosis and relapse specimens. (A) The viSNE maps of diagnosis and relapse specimens, as defined by cell surface antigens. High-dimensional mass cytometry was performed on 3 cases (AML1, AML5, and AML22) at diagnosis and relapse, where functional LSC expansion was identified by LDA. viSNE analysis was employed to display the single cell data results, using data from 14 separate cell surface antigens with a Jensen-Shannon Divergence score for pairs AML1, 0.67531; AML5, 0.6808; and AML22, 0.67365. These data indicate the large measurable changes in cellular physiology between diagnosis and relapse for the total mononuclear cell population. (B) The viSNE maps of functionally defined LSC populations at diagnosis and relapse; specimens as defined by cell surface antigens.

References

    1. Rehe K, Wilson K, Bomken S, et al. Acute B lymphoblastic leukaemia-propagating cells are present at high frequency in diverse lymphoblast populations. EMBO Mol Med. 2013;5(1):38–51. - PMC - PubMed
    1. Quintana E, Shackleton M, Sabel MS, Fullen DR, Johnson TM, Morrison SJ. Efficient tumour formation by single human melanoma cells. Nature. 2008;456(7222):593–598. - PMC - PubMed
    1. Seita J, Weissman IL. Hematopoietic stem cell: self-renewal versus differentiation. Wiley Interdiscip Rev Syst Biol Med. 2010;2(6):640–653. - PMC - PubMed
    1. Lapidot T, Sirard C, Vormoor J, et al. A cell initiating human acute myeloid leukaemia after transplantation into SCID mice. Nature. 1994;367(6464):645–648. - PubMed
    1. Bonnet D, Dick JE. Human acute myeloid leukemia is organized as a hierarchy that originates from a primitive hematopoietic cell. Nat Med. 1997;3(7):730–737. - PubMed

Publication types

MeSH terms

Substances