. 2016 Jul 15;17(1):49.
doi: 10.1186/s12868-016-0284-5.

Col1a1+ perivascular cells in the brain are a source of retinoic acid following stroke

Affiliations

Col1a1+ perivascular cells in the brain are a source of retinoic acid following stroke

Kathleen K Kelly et al. BMC Neurosci. .

Abstract

Background: Perivascular stromal cells (PSCs) are a recently identified cell type that comprises a small percentage of the platelet derived growth factor receptor-β+ cells within the CNS perivascular space. PSCs are activated following injury to the brain or spinal cord, expand in number and contribute to fibrotic scar formation within the injury site. Beyond fibrosis, their high density in the lesion core makes them a potential significant source of signals that act on neural cells adjacent to the lesion site.

Results: Our developmental analysis of PSCs, defined by expression of Collagen1a1 in the maturing brain, revealed that PSCs first appear postnatally and may originate from the meninges. PSCs express many of the same markers as meningeal fibroblasts, including expression of the retinoic acid (RA) synthesis proteins Raldh1 and Raldh2. Using a focal brain ischemia injury model to induce PSC activation and expansion, we show a substantial increase in Raldh1+/Raldh2+ PSCs and Raldh1+ activated macrophages in the lesion core. We find that RA levels are significantly elevated in the ischemic hemisphere and induce signaling in astrocytes and neurons in the peri-infarct region.

Conclusions: This study highlights a dual role for activated, non-neural cells where PSCs deposit fibrotic ECM proteins and, along with macrophages, act as a potentially important source of RA, a potent signaling molecule that could influence recovery events in a neuroprotective fashion following brain injury.

Keywords: Brain fibrosis; Meninges; Pericyte; Perivascular stromal cell; Retinoic acid; Stroke.


Figures
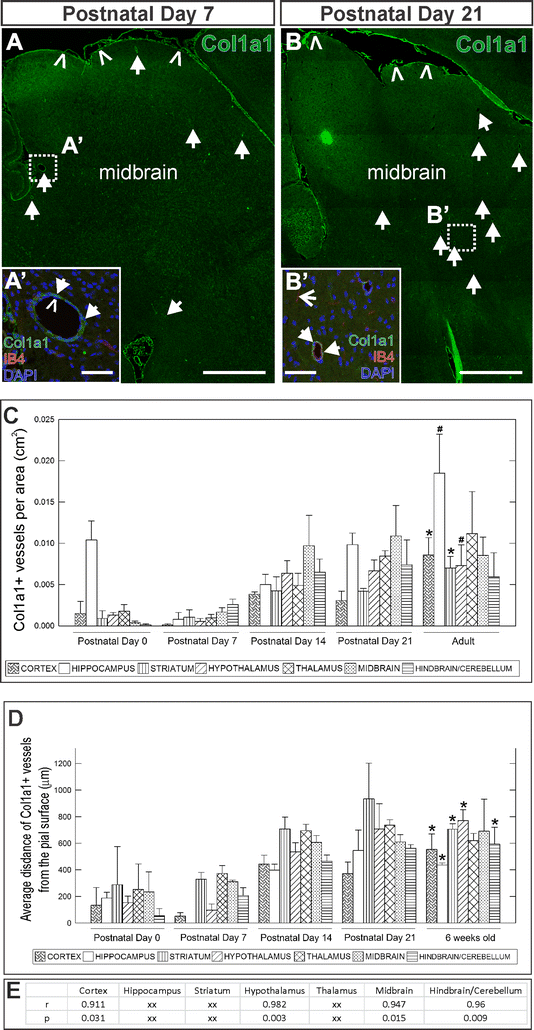
Fig. 1
Fig. 1
PSCs appear postnatally and increase in abundance and distance from meninges between P0 and adulthood. A, B Sagittal sections of P7 and P21 brain depicting Collagen-1a1 (Col1a1, green) PSCs (arrows) in the midbrain and in the meninges (carets). A′, B′ Higher magnification insets of large diameter, IB4+ vessels (caret indicates DAPI+ nuclei in the inner endothelium of the vessel) with Col1a1+ PSCs surrounding them (arrows). Open-arrow in B′ indicates small diameter IB4+ vessel, likely a capillary. C Graph depicting analysis of density of blood vessels with Col1a1+ PSCs for each brain area (cortex, hippocampus, striatum, hypothalamus, thalamus, midbrain and hindbrain/cerebellum) in P0, P7, P14, P21 and adult brain. Asterisks (*) mark significant differences between P0 and adult and # symbols mark significant differences between P7 and adult. D Graph depicting scoring for the average distance from the pial surface of Col1a1+ PSC associated vessels per brain region (cortex, hippocampus, striatum, hypothalamus, thalamus, midbrain and hindbrain/cerebellum). Significant differences between P0 and adult are marked (*). E Table of significant Pearson Correlation Coefficients (r) and associated p values (p) for PSC cell count and distance measurements shown in C and D. In C and D, 3 animals were scored at each time point with standard error bars. Scale bars 2 mm (A, B) and 50 µm (A′, B′)
Fig. 2
Fig. 2
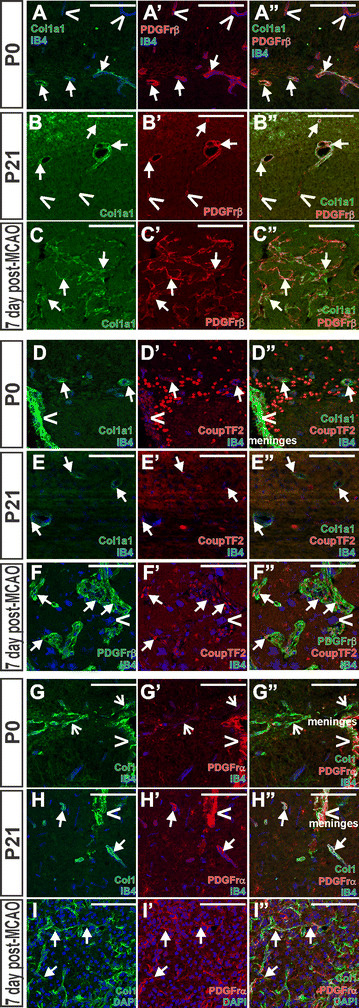
Expression of perictye and meningeal cell markers changes over maturation and post-injury activation of PSCs. Confocal images on sections from hippocampus (P0), thalamus or midbrain (P21) and cerebral cortex or striatum (MCAO) with antibodies that label pericytes and/or meningeal cells to characterize Col1a1+ PSC marker expression. Col1a1+ PSCs (green, A–C) express PDGFrβ (red, A–C) at P0 and P21 and in the post-MCAO lesion (arrows, A–C). At P0 and P21, PDGFrβ is also expressed by perivascular pericytes that do not have Col1a1 expression (carets, A, B). CoupTF2 (red, DF) is expressed by Col1a1+ (green, D, E) PSCs surrounding IB4+ blood vessels at P0 and P21 (arrows, D, E) and by PDGFβ+ PSCs (green, F) in the stroke lesion (arrows, F). Carets in D indicate CoupTF2 +/Col1a1+ cells in the meninges. IB4 in F also labels macrophages (blue, caret). PDGFrα is expressed in the meninges (red, carets, G, H), is weakly expressed by Col1+ PSCs at P0 (green, open-arrows, G) but is strongly expressed by these cells at P21 (arrows, H) and in the stroke lesion (arrows, I). IB4 (blue) labels blood vessels and microglia/macrophages in A, DH and DAPI (blue) marks nuclei in I. Scale bars 100 μm
Fig. 3
Fig. 3
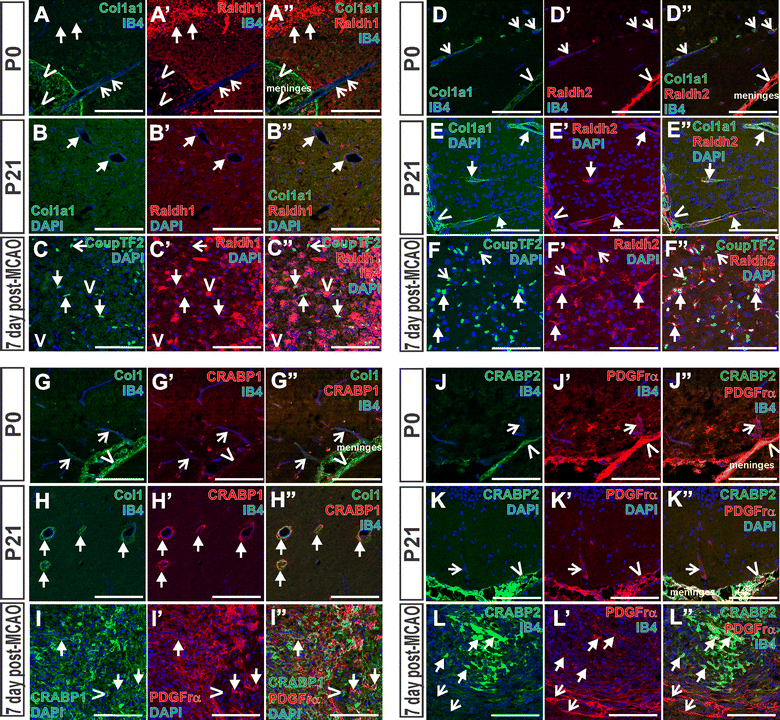
PSCs express RA pathway proteins. RA biosynthesis protein Raldh1 (red) is not expressed by Col1a1+ PSCs at P0 (green, open-arrows in A) but is expressed by some cells in the meninges (carets in A) and some neurons in the brain (arrows in A). At P21, Raldh1 (red, B) is expressed by Col1a1+ PSCs (green, B) surrounding blood vessels (arrows in B). In the stroke lesion, Raldh1 (red, C) is expressed in CoupTF2+ PSCs (green, arrows in C) and IB4+ macrophages (magenta, carets in C). Raldh2 (red, D, E) is expressed by Col1a1+ meningeal cells (green; carets in D, E), is only very weakly expressed by Col1a1+ PSCs surrounding IB4+ vessels at P0 (open-arrows, D), but Raldh2 signal is strong in Col1a1+ PSCs at P21 (arrows in E). Following stroke, Raldh2 (red, F) is expressed by CoupTF2+ PSCs (green, arrows in F). Some CoupTF2+ PSCs in the lesion do not express Raldh1 or Raldh2 (open-arrows in C, F). CRABP1 (red, G) is not expressed by Col1a1+ (green, G) meninges or PSCs at P0 (carets and open-arrows, respectively in G) though is expressed by Col1a1+ PSCs (green, H) surrounding IB4+ vessels at P21 (arrows in H). PDGFrα+ PSCs (red, I) in the stroke lesion express CRABP1 (green, arrows in I) though there are other CRABP1-expressing cells in the lesion (caret in I). CRABP2 (green, J, K) is expressed by PDGFrα meninges (red, carets in J, K) but not by PDGFrα+ PSCs (red open-arrows in J, K) at P0 or P21. CRABP2 (green, L) is expressed by some PDGFrα+ PSCs (red, arrows in L) in the stroke lesion. Open-arrows in L indicate PDGFrα+/CRABP2-negative cells. IB4 labels blood vessels and microglia/macrophages in A, C, D, G, H, J and L; DAPI (blue) marks nuclei in B, C, E, F, I, and K. Scale bars 100 μm
Fig. 4
Fig. 4
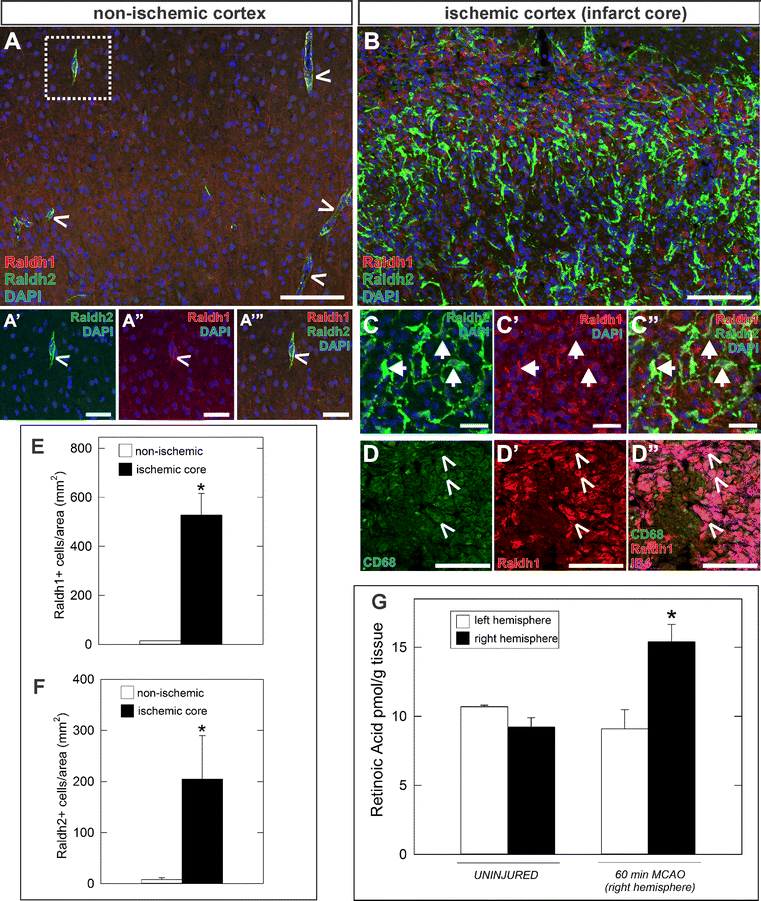
Elevated RA synthesis and signaling in the ischemic hemisphere. Compared to the uninjured hemisphere (A), the number of cells expressing RA synthesizing enzymes Raldh1 (red) and Raldh2 (green) increases dramatically 7 days following 60 min MCAO (B). Carets in A and A' insets mark Raldh1+/Raldh2+ PSCs around vessels in non-ischemic cortex. Arrows in C depict Raldh1+/Raldh2+ PSCs in the lesion. Carets in D indicate CD68+/IB4+ macrophages (green/magenta) express Raldh1 (red) in the lesion core. Graphs depicting quantification of cells expressing Raldh1 (E) and Raldh2 (F) in injured and un-injured hemispheres. Fast LC-MRM3 quantification of RA (G) from left and right hemispheres of uninjured and 60 min MCAO (right hemisphere) animals at 7 days post-injury. A minimum of 3 separate animals were analyzed (n ≥ 3) and error bars represent SEM. Asterisks indicate statistically significant difference (p < 0.05) from uninjured/non-ischemic hemisphere to ischemic hemisphere. DAPI marks nuclei in blue. Scale bars 20 µm (C), 50 µm (A′A‴), and 100 μm (A, B, D)
Fig. 5
Fig. 5
Assessment of in vivo RA signaling activity. Spatial RA activity assayed using RARE-hsp68-LacZ mouse 7 days post 60 min MCAO injury. Confocal, tile-scan image of β-galactosidase immunolabeling (β-gal, green, A) with IB4 (magenta, A) at the level of the lesion (outlined with dashed line). A′ and A″ indicate magnified images in A. Tile stitched confocal images of RA activity in non-ischemic hemispheres (β-gal, green, B, C) and ischemic (β-gal, green, DE) with markers for neurons (NeuN, red, carets, B, D), astrocytes (GFAP, red, carets, C, E). Insets are magnified areas with dotted lines in D and E. Graphs depict quantification of NeuN+/β-gal+ neurons (F) and GFAP+/β-gal+ astrocytes (G) from non-ischemic and ischemic hemispheres 7 days following a 60 min MCAO (n ≥ 3 and bars represent SEM). Asterisks indicate statistically significant difference (p < 0.05) from uninjured/non-ischemic hemisphere and the ischemic hemisphere. PDGFrα + PSCs (red) in the non-ischemic cortex did not co-localize with β-gal (arrows, H) though β-gal+ cells are present in the granule cell layer of the dentate gyrus (DG) (carets, H). β-gal+ processes (green, I) appear to contact PDGFrβ+ PSCs (red) in the lesion core (open-arrows in I and I′) but PDGFrβ+ PSCs do not appear to co-label with β-gal (caret, I). β-gal+/PDGFrβ-negative cell bodies are adjacent to PDGFrβ+ PSCs (arrows, I). DAPI marks nuclei in blue. Scale bars 2 mm (A), 200 μm (B–E, I), 100 µm (H, I′)
Fig. 6
Fig. 6
Model of PSC development in the post-natal brain and as a source of RA following stroke injury. Potential model of how during post-natal brain development Col1a1+ cells (putative PSCs) could ‘move’ from the meningeal space to the perivascular space around large diameter blood vessels via Virchow-Robin Spaces (A). Following injury Raldh1+ macrophages/microglia and Raldh1/2+ PSCs within the ischemic core produce RA capable of activating RA signaling in adjacent peri-infarct astrocytes and neurons (B)

Similar articles

Cited by

References

    1. Abnet K, Fawcett JW, Dunnett SB. Interactions between meningeal cells and astrocytes in vivo and in vitro. Brain Res Dev Brain Res. 1991;59:187–196. doi: 10.1016/0165-3806(91)90099-5. - DOI - PubMed
    1. Armulik A, Genove G, Betsholtz C. Pericytes: developmental, physiological, and pathological perspectives, problems, and promises. Dev Cell. 2011;21:193–215. doi: 10.1016/j.devcel.2011.07.001. - DOI - PubMed
    1. Boscia F, Esposito CL, Casamassa A, de Franciscis V, Annunziato L, Cerchia L. The isolectin IB4 binds RET receptor tyrosine kinase in microglia. J Neurochem. 2013;126:428–436. doi: 10.1111/jnc.12209. - DOI - PubMed
    1. Brinker T, Stopa E, Morrison J, Klinge P. A new look at cerebrospinal fluid circulation. Fluids Barriers CNS. 2014;11:10. doi: 10.1186/2045-8118-11-10. - DOI - PMC - PubMed
    1. Bundesen LQ, Scheel TA, Bregman BS, Kromer LF. Ephrin-B2 and EphB2 regulation of astrocyte-meningeal fibroblast interactions in response to spinal cord lesions in adult rats. J Neurosci. 2003;23:7789–7800. - PMC - PubMed

MeSH terms