. 2016 Sep;37(9):1141-53.
doi: 10.1038/aps.2016.63. Epub 2016 Jul 18.

Salvianolic acid B ameliorates depressive-like behaviors in chronic mild stress-treated mice: involvement of the neuroinflammatory pathway

Affiliations

Salvianolic acid B ameliorates depressive-like behaviors in chronic mild stress-treated mice: involvement of the neuroinflammatory pathway

Jin-Qiang Zhang et al. Acta Pharmacol Sin. 2016 Sep.

Abstract

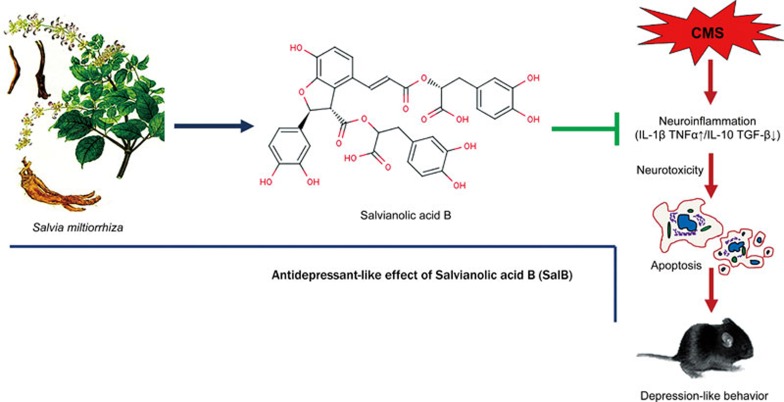
Aim: Major depressive disorder (MDD) is a debilitating mental disorder associated with dysfunction of the neurotransmitter-neuroendocrine system and neuroinflammatory responses. Salvianolic acid B (SalB) has shown a variety of pharmacological activities, including anti-inflammatory, antioxidant and neuroprotective effects. In this study, we examined whether SalB produced antidepressant-like actions in a chronic mild stress (CMS) mouse model, and explored the mechanisms underlying the antidepressant-like actions of SalB.

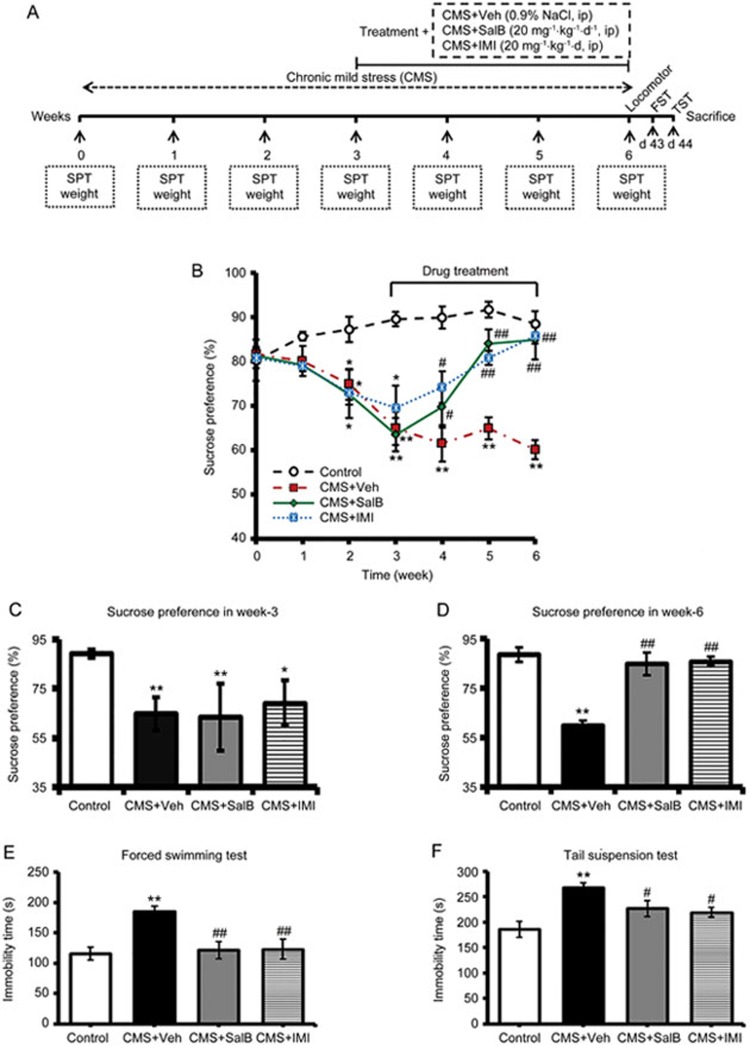
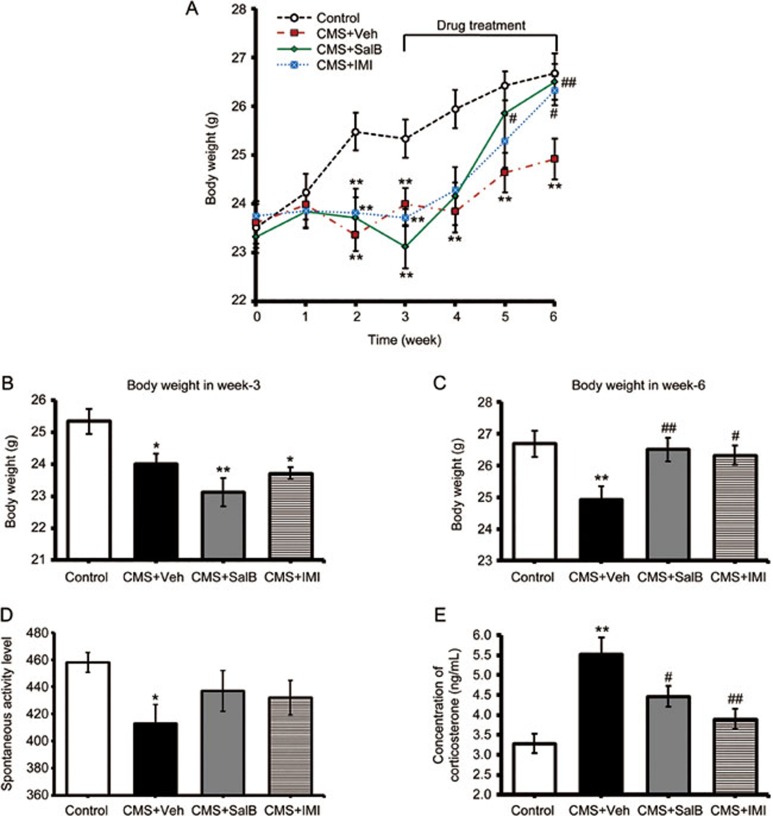
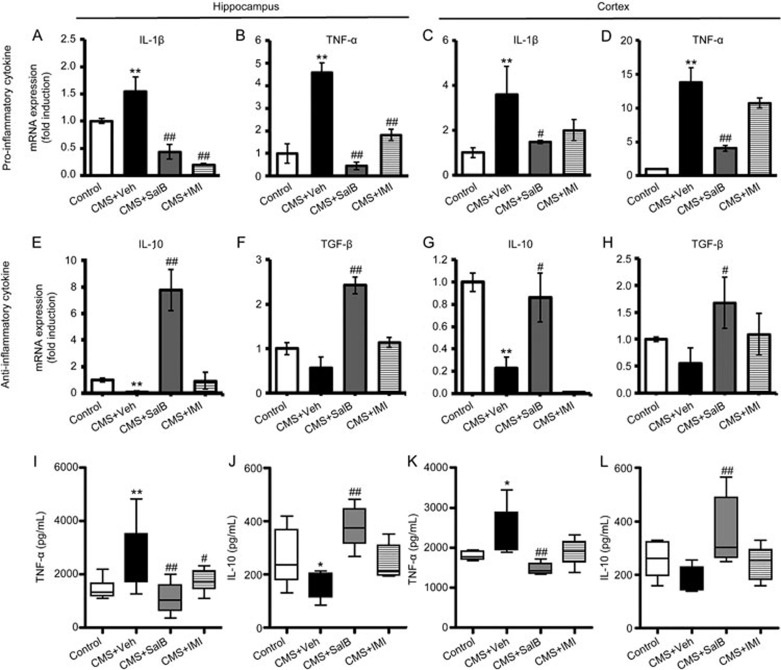
Methods: Mice were subjected to a CMS paradigm for 6 weeks. In the last 3 weeks the mice were daily administered SalB (20 mg·kg(-1)·d(-1), ip) or a positive control drug imipramine (20 mg·kg(-1)·d(-1), ip). The depressant-like behaviors were evaluated using the sucrose preference test, the forced swimming test (FST), and the tail suspension test (TST). The gene expression of cytokines in the hippocampus and cortex was analyzed with RT-PCR. Plasma corticosterone (CORT) and cerebral cytokines levels were assayed with an ELISA kit. Neural apoptosis and microglial activation in brain tissues were detected using immunofluorescence staining.

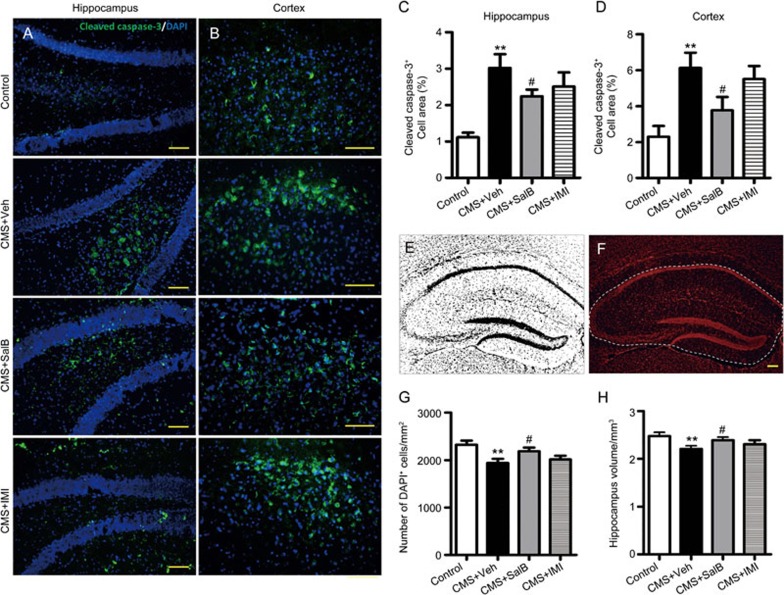
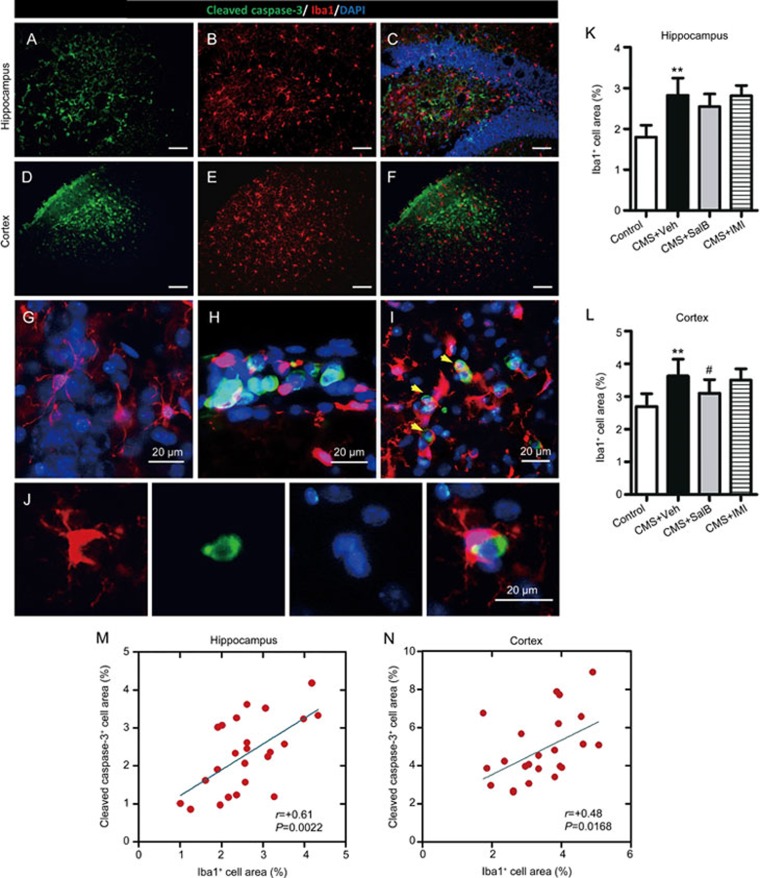
Results: Administration of SalB or imipramine reversed the reduced sucrose preference ratio of CMS-treated mice, and significantly decreased their immobility time in the FST and TST. Administration of SalB significantly decreased the expression of pro-inflammatory cytokines IL-1β and TNF-α, and markedly increased the expression of anti-inflammatory cytokines IL-10 and TGF-β in the hippocampus and cortex of CMS-treated mice, and normalized their elevated plasma CORT levels, whereas administration of imipramine did not significantly affect the imbalance between pro- and anti-inflammatory cytokines in the hippocampus and cortex of CMS-treated mice. Finally, administration of SalB significantly decreased CMS-induced apoptosis and microglia activation in the hippocampus and cortex, whereas administration of imipramine had no significant effect on CMS-induced apoptosis and microglia activation in the hippocampus and cortex.

Conclusion: SalB exerts potent antidepressant-like effects in CMS-induced mouse model of depression, which is associated with the inhibiting microglia-related apoptosis in the hippocampus and the cortex.


Figures

Figure 1
Figure 1
Effects of SalB and IMI treatment on depressive-like behaviors in CMS-treated C57BL/6 mice. (A) The experimental design. (B) Changes in sucrose consumption over 6 weeks in the control, CMS+Veh, CMS+SalB, and CMS+IMI groups. (C and D) The sucrose preference ratio of C57BL/6 mice at the 3rd and 6th weeks, respectively. (E and F) The duration of immobility of mice in the FST and in TST at the 6th week, respectively. Data are shown as the mean±SEM. n=8. *P<0.05, **P<0.01 vs the control group. #P<0.05, ##P<0.01 vs the CMS+Veh group.
Figure 2
Figure 2
Effects of SalB and IMI treatment on depression-related physiological indices. (A) Changes in body weight of mice over 6 weeks. (B and C) The body weights of control, CMS+Veh, CMS+SalB, and CMS+IMI mice at the 3rd and 6th weeks, respectively. (D) The locomotor activities of mice at the 6th week. (E) The plasma CORT levels in control and experimental groups. Data are shown as the mean±SEM. n=8. *P<0.05, **P<0.01 vs the control group. #P<0.05, ##P<0.01 vs the CMS+Veh group.
Figure 3
Figure 3
Effects of SalB and IMI treatment on pro- and anti-inflammatory cytokines expression in the hippocampus and cortex. mRNA expression of the pro-inflammatory cytokines IL-1β (A, C) and TNF-α (B, D) and anti-inflammatory cytokines IL-10 (E, G) and TGF-β (F, H) in the hippocampus and the cortex were assayed by RT-PCR. Protein levels of the pro-inflammatory cytokines TNF-α (I, K) and anti-inflammatory cytokines IL-10 (J, L) in the hippocampus and the cortex were assayed using ELISA. Scale bars represent the mean values, and the error bars represent the mean±SEM. n=6−8. *P<0.05, **P<0.01 vs the control group. #P<0.05, ##P<0.01 vs the CMS+Veh group.
Figure 4
Figure 4
Effects of SalB treatment on CMS-induced apoptosis in the hippocampus and cortex. (A) Representative images of apoptotic cells (cleaved caspase 3+) scattering in the hippocampus. (C) The bar graph indicates cleaved caspase 3+ cells (percentage of area) in the hippocampus. (B) Representative images of apoptotic cells scattering in the cortex. (D) The bar graph indicates cleaved caspase 3+ cells (percentage of area) in the cortex. (E) Representative image of the threshold set for DAPI+ staining with no background was used to measure cell density. (F) Representative image of the volume of the hippocampus. The bar graph indicates cell density (G) and the volumes of the hippocampus from various animals (H). Data are shown as the mean±SEM. n=6. *P<0.05, **P<0.01 vs the control group. #P<0.05, ##P<0.01 vs the CMS+Veh group. The scale bar represents 100 μm.
Figure 5
Figure 5
Effects of SalB treatment on microglial activation in the hippocampus and cortex. (A and D) Representative staining with the apoptotic cell marker (cleaved caspase 3) in the hippocampus and cortex, respectively. (B and E) Representative labeling with the microglial activation marker (Iba1) in the hippocampus and cortex, respectively. (C and F) Merged images, which indicate that cleaved caspase 3+ cells are associated with Iba1+ cells in the hippocampus and cortex. (G) Representative resting-state microglia images in the absence of apoptotic cells. (H) Representative activated microglia images in the regions of apoptosis. (I) Representative amoeba-like microglia images, which show their phagocytic activity in targeting apoptotic cells. (J) Representative high-resolution images of the phagocytosis of microglia. The bar graph indicates the percentage of Iba1+ area in the hippocampus (K) and cortex (L). Correlation between the percentage of cleaved caspase 3+ area and the percentage of Iba1+ area in the hippocampus (M) and cortex (N), with each circle representing individual mice (n=24). All data without (M and N) are shown as the mean±SEM. n=6. *P<0.05, **P<0.01 vs the control group. #P<0.05, ##P<0.01 vs the CMS+Veh group. The scale bar represents 100 μm.
Figure 6
Figure 6
Schematic representation of the antidepressant-like effects of SalB, which targets the neuroinflammatory pathway. Chronic stress can lead to inflammatory cytokine release and subsequent apoptosis, which results in depressive-like behaviors in mice. SalB treatment can regulate the balance of pro- and anti-inflammatory cytokines, and inhibit inflammatory-mediated apoptosis in the brain, which have a role in antidepressant activity.

References

    1. Kessler RC, Merikangas KR, Wang PS. Prevalence, comorbidity, and service utilization for mood disorders in the United States at the beginning of the twenty-first century. Annu Rev Clin Psycho 2007; 3: 137–58. - PubMed
    1. World Health Organization (2012) Media Centre Fact Sheet No 369. http://www.who.int/mediacentre/factsheets/fs369/en/.
    1. Nestler EJ, Barrot M, DiLeone RJ, Eisch AJ, Gold SJ, Monteggia LM. Neurobiology of depression. Neuron 2002; 34: 13–25. - PubMed
    1. Berton O, Nestler EJ. New approaches to antidepressant drug discovery: beyond monoamines. Nat Rev Neurosci 2006; 7: 137–51. - PubMed
    1. Entsuah AR, Huang H, Thase ME. Response and remission rates in different subpopulations with major depressive disorder administered venlafaxine, selective serotonin reuptake inhibitors, or placebo. J Clin Psychiat 2001; 62: 869–77. - PubMed

MeSH terms