. 2016 Sep 1;19(3):383-96.
doi: 10.1016/j.stem.2016.06.008. Epub 2016 Jul 14.

Ectopic miR-125a Expression Induces Long-Term Repopulating Stem Cell Capacity in Mouse and Human Hematopoietic Progenitors

Affiliations

Ectopic miR-125a Expression Induces Long-Term Repopulating Stem Cell Capacity in Mouse and Human Hematopoietic Progenitors

Edyta E Wojtowicz et al. Cell Stem Cell. .

Abstract

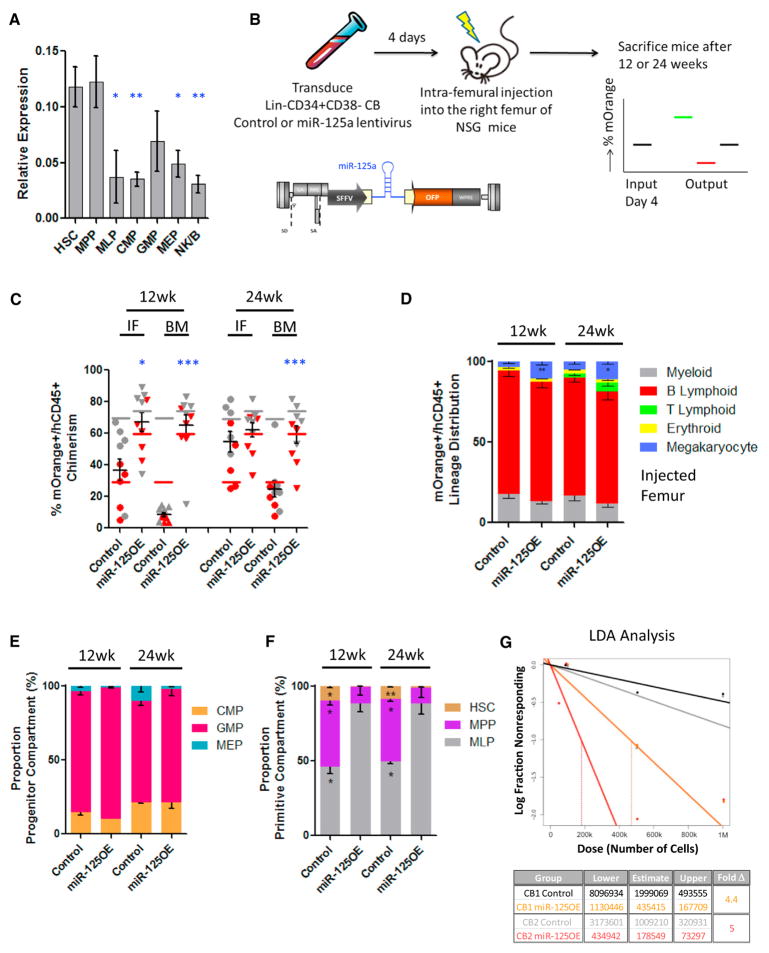
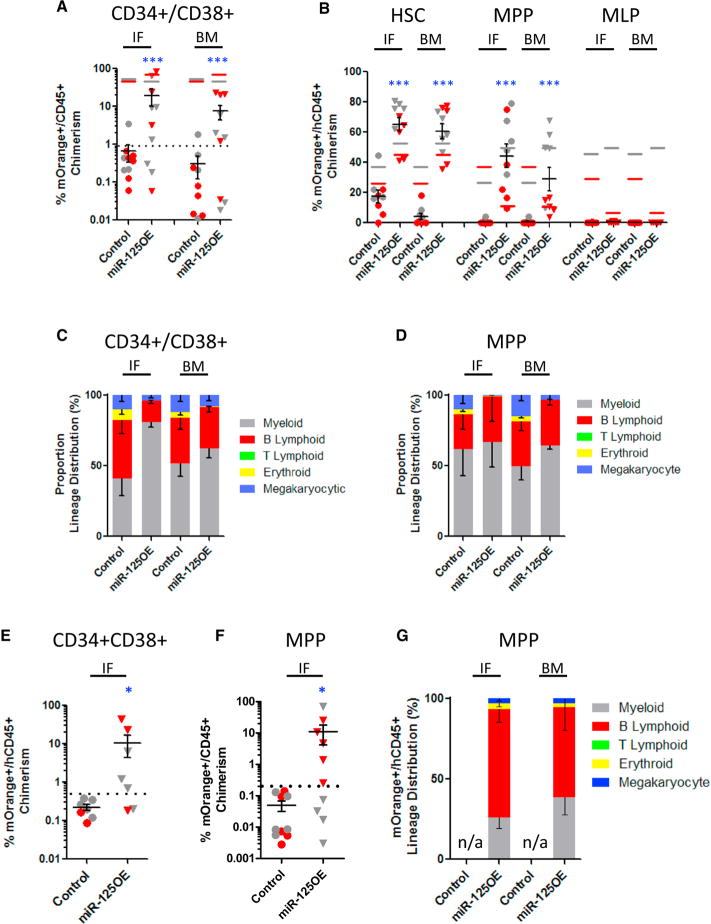
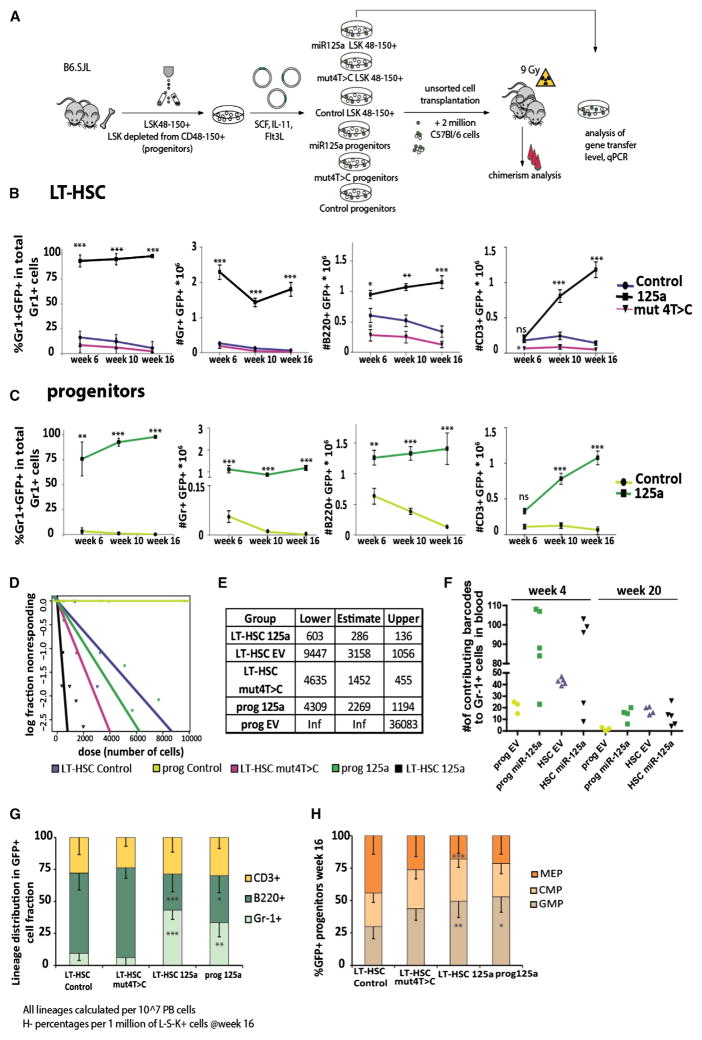
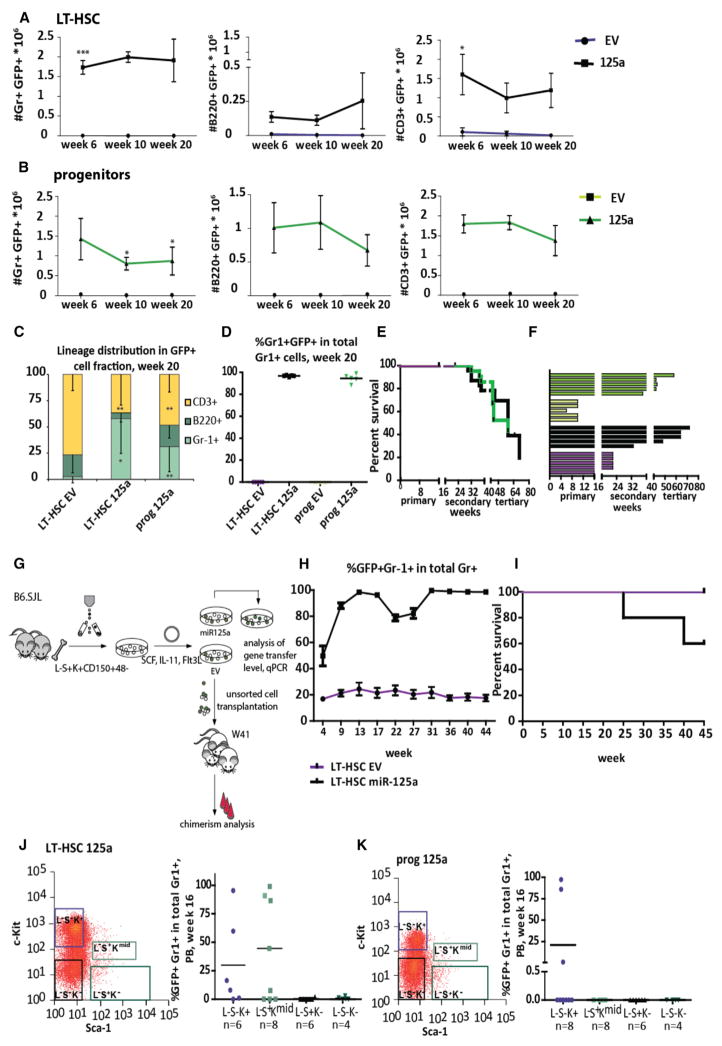
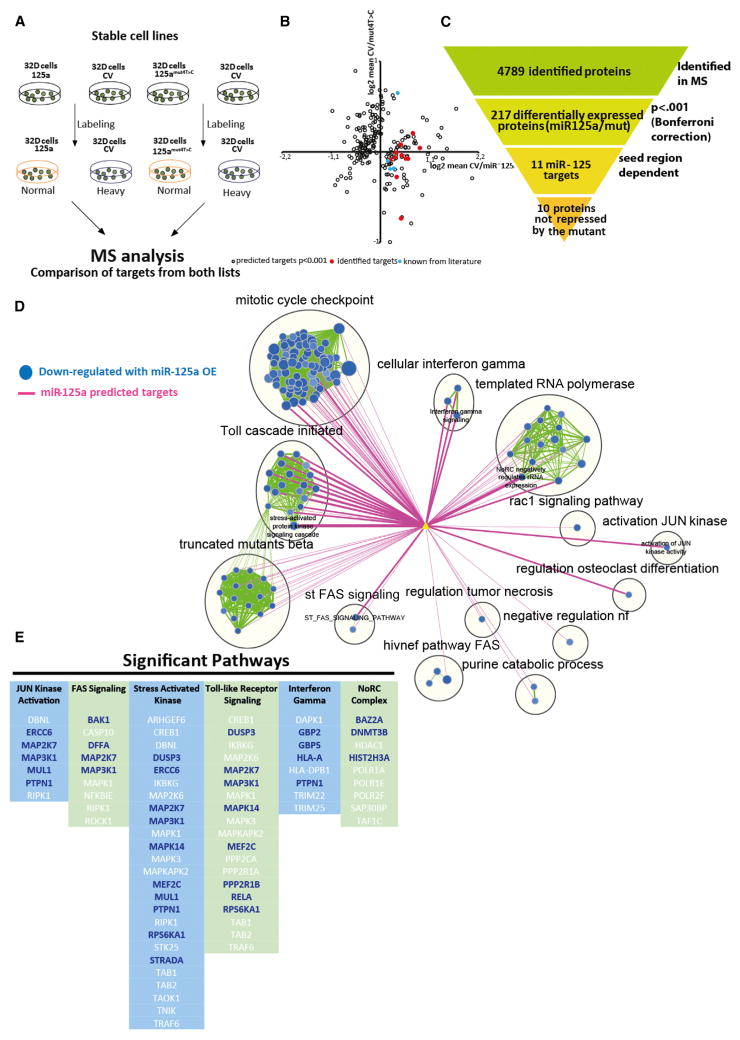
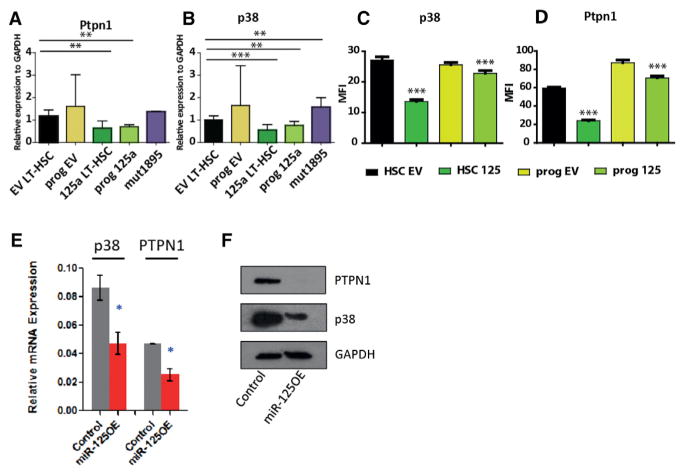
Umbilical cord blood (CB) is a convenient and broadly used source of hematopoietic stem cells (HSCs) for allogeneic stem cell transplantation. However, limiting numbers of HSCs remain a major constraint for its clinical application. Although one feasible option would be to expand HSCs to improve therapeutic outcome, available protocols and the molecular mechanisms governing the self-renewal of HSCs are unclear. Here, we show that ectopic expression of a single microRNA (miRNA), miR-125a, in purified murine and human multipotent progenitors (MPPs) resulted in increased self-renewal and robust long-term multi-lineage repopulation in transplanted recipient mice. Using quantitative proteomics and western blot analysis, we identified a restricted set of miR-125a targets involved in conferring long-term repopulating capacity to MPPs in humans and mice. Our findings offer the innovative potential to use MPPs with enhanced self-renewal activity to augment limited sources of HSCs to improve clinical protocols.


Figures

Figure 1
Figure 1. Enforced Expression of miR-125a Gives a Proliferative Advantage to HSCs
(A) RT-PCR expression levels of miR-125a in flow-sorted populations from the human Lin CB hierarchy. Cells were sorted to high purity according to the scheme outlined in Figure S1A. RNU48 was used as an endogenous control, and miR-125a levels were normalized to RNU48 levels. (B) The scheme describing the experimental system. (C) Human mOrange+ (mO+) chimerism at 12 and 24 weeks post-transplantation with pre-sorted CD34+CD38 umbilical cord blood cells transduced with a miR-125 lentiviral vector (miR-125OE) (n = 10) or an empty control vector (n = 10) in injected femur (IF) and distant bone marrow (BM) sites. Red and gray symbols represent replicate experiments using two distinct human CB pools. Color-matched bars represent input levels of mOrange+ cells at time of transplant for each experiment. (D) Lineage distribution of mO+ BM grafts 12 and 24 weeks post-transplantation. (E) Frequency of CMP, GMP, and MEP populations recovered from total BM within the CD34+CD38+ committed progenitor compartment. (F) Proportion of HSC, MPP, and MLP from total BM within the CD34+CD38 primitive compartment 12 and 24 weeks post-transplant. (G) Secondary transplantations. BM cells were harvested from two primary recipients and flow sorted for hCD45+mO+ cells. Stem cell frequencies were evaluated by limiting dilution transplantation into secondary mice. Confidence intervals were calculated using ELDA software. All data reflect mean values ± SEM. Statistical significance was assessed using a non-parametric Mann-Whitney test, where *p < 0.05, **p < 0.01, and ***p < 0.001.
Figure 2
Figure 2. miR-125a-Enforced Expression Improves the Repopulating Abilities of MPPs and CD34+CD38+ Committed Progenitors
(A) Human mO+ chimerism at 12 weeks post-transplantation with pre-sorted CD34+CD38+ committed progenitor compartment from human cord blood transduced with control or miR-125a expressing lentivectors. Red and gray symbols represent replicate experiments using two distinct human CB pools. Color-matched bars represent input levels of mOrange+ cells at time of transplant for each experiment. (B) Human mO+ chimerism at 12 weeks post-transplantation with pre-sorted HSC, MPP, and MLP human cord blood populations transduced with control or miR-125a expressing lentivectors. (C) Lineage distribution of mO+ BM grafts from transplanted CD34+CD38+ CB cells 12 weeks post-transplantation. (D) Lineage distribution of mO+ BM grafts from transplanted MPP 12 weeks post-transplantation. (E) Human mO+ chimerism at 8 weeks post-secondary transplant from CD34+CD38+ progenitors from primary mouse recipients. (F) Human mO+ chimerism at 8 weeks post-secondary transplant from MPP from primary mouse recipients. (G) Lineage distribution of mO+ BM grafts from MPP secondary recipient mice.
Figure 3
Figure 3. miR-125a Overexpression in Mouse LT-HSC and Progenitors Increases the Self-Renewal Potential
(A) Experimental setup. (B) Chimerism levels in Gr-1+ cells in primary recipients transplanted with LT-HSCs transduced with miR-125mut4T→C (n = 7), LT-HSCs with control vector (n = 11), or LT-HSCs with miR-125a (n = 16). Panels also show the absolute cell numbers of B220+, CD3ε+, or Gr-1+ cells in 106 viable peripheral blood cells, assessed by FACS at indicated time points. (C) Chimerism levels in recipients transplanted with progenitors overexpressing control vector (n = 17) or miR-125a (n = 9), measured by FACS at indicated time points. (D) Stem cell frequencies in mice transplanted with virally transduced LT-HSCs or progenitor cell populations, measured by limiting dilution. Confidence intervals were calculated using ELDA software. The colors indicate the various experimental groups and are the same throughout all figures. (E) The table containing the upper and lower confidence interval and estimated frequency of repopulating cells, calculated using ELDA. (F) The number of detected barcodes in peripheral blood in Gr-1+ cells at 4 or 20 weeks post-transplantation. (G) Lineage distribution in GFP+ peripheral blood cells. (H) Progenitor (LSK+) distribution LinGFP+ BM cells. Data in (E)–(H) reflect mean values ± SD. Statistical significance was assessed using a non-parametric Mann-Whitney test, where *p < 0.05, **p < 0.01, and ***p < 0.001.
Figure 4
Figure 4. Enforced miR-125a Ectopic Expression Sustains Repopulation Potential to MPPs in Serial Transplantation
(A) The number of donor-derived GFP+ B220+, CD3ε+, or Gr-1+ cells per 106 peripheral blood cells at indicated time points in secondary recipients transplanted with LT-HSCs transduced with control vector (n = 5) or miR-125a (n = 5). (B) The number of donor-derived GFP+ B220+, CD3ε+, or Gr-1+ cells per 106 peripheral blood cells at indicated time points in secondary recipients transplanted with progenitors transduced with control vector (n = 3) or miR-125a (n = 5). Data reflect mean values ± SEM. Statistical significance assessed using non-parametric Mann-Whitney test in case of Gr-1+ cells. (C) Peripheral blood lineage distribution of GFP+ cells in secondary recipients. (D) Peripheral blood Gr-1+ chimerism levels in secondary recipients 20 weeks post-transplantation. (E) The lifespan of transduced cells (plotted mice were considered positive if the percentage of Gr-1+ was >1%; brakes indicate serial transplantations). (F) The survival statistics of primary, secondary, and tertiary recipients transplanted with LT-HSCs or progenitors overexpressing miR-125a. Interruptions of the x axis indicate time points of serial transplantations. (G) Representative FACS plot of the LinSca-1+ c-kit+ compartment in BM cells from primary recipients transplanted with LT-HSCs overexpressing miR-125a. Right panel shows repopulation potential of indicated cell population assessed in secondary recipients. Donor cells were obtained from three mice. (H) Same as (G), but for progenitors overexpressing miR-125a. (I) Experimental setup for the second model, non-conditioned W41 mice used as recipients. (J) The kinetics of chimerism changes in Gr-1+ cells in the course of experiment. (K) The survival curve of non-irradiated W41 recipients transplanted with control or miR-125a-overexpressing LT-HSCs. All data reflect mean values ± SD, except for (K), which shows mean values ± SEM. Statistical significance was assessed using a non-parametric Mann-Whitney test, where *p < 0.05, **p < 0.01, and ***p < 0.001.
Figure 5
Figure 5. Molecular Mechanism of Sustained Self-Renewal Potential in Human and Mouse MPPs
(A) SILAC experimental setup. 32D cells were transduced with control vector, miR-125a, or 125mut4T →C. Cells were cultured in medium containing normal (miR-125a OE or miR-125mut4T→C samples) or heavy labeled amino acids (empty vector [EV]), as indicated. (B) Graphical representation of 217 differentially expressed proteins. Blue symbols indicate previously reported targets of the miR-125 family. Red symbols indicate the ten differentially expressed seed-sequence-containing proteins in miR-125a and 125mut4T→C samples. (C) Overview of filtering criteria. (D) Functional enrichment map for protein MS-based expression revealing miR-125a modulated pathways in human CD34+ CB cells. Only the subset of pathways that were found to have a significant overlap with miR-125a targets is shown. Blue nodes (circles) represent gene sets enriched in proteins downregulated in CD34+ human cord blood cells overexpressing miR-125a. Green line (edge) width between nodes corresponds to the number of shared proteins. Predicted miR-125a targets (yellow triangle) are connected to enriched pathways by pink edges and edge width is proportional to the overlap significance (Mann-Whitney [lesser] proteomics p = < 0.01). (E) Top six pathways significantly downregulated by miR-125a expression. Columns represent individual pathways, with the protein names listed vertically underneath. Protein names in blue are predicted miR-125a targets.
Figure 6
Figure 6. Target Validation
(A–D) Validation of selected targets in mouse transduced LT-HSC or progenitors at the transcript level (A and B) and protein level (C and D). (E and F) Repression of miR-125a targets in human CD34+ cells at the transcript level (E) and protein level (F). All data reflect mean values ± SEM. Statistical significance was assessed using a non-parametric Mann-Whitney test, where *p < 0.05, **p < 0.01, and ***p < 0.001.

Similar articles

Cited by

References

    1. Aljurf M, Rizzo JD, Mohty M, Hussain F, Madrigal A, Pasquini MC, Passweg J, Chaudhri N, Ghavamzadeh A, Solh HE, et al. Challenges and opportunities for HSCT outcome registries: perspective from international HSCT registries experts. Bone Marrow Transplant. 2014;49:1016–1021. - PubMed
    1. Ballen KK, Gluckman E, Broxmeyer HE. Umbilical cord blood transplantation: the first 25 years and beyond. Blood. 2013;122:491–498. - PMC - PubMed
    1. Balmain A, Harris CC. Carcinogenesis in mouse and human cells: parallels and paradoxes. Carcinogenesis. 2000;21:371–377. - PubMed
    1. Barker JN, Weisdorf DJ, Wagner JE. Creation of a double chimera after the transplantation of umbilical-cord blood from two partially matched unrelated donors. N Engl J Med. 2001;344:1870–1871. - PubMed
    1. Bartel DP. MicroRNAs: target recognition and regulatory functions. Cell. 2009;136:215–233. - PMC - PubMed

Publication types

MeSH terms